|
|
市場調査レポート
商品コード
1415580
体外診断の世界市場の評価:製品タイプ別、手法別、環境別、用途別、エンドユーザー別、地域別、機会、予測(2016年~2030年)Global In-vitro Diagnostics Market Assessment, By Product Type, By Techniques, By Settings, By Application, By End-user, By Region, Opportunities and Forecast, 2016-2030F |
||||||
|
|
|||||||
カスタマイズ可能
|
|||||||


| 体外診断の世界市場の評価:製品タイプ別、手法別、環境別、用途別、エンドユーザー別、地域別、機会、予測(2016年~2030年) |
|
出版日: 2024年01月24日
発行: Markets & Data
ページ情報: 英文 394 Pages
納期: 3~5営業日
|

- 全表示
- 概要
- 図表
- 目次
世界の体外診断の市場規模は、2022年の1,077億1,000万米ドルから2030年に1,655億5,000万米ドルに達し、予測期間の2022年~2030年にCAGRで5.52%の成長が見込まれています。
IVD機器市場は、これらの機器に対する需要と採用の増加により大幅な成長を示しています。この拡大は、製品の革新とIVD手法の新たな用途の開発を目的とした、主要企業の研究開発投資の活発化によってさらに後押しされています。British In-vitro Diagnostic Associationによると、これらの検査は臨床判断の約70%に大きな影響を与えます。さらに、診断における技術の進歩が、継続的な市場拡大への傾向を維持しています。
がんや遺伝子異常のような慢性疾患の有病率が世界中で上昇しており、体外診断の需要が高まっています。早期診断が患者を救うという意識の高まりが、体外診断製品への要求を促進しています。疾患の診断と将来の発生予測における体外診断の有効性は、市場成長をさらに加速させています。
2023年1月、QIAGENは診断検査室向けのEZ2 Connect MDxの発売を発表しました。EZ2 Connect MDxにより、検査室は高度な自動化を用いて30分以内に24の検体からDNAとRNAを同時に精製できるようになります。この機器は、欧州連合(EU)やその他の国々でも有効なCE-IVD適合マークを取得しています。
変形性膝関節症の高い有病率
遺伝性疾患、心血管疾患、神経疾患を含むさまざまな疾患の罹患率の増加は、医療制度に大きな負担をかけています。疾患の早期発見に体外診断(IVD)を効果的に利用することで、医師は適切な治療をより効率的に実施することができます。例えば、WHOが2022年9月に発表したファクトシートによると、非感染性疾患(NCDs)による死亡者数は4,100万人で、世界全体の死亡者数の約74%を占めています。
世界の体外診断市場では、早期診断に対する認識を高め、患者と医師の双方のレベルで体外診断を最適に使用することで、疾病負担の増大に効果的に対処することができます。高齢化に伴い、高血圧、糖尿病、心血管疾患、肝疾患、腎疾患などのさまざまな疾患に対する脆弱性が高まっているため、在宅医療向けのIVD機器の採用が拡大しました。
例えば、国連が2023年1月に報告したように、世界の65歳以上の人口は2021年に7億6,100万人で、2050年までに16億人に増加すると予測されています。80歳以上の人口はさらに急速に増加しています。
ポイントオブケア検査機器の採用の増加
疾病負担が増加し続ける中、医療機器メーカーは先進技術を利用した診断機器の開発に熱心に取り組んでいます。それに呼応するように、病院や検査室は正確なリアルタイムデータを求め、ポイントオブケア検査機器への志向を強めています。ポイントオブケア(PoC)検査は、患者の近くで実施され、通常、少量の血液サンプルのみを必要とし、臨床意思決定を即座に行うための迅速な検査結果を提供します。この機能により、医師は中央検査室からの結果を待つことなく、迅速に治療方針を決定することができます。
FUJIFILM Sonosite, Inc.は、2023年1月にインドでSonosite PX超音波システムを導入する計画を明らかにしました。この新製品は、臨床医のエルゴノミクスと効率を高め、医療パフォーマンスを向上させることを目的としています。
例えば、2023年8月には、Anbio Biotechnologyが、迅速なポイントオブケア検査に向けたLAMP診断手法に基づくハンドヘルド分析器を発売し、ポイントオブケア検査市場に参入しました。
資金調達と政府支援の増加
世界の体外診断市場では、政府機関、団体、機関が啓発活動を通じて体外診断の利用を積極的に推進しており、市場の成長を促進しています。世界保健機関(WHO)は、プライマリヘルスケアに向けた必須の体外診断と臨床検査室を備えた医療施設のモデルリストを導入し、疾病の負担と有病率に基づいた対処の重要性を強調しています。これらのカテゴリはさらに区分され、全般的な体外診断と特定の疾患をカバーしています。
当レポートでは、世界の体外診断市場について調査分析し、市場規模と予測、市場力学、主要企業情勢と見通しなどを提供しています。
目次
第1章 調査手法
第2章 プロジェクトの範囲と定義
第3章 エグゼクティブサマリー
第4章 世界の体外診断市場の見通し、2016年~2030年に
- 市場規模と予測
- 金額
- 数量
- 製品タイプ別
- 器具
- 試薬、消耗品
- データ管理ソフトウェア
- 手法別
- 免疫診断
- 臨床化学
- 分子診断
- 微生物学
- 血液学
- 凝固、止血
- 尿検査
- その他
- 環境別
- 研究室
- ポイントオブケア
- 用途別
- 眼科
- 感染症
- 糖尿病
- 薬物検査/ゲノム薬理学
- 自己免疫疾患
- 心臓病
- 腫瘍
- HIV/エイズ
- 腎臓
- 消化器科
- その他
- エンドユーザー別
- 臨床検査室
- 病院
- ポイントオブケア検査センター
- その他
- 地域別
- 北米
- 欧州
- アジア太平洋
- 南米
- 中東・アフリカ
- 市場シェア:企業別(2022年)
第5章 世界の体外診断市場の見通し:地域別(2016年~2030年)
- 北米
- 市場規模と予測
- 製品タイプ別
- 手法別
- 環境別
- 用途別
- エンドユーザー別
- 米国
- カナダ
- メキシコ
- 欧州
- ドイツ
- フランス
- イタリア
- 英国
- ロシア
- オランダ
- スペイン
- トルコ
- ポーランド
- アジア太平洋
- インド
- 中国
- 日本
- オーストラリア
- ベトナム
- 韓国
- インドネシア
- フィリピン
- 南米
- ブラジル
- アルゼンチン
- 中東・アフリカ
- サウジアラビア
- アラブ首長国連邦
- 南アフリカ
第6章 市場マッピング(2022年)
- 製品タイプ別
- 手法別
- 環境別
- 用途別
- エンドユーザー別
- 地域別
第7章 マクロ環境と産業構造
- 需給分析
- 輸出入の分析
- バリューチェーン分析
- PESTEL分析
- ポーターのファイブフォース分析
第8章 市場力学
- 成長促進要因
- 成長抑制要因(課題、抑制要因)
第9章 規制枠組みとイノベーション
- 臨床試験
- 特許情勢
- 規制当局の承認
- イノベーション/最新技術
第10章 主要企業情勢
- マーケットリーダー上位5社の競合マトリクス
- マーケットリーダー上位5社の市場収益分析(2022年)
- 合併と買収/合弁事業(該当する場合)
- SWOT分析(市場参入企業5社)
第11章 ケーススタディ
第12章 主要企業の見通し
- F. Hoffmann-La Roche AG
- Abbott Laboratories
- Danaher Corporation
- Siemens Healthineers AG
- Thermo Fisher Scientific Inc
- BD (Becton, Dickinson, and Company)
- Sysmex Corporation
- Illumina, Inc.
- Quidel Corp
- BioMerieux SA
- Charles River Laboratories
- Bio-Rad Laboratories, Inc
- DiaSorin S
- Agilent Technologies, Inc
- Qiagen
- Seegene Inc
第13章 戦略的推奨事項
第14章 当社について、免責事項
List of Tables
- Table 1 Pricing Analysis of Products from Key Players
- Table 2 Competition Matrix of Top 5 Market Leaders
- Table 3 Mergers & Acquisitions/ Joint Ventures (If Applicable)
- Table 4 About Us - Region and Countries Where We Have Executed Client Projects
List of Figures
- Figure 1. Global In-vitro Diagnostics Market, By Value, In USD Billion, 2016-2030F
- Figure 2. Global In-vitro Diagnostics Market, By Volume, In Million Units, 2016-2030F
- Figure 3. Global In-vitro Diagnostics Market Share, By Procedure Type, In USD Billion, 2016-2030F
- Figure 4. Global In-vitro Diagnostics Market Share, By Implant Type, In USD Billion, 2016-2030F
- Figure 5. Global In-vitro Diagnostics Market Share, By Device Type, In USD Billion, 2016-2030F
- Figure 6. Global In-vitro Diagnostics Market Share, By End-user, In USD Billion, 2016-2030F
- Figure 7. Global In-vitro Diagnostics Market Share, By Region, In USD Billion, 2016-2030F
- Figure 8. North America In-vitro Diagnostics Market, By Value, In USD Billion, 2016-2030F
- Figure 9. North America In-vitro Diagnostics Market, By Volume, In Million Units, 2016-2030F
- Figure 10. North America In-vitro Diagnostics Market Share, By Procedure Type, In USD Billion, 2016-2030F
- Figure 11. North America In-vitro Diagnostics Market Share, By Implant Type, In USD Billion, 2016-2030F
- Figure 12. North America In-vitro Diagnostics Market Share, By Device Type, In USD Billion, 2016-2030F
- Figure 13. North America In-vitro Diagnostics Market Share, By End-user, In USD Billion, 2016-2030F
- Figure 14. North America In-vitro Diagnostics Market Share, By Country, In USD Billion, 2016-2030F
- Figure 15. United States In-vitro Diagnostics Market, By Value, In USD Billion, 2016-2030F
- Figure 16. United States In-vitro Diagnostics Market, By Volume, In Million Units, 2016-2030F
- Figure 17. United States In-vitro Diagnostics Market Share, By Procedure Type, In USD Billion, 2016-2030F
- Figure 18. United States In-vitro Diagnostics Market Share, By Implant Type, In USD Billion, 2016-2030F
- Figure 19. United States In-vitro Diagnostics Market Share, By Device Type, In USD Billion, 2016-2030F
- Figure 20. United States In-vitro Diagnostics Market Share, By End-user, In USD Billion, 2016-2030F
- Figure 21. Canada In-vitro Diagnostics Market, By Value, In USD Billion, 2016-2030F
- Figure 22. Canada In-vitro Diagnostics Market, By Volume, In Million Units, 2016-2030F
- Figure 23. Canada In-vitro Diagnostics Market Share, By Procedure Type, In USD Billion, 2016-2030F
- Figure 24. Canada In-vitro Diagnostics Market Share, By Implant Type, In USD Billion, 2016-2030F
- Figure 25. Canada In-vitro Diagnostics Market Share, By Device Type, In USD Billion, 2016-2030F
- Figure 26. Canada In-vitro Diagnostics Market Share, By End-user, In USD Billion, 2016-2030F
- Figure 27. Mexico In-vitro Diagnostics Market, By Value, In USD Billion, 2016-2030F
- Figure 28. Mexico In-vitro Diagnostics Market, By Volume, In Million Units, 2016-2030F
- Figure 29. Mexico In-vitro Diagnostics Market Share, By Procedure Type, In USD Billion, 2016-2030F
- Figure 30. Mexico In-vitro Diagnostics Market Share, By Implant Type, In USD Billion, 2016-2030F
- Figure 31. Mexico In-vitro Diagnostics Market Share, By Device Type, In USD Billion, 2016-2030F
- Figure 32. Mexico In-vitro Diagnostics Market Share, By End-user, In USD Billion, 2016-2030F
- Figure 33. Europe In-vitro Diagnostics Market, By Value, In USD Billion, 2016-2030F
- Figure 34. Europe In-vitro Diagnostics Market, By Volume, In Million Units, 2016-2030F
- Figure 35. Europe In-vitro Diagnostics Market Share, By Procedure Type, In USD Billion, 2016-2030F
- Figure 36. Europe In-vitro Diagnostics Market Share, By Implant Type, In USD Billion, 2016-2030F
- Figure 37. Europe In-vitro Diagnostics Market Share, By Device Type, In USD Billion, 2016-2030F
- Figure 38. Europe In-vitro Diagnostics Market Share, By End-user, In USD Billion, 2016-2030F
- Figure 39. Europe In-vitro Diagnostics Market Share, By Country, In USD Billion, 2016-2030F
- Figure 40. Germany In-vitro Diagnostics Market, By Value, In USD Billion, 2016-2030F
- Figure 41. Germany In-vitro Diagnostics Market, By Volume, In Million Units, 2016-2030F
- Figure 42. Germany In-vitro Diagnostics Market Share, By Procedure Type, In USD Billion, 2016-2030F
- Figure 43. Germany In-vitro Diagnostics Market Share, By Implant Type, In USD Billion, 2016-2030F
- Figure 44. Germany In-vitro Diagnostics Market Share, By Device Type, In USD Billion, 2016-2030F
- Figure 45. Germany In-vitro Diagnostics Market Share, By End-user, In USD Billion, 2016-2030F
- Figure 46. France In-vitro Diagnostics Market, By Value, In USD Billion, 2016-2030F
- Figure 47. France In-vitro Diagnostics Market, By Volume, In Million Units, 2016-2030F
- Figure 48. France In-vitro Diagnostics Market Share, By Procedure Type, In USD Billion, 2016-2030F
- Figure 49. France In-vitro Diagnostics Market Share, By Implant Type, In USD Billion, 2016-2030F
- Figure 50. France In-vitro Diagnostics Market Share, By Device Type, In USD Billion, 2016-2030F
- Figure 51. France In-vitro Diagnostics Market Share, By End-user, In USD Billion, 2016-2030F
- Figure 52. Italy In-vitro Diagnostics Market, By Value, In USD Billion, 2016-2030F
- Figure 53. Italy In-vitro Diagnostics Market, By Volume, In Million Units, 2016-2030F
- Figure 54. Italy In-vitro Diagnostics Market Share, By Procedure Type, In USD Billion, 2016-2030F
- Figure 55. Italy In-vitro Diagnostics Market Share, By Implant Type, In USD Billion, 2016-2030F
- Figure 56. Italy In-vitro Diagnostics Market Share, By Device Type, In USD Billion, 2016-2030F
- Figure 57. Italy In-vitro Diagnostics Market Share, By End-user, In USD Billion, 2016-2030F
- Figure 58. United Kingdom In-vitro Diagnostics Market, By Value, In USD Billion, 2016-2030F
- Figure 59. United Kingdom In-vitro Diagnostics Market, By Volume, In Million Units, 2016-2030F
- Figure 60. United Kingdom In-vitro Diagnostics Market Share, By Procedure Type, In USD Billion, 2016-2030F
- Figure 61. United Kingdom In-vitro Diagnostics Market Share, By Implant Type, In USD Billion, 2016-2030F
- Figure 62. United Kingdom In-vitro Diagnostics Market Share, By Device Type, In USD Billion, 2016-2030F
- Figure 63. United Kingdom In-vitro Diagnostics Market Share, By End-user, In USD Billion, 2016-2030F
- Figure 64. Russia In-vitro Diagnostics Market, By Value, In USD Billion, 2016-2030F
- Figure 65. Russia In-vitro Diagnostics Market, By Volume, In Million Units, 2016-2030F
- Figure 66. Russia In-vitro Diagnostics Market Share, By Procedure Type, In USD Billion, 2016-2030F
- Figure 67. Russia In-vitro Diagnostics Market Share, By Implant Type, In USD Billion, 2016-2030F
- Figure 68. Russia In-vitro Diagnostics Market Share, By Device Type, In USD Billion, 2016-2030F
- Figure 69. Russia In-vitro Diagnostics Market Share, By End-user, In USD Billion, 2016-2030F
- Figure 70. Netherlands In-vitro Diagnostics Market, By Value, In USD Billion, 2016-2030F
- Figure 71. Netherlands In-vitro Diagnostics Market, By Volume, In Million Units, 2016-2030F
- Figure 72. Netherlands In-vitro Diagnostics Market Share, By Procedure Type, In USD Billion, 2016-2030F
- Figure 73. Netherlands In-vitro Diagnostics Market Share, By Implant Type, In USD Billion, 2016-2030F
- Figure 74. Netherlands In-vitro Diagnostics Market Share, By Device Type, In USD Billion, 2016-2030F
- Figure 75. Netherlands In-vitro Diagnostics Market Share, By End-user, In USD Billion, 2016-2030F
- Figure 76. Spain In-vitro Diagnostics Market, By Value, In USD Billion, 2016-2030F
- Figure 77. Spain In-vitro Diagnostics Market, By Volume, In Million Units, 2016-2030F
- Figure 78. Spain In-vitro Diagnostics Market Share, By Procedure Type, In USD Billion, 2016-2030F
- Figure 79. Spain In-vitro Diagnostics Market Share, By Implant Type, In USD Billion, 2016-2030F
- Figure 80. Spain In-vitro Diagnostics Market Share, By Device Type, In USD Billion, 2016-2030F
- Figure 81. Spain In-vitro Diagnostics Market Share, By End-user, In USD Billion, 2016-2030F
- Figure 82. Turkey In-vitro Diagnostics Market, By Value, In USD Billion, 2016-2030F
- Figure 83. Turkey In-vitro Diagnostics Market, By Volume, In Million Units, 2016-2030F
- Figure 84. Turkey In-vitro Diagnostics Market Share, By Procedure Type, In USD Billion, 2016-2030F
- Figure 85. Turkey In-vitro Diagnostics Market Share, By Implant Type, In USD Billion, 2016-2030F
- Figure 86. Turkey In-vitro Diagnostics Market Share, By Device Type, In USD Billion, 2016-2030F
- Figure 87. Turkey In-vitro Diagnostics Market Share, By End-user, In USD Billion, 2016-2030F
- Figure 88. Poland In-vitro Diagnostics Market, By Value, In USD Billion, 2016-2030F
- Figure 89. Poland In-vitro Diagnostics Market, By Volume, In Million Units, 2016-2030F
- Figure 90. Poland In-vitro Diagnostics Market Share, By Procedure Type, In USD Billion, 2016-2030F
- Figure 91. Poland In-vitro Diagnostics Market Share, By Implant Type, In USD Billion, 2016-2030F
- Figure 92. Poland In-vitro Diagnostics Market Share, By Device Type, In USD Billion, 2016-2030F
- Figure 93. Poland In-vitro Diagnostics Market Share, By End-user, In USD Billion, 2016-2030F
- Figure 94. South America In-vitro Diagnostics Market, By Value, In USD Billion, 2016-2030F
- Figure 95. South America In-vitro Diagnostics Market, By Volume, In Million Units, 2016-2030F
- Figure 96. South America In-vitro Diagnostics Market Share, By Procedure Type, In USD Billion, 2016-2030F
- Figure 97. South America In-vitro Diagnostics Market Share, By Implant Type, In USD Billion, 2016-2030F
- Figure 98. South America In-vitro Diagnostics Market Share, By Device Type, In USD Billion, 2016-2030F
- Figure 99. South America In-vitro Diagnostics Market Share, By End-user, In USD Billion, 2016-2030F
- Figure 100. South America In-vitro Diagnostics Market Share, By Country, In USD Billion, 2016-2030F
- Figure 101. Brazil In-vitro Diagnostics Market, By Value, In USD Billion, 2016-2030F
- Figure 102. Brazil In-vitro Diagnostics Market, By Volume, In Million Units, 2016-2030F
- Figure 103. Brazil In-vitro Diagnostics Market Share, By Procedure Type, In USD Billion, 2016-2030F
- Figure 104. Brazil In-vitro Diagnostics Market Share, By Implant Type, In USD Billion, 2016-2030F
- Figure 105. Brazil In-vitro Diagnostics Market Share, By Device Type, In USD Billion, 2016-2030F
- Figure 106. Brazil In-vitro Diagnostics Market Share, By End-user, In USD Billion, 2016-2030F
- Figure 107. Argentina In-vitro Diagnostics Market, By Value, In USD Billion, 2016-2030F
- Figure 108. Argentina In-vitro Diagnostics Market, By Volume, In Million Units, 2016-2030F
- Figure 109. Argentina In-vitro Diagnostics Market Share, By Procedure Type, In USD Billion, 2016-2030F
- Figure 110. Argentina In-vitro Diagnostics Market Share, By Implant Type, In USD Billion, 2016-2030F
- Figure 111. Argentina In-vitro Diagnostics Market Share, By Device Type, In USD Billion, 2016-2030F
- Figure 112. Argentina In-vitro Diagnostics Market Share, By End-user, In USD Billion, 2016-2030F
- Figure 113. Asia-Pacific In-vitro Diagnostics Market, By Value, In USD Billion, 2016-2030F
- Figure 114. Asia-Pacific In-vitro Diagnostics Market, By Volume, In Million Units, 2016-2030F
- Figure 115. Asia-Pacific In-vitro Diagnostics Market Share, By Procedure Type, In USD Billion, 2016-2030F
- Figure 116. Asia-Pacific In-vitro Diagnostics Market Share, By Implant Type, In USD Billion, 2016-2030F
- Figure 117. Asia-Pacific In-vitro Diagnostics Market Share, By Device Type, In USD Billion, 2016-2030F
- Figure 118. Asia-Pacific In-vitro Diagnostics Market Share, By End-user, In USD Billion, 2016-2030F
- Figure 119. Asia-Pacific In-vitro Diagnostics Market Share, By Country, In USD Billion, 2016-2030F
- Figure 120. India In-vitro Diagnostics Market, By Value, In USD Billion, 2016-2030F
- Figure 121. India In-vitro Diagnostics Market, By Volume, In Million Units, 2016-2030F
- Figure 122. India In-vitro Diagnostics Market Share, By Procedure Type, In USD Billion, 2016-2030F
- Figure 123. India In-vitro Diagnostics Market Share, By Implant Type, In USD Billion, 2016-2030F
- Figure 124. India In-vitro Diagnostics Market Share, By Device Type, In USD Billion, 2016-2030F
- Figure 125. India In-vitro Diagnostics Market Share, By End-user, In USD Billion, 2016-2030F
- Figure 126. China In-vitro Diagnostics Market, By Value, In USD Billion, 2016-2030F
- Figure 127. China In-vitro Diagnostics Market, By Volume, In Million Units, 2016-2030F
- Figure 128. China In-vitro Diagnostics Market Share, By Procedure Type, In USD Billion, 2016-2030F
- Figure 129. China In-vitro Diagnostics Market Share, By Implant Type, In USD Billion, 2016-2030F
- Figure 130. China In-vitro Diagnostics Market Share, By Device Type, In USD Billion, 2016-2030F
- Figure 131. China In-vitro Diagnostics Market Share, By End-user, In USD Billion, 2016-2030F
- Figure 132. Japan In-vitro Diagnostics Market, By Value, In USD Billion, 2016-2030F
- Figure 133. Japan In-vitro Diagnostics Market, By Volume, In Million Units, 2016-2030F
- Figure 134. Japan In-vitro Diagnostics Market Share, By Procedure Type, In USD Billion, 2016-2030F
- Figure 135. Japan In-vitro Diagnostics Market Share, By Implant Type, In USD Billion, 2016-2030F
- Figure 136. Japan In-vitro Diagnostics Market Share, By Device Type, In USD Billion, 2016-2030F
- Figure 137. Japan In-vitro Diagnostics Market Share, By End-user, In USD Billion, 2016-2030F
- Figure 138. Australia In-vitro Diagnostics Market, By Value, In USD Billion, 2016-2030F
- Figure 139. Australia In-vitro Diagnostics Market, By Volume, In Million Units, 2016-2030F
- Figure 140. Australia In-vitro Diagnostics Market Share, By Procedure Type, In USD Billion, 2016-2030F
- Figure 141. Australia In-vitro Diagnostics Market Share, By Implant Type, In USD Billion, 2016-2030F
- Figure 142. Australia In-vitro Diagnostics Market Share, By Device Type, In USD Billion, 2016-2030F
- Figure 143. Australia In-vitro Diagnostics Market Share, By End-user, In USD Billion, 2016-2030F
- Figure 144. Vietnam In-vitro Diagnostics Market, By Value, In USD Billion, 2016-2030F
- Figure 145. Vietnam In-vitro Diagnostics Market, By Volume, In Million Units, 2016-2030F
- Figure 146. Vietnam In-vitro Diagnostics Market Share, By Procedure Type, In USD Billion, 2016-2030F
- Figure 147. Vietnam In-vitro Diagnostics Market Share, By Implant Type, In USD Billion, 2016-2030F
- Figure 148. Vietnam In-vitro Diagnostics Market Share, By Device Type, In USD Billion, 2016-2030F
- Figure 149. Vietnam In-vitro Diagnostics Market Share, By End-user, In USD Billion, 2016-2030F
- Figure 150. South Korea In-vitro Diagnostics Market, By Value, In USD Billion, 2016-2030F
- Figure 151. South Korea In-vitro Diagnostics Market, By Volume, In Million Units, 2016-2030F
- Figure 152. South Korea In-vitro Diagnostics Market Share, By Procedure Type, In USD Billion, 2016-2030F
- Figure 153. South Korea In-vitro Diagnostics Market Share, By Implant Type, In USD Billion, 2016-2030F
- Figure 154. South Korea In-vitro Diagnostics Market Share, By Device Type, In USD Billion, 2016-2030F
- Figure 155. South Korea In-vitro Diagnostics Market Share, By End-user, In USD Billion, 2016-2030F
- Figure 156. Indonesia In-vitro Diagnostics Market, By Value, In USD Billion, 2016-2030F
- Figure 157. Indonesia In-vitro Diagnostics Market, By Volume, In Million Units, 2016-2030F
- Figure 158. Indonesia In-vitro Diagnostics Market Share, By Procedure Type, In USD Billion, 2016-2030F
- Figure 159. Indonesia In-vitro Diagnostics Market Share, By Implant Type, In USD Billion, 2016-2030F
- Figure 160. Indonesia In-vitro Diagnostics Market Share, By Device Type, In USD Billion, 2016-2030F
- Figure 161. Indonesia In-vitro Diagnostics Market Share, By End-user, In USD Billion, 2016-2030F
- Figure 162. Philippines In-vitro Diagnostics Market, By Value, In USD Billion, 2016-2030F
- Figure 163. Philippines In-vitro Diagnostics Market, By Volume, In Million Units, 2016-2030F
- Figure 164. Philippines In-vitro Diagnostics Market Share, By Procedure Type, In USD Billion, 2016-2030F
- Figure 165. Philippines In-vitro Diagnostics Market Share, By Implant Type, In USD Billion, 2016-2030F
- Figure 166. Philippines In-vitro Diagnostics Market Share, By Device Type, In USD Billion, 2016-2030F
- Figure 167. Philippines In-vitro Diagnostics Market Share, By End-user, In USD Billion, 2016-2030F
- Figure 168. Middle East & Africa In-vitro Diagnostics Market, By Value, In USD Billion, 2016-2030F
- Figure 169. Middle East & Africa In-vitro Diagnostics Market, By Volume, In Million Units, 2016-2030F
- Figure 170. Middle East & Africa In-vitro Diagnostics Market Share, By Procedure Type, In USD Billion, 2016-2030F
- Figure 171. Middle East & Africa In-vitro Diagnostics Market Share, By Implant Type, In USD Billion, 2016-2030F
- Figure 172. Middle East & Africa In-vitro Diagnostics Market Share, By Device Type, In USD Billion, 2016-2030F
- Figure 173. Middle East & Africa In-vitro Diagnostics Market Share, By End-user, In USD Billion, 2016-2030F
- Figure 174. Middle East & Africa In-vitro Diagnostics Market Share, By Country, In USD Billion, 2016-2030F
- Figure 175. Saudi Arabia In-vitro Diagnostics Market, By Value, In USD Billion, 2016-2030F
- Figure 176. Saudi Arabia In-vitro Diagnostics Market, By Volume, In Million Units, 2016-2030F
- Figure 177. Saudi Arabia In-vitro Diagnostics Market Share, By Procedure Type, In USD Billion, 2016-2030F
- Figure 178. Saudi Arabia In-vitro Diagnostics Market Share, By Implant Type, In USD Billion, 2016-2030F
- Figure 179. Saudi Arabia In-vitro Diagnostics Market Share, By Device Type, In USD Billion, 2016-2030F
- Figure 180. Saudi Arabia In-vitro Diagnostics Market Share, By End-user, In USD Billion, 2016-2030F
- Figure 181. UAE In-vitro Diagnostics Market, By Value, In USD Billion, 2016-2030F
- Figure 182. UAE In-vitro Diagnostics Market, By Volume, In Million Units, 2016-2030F
- Figure 183. UAE In-vitro Diagnostics Market Share, By Procedure Type, In USD Billion, 2016-2030F
- Figure 184. UAE In-vitro Diagnostics Market Share, By Implant Type, In USD Billion, 2016-2030F
- Figure 185. UAE In-vitro Diagnostics Market Share, By Device Type, In USD Billion, 2016-2030F
- Figure 186. UAE In-vitro Diagnostics Market Share, By End-user, In USD Billion, 2016-2030F
- Figure 187. South Africa In-vitro Diagnostics Market, By Value, In USD Billion, 2016-2030F
- Figure 188. South Africa In-vitro Diagnostics Market, By Volume, In Million Units, 2016-2030F
- Figure 189. South Africa In-vitro Diagnostics Market Share, By Procedure Type, In USD Billion, 2016-2030F
- Figure 190. South Africa In-vitro Diagnostics Market Share, By Implant Type, In USD Billion, 2016-2030F
- Figure 191. South Africa In-vitro Diagnostics Market Share, By Device Type, In USD Billion, 2016-2030F
- Figure 192. South Africa In-vitro Diagnostics Market Share, By End-user, In USD Billion, 2016-2030F
- Figure 193. By Type Map-Market Size (USD Billion) & Growth Rate (%), 2022
- Figure 194. By Deployment Map-Market Size (USD Billion) & Growth Rate (%), 2022
- Figure 195. By Device Type Map-Market Size (USD Billion) & Growth Rate (%), 2022
- Figure 196. By Industry Map-Market Size (USD Billion) & Growth Rate (%), 2022
- Figure 197. By Region Map-Market Size (USD Billion) & Growth Rate (%), 2022
Global In-vitro diagnostics market is projected to witness a CAGR of 5.52% during the forecast period 2022-2030F, growing from USD 107.71 billion in 2022 to USD 165.55 billion in 2030. In-vitro diagnostics (IVD) refers to medical instruments designed to conduct diagnostic tests on biological samples like blood, urine, and tissues. These tests are crucial in identifying and tracking infectious diseases, autoimmune disorders, and various medical conditions. Additionally, they are utilized to assess adjustments in drug therapy at regular intervals.
The market for IVD devices is experiencing significant growth due to increasing demand for and adoption of these devices. This expansion is further propelled by key players' heightened investments in research and development, aiming to innovate products and explore new applications for IVD techniques. The British In-vitro Diagnostic Association says these tests significantly impact around 70% of clinical decisions. Furthermore, technological advances in diagnostics sustain a tendency for continual market expansion.
The rising prevalence of chronic diseases like cancer and genetic anomalies across the globe is raising the demand for more in-vitro diagnostics procedures. Growing awareness about early diagnosis can save significant prospective patients and is driving the call for in-vitro diagnostics products. The efficacy of in-vitro diagnostics in diagnosing and predicting the future occurrence of diseases is further propelling the market growth.
In January 2023, QIAGEN announced the launch of EZ2 Connect MDx for diagnostic laboratories. EZ2 Connect MDx can help labs purify DNA and RNA from 24 samples simultaneously within 30 minutes with a high degree of automation. The device has gained the EU's CE-IVD compliance marking valid in the European Union and in other countries as well.
High Prevalence of Knee-Associated Osteoarthritis
The increasing incidence of various diseases, including genetic, cardiovascular, and neurological conditions, substantially strains the healthcare system. The effective utilization of In Vitro Diagnostics (IVD) for early disease detection enables physicians to implement suitable treatments more efficiently. For instance, based on a factsheet by the WHO in September 2022, Non-Communicable Diseases (NCDs) accounted for 41 million deaths, representing approximately 74% of all global fatalities.
In the global in vitro diagnostics market, the increasing burden of diseases can be effectively addressed through enhanced awareness of early diagnosis and the optimal use of in-vitro diagnostics (IVD) at both patient and physician levels. The aging population's heightened vulnerability to various conditions, including hypertension, diabetes, cardiovascular, liver, and kidney diseases, has resulted in greater adoption of homecare IVD devices.
For example, as reported by the United Nations in January 2023, the global population of individuals aged 65 years and older was 761 million in 2021, and this number is projected to increase to 1.6 billion by 2050. The population of those aged 80 years or older is growing even faster.
Increasing Adoption of Point-of-Care Testing Devices
As the burden of diseases continues to increase, medical device companies are diligently working on developing technologically advanced diagnostic devices. In response, hospitals and laboratories are growing inclined towards point-of-care testing devices, seeking accurate real-time data. Point-of-care (PoC) testing is conducted near the patient, typically requiring only a small blood sample, and delivers rapid test results for immediate clinical decision-making. This capability enables doctors to make prompt treatment decisions without waiting for results from a central laboratory.
FUJIFILM Sonosite, Inc. revealed its plans to introduce the Sonosite PX ultrasound system in India in January 2023. This new product launch aims to enhance clinician ergonomics and efficiency for improved medical performance.
For instance, in August 2023, Anbio Biotechnology launched a handheld analyzer based on the LAMP (Loop-Mediated Isothermal Amplification) diagnostic technique for rapid point-of-care testing to enter the point-of-care testing market.
Increasing Funding and Government Support
In the global in vitro diagnostics market, government organizations, associations, and agencies are actively promoting the utilization of IVD through awareness initiatives, thereby fostering market growth. The World Health Organization (WHO) has introduced a model list of Essential In-Vitro Diagnostics for primary healthcare and medical facilities equipped with clinical laboratories to emphasize the importance of addressing diseases based on their burden and prevalence. These categories are further subdivided to cover general IVDs and specific diseases.
For instance, in November 2023, the National Institute for Health and Care Research under the United Kingdom government awarded a fund of GBP 3 million to Newcastle Health-tech Research Centre to support a five-year program and develop innovative technology solutions in in-vitro diagnostics for improved and efficient diagnosis of people across the country.
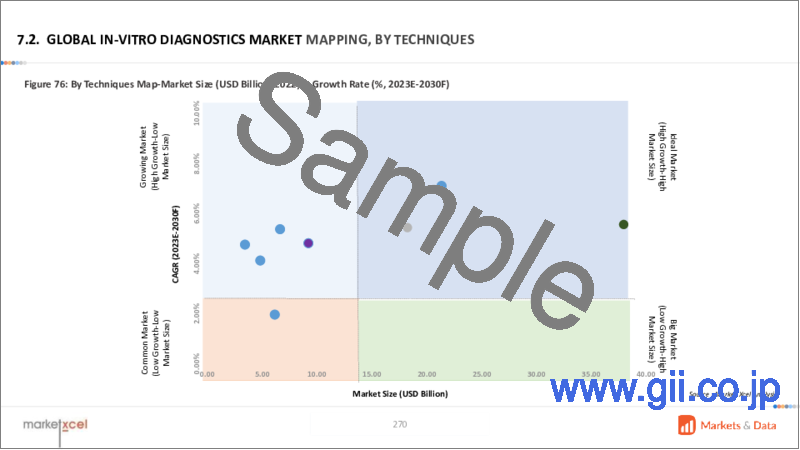
Dominance of Immunodiagnostics and Growth in Molecular Diagnostics
The immunodiagnostics segment is anticipated to be the leading segment during the assessment period in the market with 35.22% of value share in 2022 while the molecular diagnostics segment is expected to grow at a significantly higher pace with a CAGR of 7.1% during the forecast period. Rising cases of infectious diseases is resulting in a higher value share of the immunodiagnostics segment. The advances in the field of genetic and molecular research and its vast applications in diagnostics are driving the high growth rate for the molecular diagnostics segment.
For instance, in November 2023, based on the tried-and-true gold standard technology of the LightCycler Systems that came before it, Roche announced the launch of the LightCycler PRO System. This novel technology bridges the gap between in vitro diagnostics and translational research while raising the standard for performance and usability. Roche's molecular PCR testing offering, which features options for a range of healthcare professionals, is further enhanced with the LightCycler PRO System.
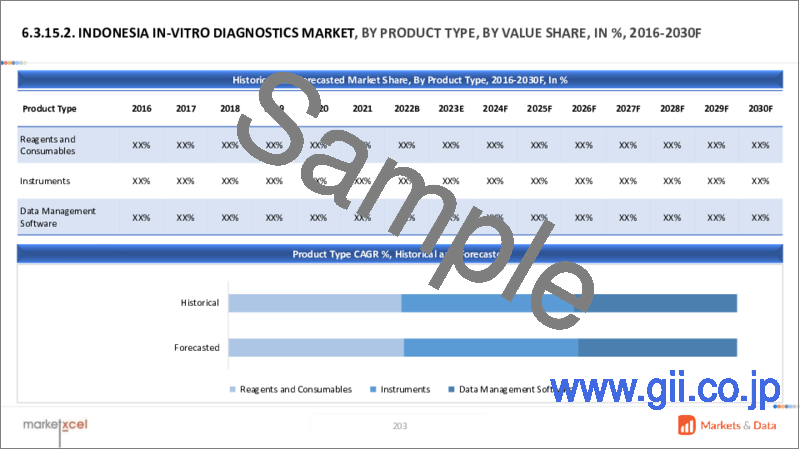
Reagents and Consumables is the Leading Segment
Based on product type, the in-vitro diagnostics market is segmented into reagents and consumables, instruments, and data management software. The reagents and consumables segment are anticipated to be the leading segment covering more than 65% of value share throughout the assessment period, owing to the regular consumption and frequent refiling of these in diagnostic laboratories. Instruments and software usually come in packages and are one-time purchases unlike reagents and consumables, thus contributing a lower share of revenue to the market. Growing demand for in-vitro diagnostic procedures is expected to propel the market share of these segments in the forecast years.
For instance, in June 2023, Kaneka Corporation received authorization for "KANEKA Immunochromatography Flu A/B & SARS-CoV-2 Ag" to manufacture and sell it. "KANEKA Immunochromatography Flu A/B & SARS-CoV-2 Ag" can detect COVID-19 (SARS-CoV-2) and influenza virus antigens in single sample collection. Earlier, the product was launched in May as an in-vitro diagnostic reagent. The suggested retail price of the product is 19,800 yen (for 10 tests) including taxes.
North America Dominates the In-vitro Diagnostics Market
North America is exerting its dominance in the In-vitro Diagnostics market. With high investment in research and development activities, technological advancements by key players, and highly advanced healthcare infrastructure in North American countries like the United States and Canada, the region is expected to dominate the market with the highest value share. The supportive government initiatives and favorable reimbursement scenario for managing the growing number of surgical procedures is also embracing the growth of the market in the region. Manufacturers are also gaining benefits from regulatory approvals and further market expansion. As per the American College of Rheumatology, approximately, 790,000 knee surgeries are performed annually in the United States.
For instance, in April 2023, the USFDA approved the MISHA Knee System, manufactured by Moximed, Inc. for marketing in the United States. MISHA Knee System is an implant placed alongside the knee joint which helps in reducing the weight load and saving knee damage without removing the knee joint.
Future Market Scenario (2023 - 2030F)
Growing prevalence of chronic diseases like cancer across the globe is driving the demand in the global in-vitro diagnostics market.
Growing technological advancement enhances the efficacy of diagnostic systems and is anticipated to propel market growth.
Immunodiagnostics is the leading segment in the in-vitro diagnostics market due to the high growth of infectious diseases while molecular diagnostics has the highest CAGR due to vast applications.
In-vitro diagnostics solutions will adapt to technological advancements to meet the needs of various customer segments.
Key Players Landscape and Outlook
Key participants in the In-vitro Diagnostics market include: F. Hoffmann-La Roche AG, Abbott Laboratories, Danaher Corporation, Siemens Healthineers AG, Thermo Fisher Scientific Inc., BD characterizes this landscape, as these companies compete to outperform one another in terms of patient compliance, safety, accuracy, and unique features. The market prognosis remains positive, owing to increased demand for in-vitro diagnostics procedures. In-vitro diagnostics manufacturers are actively involved in designing innovative solutions. Collaborations and developing technologies are projected to increase competition in this fast-paced market.
In January 2024, Roche announced a definitive agreement to acquire LumiraDx's point-of-care technology. Roche agreed to pay USD 295 million for the acquisition and up to USD 55 million for funding the venture until the deal gets completed in mid-2024. The acquisition offers a wide range of immunoassay and clinical chemistry tests to Roche, which have the potential for additional high-medical value in the future. The major focus area includes LumiraDx's CE-marked HbA1c test.
In March 2023, Abbott revealed that its Alinity I laboratory instrument, designed for diagnosing traumatic brain injuries (TBIs) and assessing concussions using two biomarkers, has obtained FDA approval, and is now set for commercial launch.
Table of Contents
1. Research Methodology
2. Project Scope & Definitions
3. Executive Summary
4. Global In-vitro Diagnostics Market Outlook, 2016-2030F
- 4.1. Market Size & Forecast
- 4.1.1. By Value
- 4.1.2. By Volume
- 4.2. By Product Type
- 4.2.1. Instruments
- 4.2.2. Reagents and Consumables
- 4.2.3. Data Management Software
- 4.3. By Techniques
- 4.3.1. Immunodiagnostics
- 4.3.2. Clinical Chemistry
- 4.3.3. Molecular Diagnostics
- 4.3.4. Microbiology
- 4.3.5. Haematology
- 4.3.6. Coagulation and Haemostasis
- 4.3.7. Urinalysis
- 4.3.8. Others
- 4.4. By Settings
- 4.4.1. Laboratories
- 4.4.2. Point-of-Care
- 4.5. By Application
- 4.5.1. Ophthalmology
- 4.5.2. Infectious Diseases
- 4.5.3. Diabetes
- 4.5.4. Drug Testing/ Pharmacogenomics
- 4.5.5. Autoimmune Diseases
- 4.5.6. Cardiology
- 4.5.7. Oncology
- 4.5.8. HIV/AIDS
- 4.5.9. Nephrology
- 4.5.10. Gastroenterology
- 4.5.11. Others
- 4.6. By End-user
- 4.6.1. Clinical Laboratories
- 4.6.2. Hospitals
- 4.6.3. Point-of-care testing centres
- 4.6.4. Others
- 4.7. By Region
- 4.7.1. North America
- 4.7.2. Europe
- 4.7.3. Asia-Pacific
- 4.7.4. South America
- 4.7.5. Middle East and Africa
- 4.8. By Company Market Share (%), 2022
5. Global In-vitro Diagnostics Market Outlook, By Region, 2016-2030F
- 5.1. North America*
- 5.1.1. Market Size & Forecast
- 5.1.1.1. By Value
- 5.1.1.2. By Volume
- 5.1.2. By Product Type
- 5.1.2.1. Instruments
- 5.1.2.2. Reagents and Consumables
- 5.1.2.3. Data Management Software
- 5.1.3. By Techniques
- 5.1.3.1. Immunodiagnostics
- 5.1.3.2. Clinical Chemistry
- 5.1.3.3. Molecular Diagnostics
- 5.1.3.4. Microbiology
- 5.1.3.5. Haematology
- 5.1.3.6. Coagulation and Haemostasis
- 5.1.3.7. Urinalysis
- 5.1.3.8. Others
- 5.1.4. By Settings
- 5.1.4.1. Laboratories
- 5.1.4.2. Point-of-Care
- 5.1.5. By Application
- 5.1.5.1. Ophthalmology
- 5.1.5.2. Infectious Diseases
- 5.1.5.3. Diabetes
- 5.1.5.4. Drug Testing/ Pharmacogenomics
- 5.1.5.5. Autoimmune Diseases
- 5.1.5.6. Cardiology
- 5.1.5.7. Oncology
- 5.1.5.8. HIV/AIDS
- 5.1.5.9. Nephrology
- 5.1.5.10. Gastroenterology
- 5.1.5.11. Others
- 5.1.6. By End-user
- 5.1.6.1. Clinical Laboratories
- 5.1.6.2. Hospitals
- 5.1.6.3. Point-of-care testing centres
- 5.1.6.4. Others
- 5.1.7. United States*
- 5.1.7.1. Market Size & Forecast
- 5.1.7.1.1. By Value
- 5.1.7.2. By Product Type
- 5.1.7.2.1. Instruments
- 5.1.7.2.2. Reagents and Consumables
- 5.1.7.2.3. Data Management Software
- 5.1.7.3. By Techniques
- 5.1.7.3.1. Immunodiagnostics
- 5.1.7.3.2. Clinical Chemistry
- 5.1.7.3.3. Molecular Diagnostics
- 5.1.7.3.4. Microbiology
- 5.1.7.3.5. Haematology
- 5.1.7.3.6. Coagulation and Haemostasis
- 5.1.7.3.7. Urinalysis
- 5.1.7.3.8. Others
- 5.1.7.4. By Settings
- 5.1.7.4.1. Laboratories
- 5.1.7.4.2. Point-of-Care
- 5.1.7.5. By Application
- 5.1.7.5.1. Ophthalmology
- 5.1.7.5.2. Infectious Diseases
- 5.1.7.5.3. Diabetes
- 5.1.7.5.4. Drug Testing/ Pharmacogenomics
- 5.1.7.5.5. Autoimmune Diseases
- 5.1.7.5.6. Cardiology
- 5.1.7.5.7. Oncology
- 5.1.7.5.8. HIV/AIDS
- 5.1.7.5.9. Nephrology
- 5.1.7.5.10. Gastroenterology
- 5.1.7.5.11. Others
- 5.1.7.6. By End-user
- 5.1.7.6.1. Clinical Laboratories
- 5.1.7.6.2. Hospitals
- 5.1.7.6.3. Point-of-care testing centres
- 5.1.7.6.4. Others
- 5.1.8. Canada
- 5.1.9. Mexico
- 5.1.1. Market Size & Forecast
All segments will be provided for all regions and countries covered:
- 5.2. Europe
- 5.2.1. Germany
- 5.2.2. France
- 5.2.3. Italy
- 5.2.4. United Kingdom
- 5.2.5. Russia
- 5.2.6. Netherlands
- 5.2.7. Spain
- 5.2.8. Turkey
- 5.2.9. Poland
- 5.3. Asia-Pacific
- 5.3.1. India
- 5.3.2. China
- 5.3.3. Japan
- 5.3.4. Australia
- 5.3.5. Vietnam
- 5.3.6. South Korea
- 5.3.7. Indonesia
- 5.3.8. Philippines
- 5.4. South America
- 5.4.1. Brazil
- 5.4.2. Argentina
- 5.5. Middle East & Africa
- 5.5.1. Saudi Arabia
- 5.5.2. UAE
- 5.5.3. South Africa
6. Market Mapping, 2022
- 6.1. By Product Type
- 6.2. By Techniques
- 6.3. By Settings
- 6.4. By Application
- 6.5. By End-user
- 6.6. By Region
7. Macro Environment and Industry Structure
- 7.1. Demand Supply Analysis
- 7.2. Import Export Analysis
- 7.3. Value Chain Analysis
- 7.4. PESTEL Analysis
- 7.4.1. Political Factors
- 7.4.2. Economic System
- 7.4.3. Social Implications
- 7.4.4. Technological Advancements
- 7.4.5. Environmental Impacts
- 7.4.6. Legal Compliances and Regulatory Policies (Statutory Bodies Included)
- 7.5. Porter's Five Forces Analysis
- 7.5.1. Supplier Power
- 7.5.2. Buyer Power
- 7.5.3. Substitution Threat
- 7.5.4. Threat from New Entrant
- 7.5.5. Competitive Rivalry
8. Market Dynamics
- 8.1. Growth Drivers
- 8.2. Growth Inhibitors (Challenges and Restraints)
9. Regulatory Framework and Innovation
- 9.1. Clinical Trial
- 9.2. Patent Landscape
- 9.3. Regulatory Approvals
- 9.4. Innovations/Emerging Technologies
10. Key Players Landscape
- 10.1. Competition Matrix of Top Five Market Leaders
- 10.2. Market Revenue Analysis of Top Five Market Leaders (in %, 2022)
- 10.3. Mergers and Acquisitions/Joint Ventures (If Applicable)
- 10.4. SWOT Analysis (For Five Market Players)
11. Case Studies
12. Key Players Outlook
- 12.1. F. Hoffmann-La Roche AG
- 12.1.1. Company Details
- 12.1.2. Key Management Personnel
- 12.1.3. Products & Services
- 12.1.4. Financials (As reported)
- 12.1.5. Key Market Focus & Geographical Presence
- 12.1.6. Recent Developments
- 12.2. Abbott Laboratories
- 12.3. Danaher Corporation
- 12.4. Siemens Healthineers AG
- 12.5. Thermo Fisher Scientific Inc
- 12.6. BD (Becton, Dickinson, and Company)
- 12.7. Sysmex Corporation
- 12.8. Illumina, Inc.
- 12.9. Quidel Corp
- 12.10. BioMerieux SA
- 12.11. Charles River Laboratories
- 12.12. Bio-Rad Laboratories, Inc
- 12.13. DiaSorin S
- 12.14. Agilent Technologies, Inc
- 12.15. Qiagen
- 12.16. Seegene Inc
Companies mentioned above DO NOT hold any order as per market share and can be changed as per information available during research work.
