|
|
市場調査レポート
商品コード
1408052
植物油の世界市場の評価:性質別、タイプ別、販売チャネル別、抽出方法別、包装タイプ別、最終用途別、地域別、機会、予測(2017年~2031年)Vegetable Oil Market Assessment, By Nature, By Type, By Sales Channel, By Extraction Method, By Packaging Type, By End-use, By Region, Opportunities, and Forecast, 2017-2031F |
||||||
|
|
|||||||
カスタマイズ可能
|
|||||||


| 植物油の世界市場の評価:性質別、タイプ別、販売チャネル別、抽出方法別、包装タイプ別、最終用途別、地域別、機会、予測(2017年~2031年) |
|
出版日: 2024年01月15日
発行: Markets & Data
ページ情報: 英文 214 Pages
納期: 3~5営業日
|

- 全表示
- 概要
- 図表
- 目次
世界の植物油の市場規模は2億5,120万トンと推定され、2031年に3億2,330万トンに達し、2024年~2031年の予測期間にCAGRで3.2%の成長が見込まれています。
食品部門の拡大と絶え間ない製品革新が市場を後押し
世界の植物油市場は、主に世界のフードサービス産業の拡大とバイオ燃料生産における植物油の利用の拡大により、大幅な成長を示しています。この成長は、革新的な製品を導入しようとする世界の市場参入企業の断固とした活動により継続すると予測されます。食品用途が植物油市場のかなりの部分を占める一方で、非食品・工業用セグメントはより速い成長が見込まれます。この加速はバイオディーゼル産業に起因しており、食用以外の植物油の多様な用途が強調されています。市場が進化するにつれ、消費者の選好の変化、技術の進歩、持続可能性への取り組みといった要因が相互に作用し、予測期間の植物油産業の軌道がさらに形成される見込みです。
アジア太平洋が最大の市場シェアを占める
アジア太平洋では、中国が植物油の消費と生産で最大のシェアを占めています。生産が多いにもかかわらず、消費が生産を上回っているため、輸出に対し輸入が多くなっています。さらに、中国は国内需要を満たすために余分な油を輸入しており、アジアの総生産の半分以上を占めています。さらに、マレーシアとタイもアジア最大の油生産国の1つであり、インドは米国、中国に次ぐ世界第3位の油消費国です。アジア太平洋は、野菜産業における生産シェアを独占しています。パーム油はもっとも生産の多い油で、そのほとんどがマレーシアとインドネシアで生産されています。また、インドネシアではバイオ燃料用を中心に国内でのパーム油の使用が増え続けているため、パーム油が世界的に植物油の価格に圧力をかけています。これに加え、2023年11月には、パーム油の輸入が多かったため、インドのパーム油輸入は11月に22%、12月に13%増加しました。
強化植物油への需要の増加
強化植物油への高い需要は、主に栄養面での利点を求める健康志向の消費者の増加に起因しています。この動向は、栄養不足に対処するための積極的なアプローチを提唱する食事ガイドラインや保健キャンペーンと一致しています。需要の高まりを受け、業界は戦略的に技術革新を重視してきました。各社は、健康志向が高まる市場に対応するため、強化植物油の開発と普及に積極的に取り組んでいます。このシフトは消費者の選好を反映したものであり、進化する健康とウェルネスの動向に合わせるという業界のコミットメントを浮き彫りにし、それによって人々の全体的なウェルビーイングに寄与しています。
COVID-19の影響
植物油産業はCOVID-19パンデミックにおいて、ロックダウン中に家庭で調理する人が増えたため、需要の急増という大きな課題に直面しました。また、この部門は労働力不足、輸送の途絶、世界のサプライチェーンの問題に苦戦し、生産と流通に影響を与えました。こうした課題は価格変動につながり、市場に不確実性をもたらしました。同時に、健康への関心の高まりから、パンデミックは消費者の選好がより健康的な油へと変化するきっかけとなっています。この変化は市場力学に影響を与え、健康志向の選択肢の価格変動を引き起こしました。この危機は、ロジスティクス上のハードルの中、進化する消費者行動に適応しようとする業界の苦闘を浮き彫りにしました。
主要企業の動向と見通し
植物油市場は、植物油が必須ビタミンを豊富に含むことから成長が見込まれます。この前向きな見通しは、食品産業と非食品産業の両方で植物油が広く使用されていることから生じています。政府の支援的な政策や取り組み、持続可能なビジネス慣行を採用するメーカーが、市場の成長軌道を形成すると予測されます。さらに、多様な産業における植物油の利用の増加が、楽観的な見通しをさらに助長しています。必須栄養素を含む多用途製品として、植物油は成長中の市場の需要に応える立場にあり、進化する世界の経済情勢における主力となっています。
当レポートでは、世界の植物油市場について調査分析し、市場規模と予測、市場力学、主要企業情勢と見通しなどを提供しています。
目次
第1章 調査手法
第2章 プロジェクトの範囲と定義
第3章 植物油の世界市場に対するCOVID-19の影響
第4章 エグゼクティブサマリー
第5章 顧客の声
- 人口統計(年齢/コホート分析 - 団塊の世代とX世代、ミレニアル世代、Z世代、性別、所得 - 低、中、高、地域、国籍など)
- ブランドと製品の認知度
- 購入決定において考慮される要素
- 購入チャネル
- 購入頻度
- 既存のユーザーまたは対象ユーザー
- 友人、家族からの推奨/オンラインのレビュー
- 製品/ブランドの吸収におけるブランドアンバサダーまたはインフルエンサーマーケティングの役割
第6章 植物油市場の見通し(2017年~2031年)
- 市場規模と予測
- 金額
- 数量
- 性質別
- オーガニック
- 従来型
- タイプ別
- パーム油
- 大豆油
- ココナッツオイル
- 菜種油
- キャノーラ油
- ひまわり油
- その他
- 販売チャネル別
- 直販
- スーパーマーケット/ハイパーマーケット
- コンビニエンスストア
- 専門店
- eコマース
- その他
- 抽出方法別
- 機械的抽出
- 溶剤抽出
- 水素化
- スパージング
- 包装タイプ別
- 缶
- ボトル
- パウチ
- その他
- 最終用途別
- 食品
- 医薬品
- パーソナルケア製品
- 工業
- その他
- 地域別
- 北米
- 欧州
- 南米
- アジア太平洋
- 中東・アフリカ
- 市場シェア:企業別(2023年)
第7章 植物油市場の見通し:地域別(2017年~2031年)
- 北米
- 市場規模と予測
- 性質別
- タイプ別
- 販売チャネル別
- 抽出方法別
- 包装タイプ別
- 最終用途別
- 米国
- カナダ
- メキシコ
- 欧州
- ドイツ
- フランス
- イタリア
- 英国
- ロシア
- オランダ
- スペイン
- トルコ
- ポーランド
- 南米
- ブラジル
- アルゼンチン
- アジア太平洋
- インド
- 中国
- 日本
- オーストラリア
- ベトナム
- 韓国
- インドネシア
- フィリピン
- 中東・アフリカ
- アラブ首長国連邦
- サウジアラビア
- 南アフリカ
第8章 市場マッピング(2023年)
- 性質別
- タイプ別
- 販売チャネル別
- 抽出方法別
- 包装タイプ別
- 最終用途別
- 地域別
第9章 マクロ環境と産業構造
- 需給分析
- 輸出入の分析
- バリューチェーン分析
- PESTEL分析
- ポーターのファイブフォース分析
第10章 市場力学
- 成長促進要因
- 成長抑制要因(課題、抑制要因)
第11章 主要企業情勢
- マーケットリーダー上位5社の競合マトリクス
- マーケットリーダー上位5社の市場収益分析(2023年)
- 合併と買収/合弁事業(該当する場合)
- SWOT分析(市場参入企業5社)
- 特許分析(該当する場合)
第12章 価格分析
第13章 ケーススタディ
第14章 主要企業の見通し
- Cargill, Incorporated
- ADANI GROUP (Adani Wilmar)
- CONAGRA BRANDS, Inc.
- Bunge Global SA
- Emami Agrotech Ltd.
- Wilmar International Ltd
- Sime Darby Plantation
- IOI Corporation
- Louis Dreyfus Company B.V.
- Flambo International Limited (Golden Agri-Resources)
第15章 戦略的推奨事項
第16章 当社について、免責事項
List of Tables
- Table 1. Pricing Analysis of Products from Key Players
- Table 2. Competition Matrix of Top 5 Market Leaders
- Table 3. Mergers & Acquisitions/ Joint Ventures (If Applicable)
- Table 4. About Us - Regions and Countries Where We Have Executed Client Projects
List of Figures
- Figure 1. Global Vegetable Oil Market, By Value, In USD Billion, 2017-2031F
- Figure 2. Global Vegetable Oil Market, By Volume, In Million Tons, 2017-2031F
- Figure 3. Global Vegetable Oil Market Share (%), By Nature, 2017-2031F
- Figure 4. Global Vegetable Oil Market Share (%), By Type, 2017-2031F
- Figure 5. Global Vegetable Oil Market Share (%), By Sales Channel, 2017-2031F
- Figure 6. Global Vegetable Oil Market Share (%), By Extraction Method, 2017-2031F
- Figure 7. Global Vegetable Oil Market Share (%), By Packaging Type, 2017-2031F
- Figure 8. Global Vegetable Oil Market Share (%), By End-use, 2017-2031F
- Figure 9. Global Vegetable Oil Market Share (%), By Region, 2017-2031F
- Figure 10. North America Vegetable Oil Market, By Value, In USD Billion, 2017-2031F
- Figure 11. North America Vegetable Oil Market, By Volume, In Million Tons, 2017-2031F
- Figure 12. North America Vegetable Oil Market Share (%), By Nature, 2017-2031F
- Figure 13. North America Vegetable Oil Market Share (%), By Type, 2017-2031F
- Figure 14. North America Vegetable Oil Market Share (%), By Sales Channel, 2017-2031F
- Figure 15. North America Vegetable Oil Market Share (%), By Extraction Method, 2017-2031F
- Figure 16. North America Vegetable Oil Market Share (%), By Packaging Type, 2017-2031F
- Figure 17. North America Vegetable Oil Market Share (%), By End-use, 2017-2031F
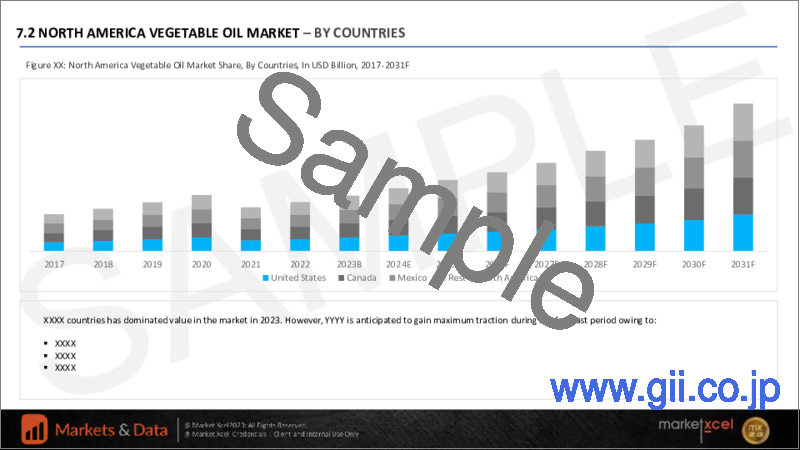
- Figure 18. North America Vegetable Oil Market Share (%), By Country, 2017-2031F
- Figure 19. United States Vegetable Oil Market, By Value, In USD Billion, 2017-2031F
- Figure 20. United States Vegetable Oil Market, By Volume, In Million Tons, 2017-2031F
- Figure 21. United States Vegetable Oil Market Share (%), By Nature, 2017-2031F
- Figure 22. United States Vegetable Oil Market Share (%), By Type, 2017-2031F
- Figure 23. United States Vegetable Oil Market Share (%), By Sales Channel, 2017-2031F
- Figure 24. United States Vegetable Oil Market Share (%), By Extraction Method, 2017-2031F
- Figure 25. United States Vegetable Oil Market Share (%), By Packaging Type, 2017-2031F
- Figure 26. United States Vegetable Oil Market Share (%), By End-use, 2017-2031F
- Figure 27. Canada Vegetable Oil Market, By Value, In USD Billion, 2017-2031F
- Figure 28. Canada Vegetable Oil Market, By Volume, In Million Tons, 2017-2031F
- Figure 29. Canada Vegetable Oil Market Share (%), By Nature, 2017-2031F
- Figure 30. Canada Vegetable Oil Market Share (%), By Type, 2017-2031F
- Figure 31. Canada Vegetable Oil Market Share (%), By Sales Channel, 2017-2031F
- Figure 32. Canada Vegetable Oil Market Share (%), By Extraction Method, 2017-2031F
- Figure 33. Canada Vegetable Oil Market Share (%), By Packaging Type, 2017-2031F
- Figure 34. Canada Vegetable Oil Market Share (%), By End-use, 2017-2031F
- Figure 35. Mexico Vegetable Oil Market, By Value, In USD Billion, 2017-2031F
- Figure 36. Mexico Vegetable Oil Market, By Volume, In Million Tons, 2017-2031F
- Figure 37. Mexico Vegetable Oil Market Share (%), By Nature, 2017-2031F
- Figure 38. Mexico Vegetable Oil Market Share (%), By Type, 2017-2031F
- Figure 39. Mexico Vegetable Oil Market Share (%), By Sales Channel, 2017-2031F
- Figure 40. Mexico Vegetable Oil Market Share (%), By Extraction Method, 2017-2031F
- Figure 41. Mexico Vegetable Oil Market Share (%), By Packaging Type, 2017-2031F
- Figure 42. Mexico Vegetable Oil Market Share (%), By End-use, 2017-2031F
- Figure 43. Europe Vegetable Oil Market, By Value, In USD Billion, 2017-2031F
- Figure 44. Europe Vegetable Oil Market, By Volume, In Million Tons, 2017-2031F
- Figure 45. Europe Vegetable Oil Market Share (%), By Nature, 2017-2031F
- Figure 46. Europe Vegetable Oil Market Share (%), By Type, 2017-2031F
- Figure 47. Europe Vegetable Oil Market Share (%), By Sales Channel, 2017-2031F
- Figure 48. Europe Vegetable Oil Market Share (%), By Extraction Method, 2017-2031F
- Figure 49. Europe Vegetable Oil Market Share (%), By Packaging Type, 2017-2031F
- Figure 50. Europe Vegetable Oil Market Share (%), By End-use, 2017-2031F
- Figure 51. Europe Vegetable Oil Market Share (%), By Country, 2017-2031F
- Figure 52. Germany Vegetable Oil Market, By Value, In USD Billion, 2017-2031F
- Figure 53. Germany Vegetable Oil Market, By Volume, In Million Tons, 2017-2031F
- Figure 54. Germany Vegetable Oil Market Share (%), By Nature, 2017-2031F
- Figure 55. Germany Vegetable Oil Market Share (%), By Type, 2017-2031F
- Figure 56. Germany Vegetable Oil Market Share (%), By Sales Channel, 2017-2031F
- Figure 57. Germany Vegetable Oil Market Share (%), By Extraction Method, 2017-2031F
- Figure 58. Germany Vegetable Oil Market Share (%), By Packaging Type, 2017-2031F
- Figure 59. Germany Vegetable Oil Market Share (%), By End-use, 2017-2031F
- Figure 60. France Vegetable Oil Market, By Value, In USD Billion, 2017-2031F
- Figure 61. France Vegetable Oil Market, By Volume, In Million Tons, 2017-2031F
- Figure 62. France Vegetable Oil Market Share (%), By Nature, 2017-2031F
- Figure 63. France Vegetable Oil Market Share (%), By Type, 2017-2031F
- Figure 64. France Vegetable Oil Market Share (%), By Sales Channel, 2017-2031F
- Figure 65. France Vegetable Oil Market Share (%), By Extraction Method, 2017-2031F
- Figure 66. France Vegetable Oil Market Share (%), By Packaging Type, 2017-2031F
- Figure 67. France Vegetable Oil Market Share (%), By End-use, 2017-2031F
- Figure 68. Italy Vegetable Oil Market, By Value, In USD Billion, 2017-2031F
- Figure 69. Italy Vegetable Oil Market, By Volume, In Million Tons, 2017-2031F
- Figure 70. Italy Vegetable Oil Market Share (%), By Nature, 2017-2031F
- Figure 71. Italy Vegetable Oil Market Share (%), By Type, 2017-2031F
- Figure 72. Italy Vegetable Oil Market Share (%), By Sales Channel, 2017-2031F
- Figure 73. Italy Vegetable Oil Market Share (%), By Extraction Method, 2017-2031F
- Figure 74. Italy Vegetable Oil Market Share (%), By Packaging Type, 2017-2031F
- Figure 75. Italy Vegetable Oil Market Share (%), By End-use, 2017-2031F
- Figure 76. United Kingdom Vegetable Oil Market, By Value, In USD Billion, 2017-2031F
- Figure 77. United Kingdom Vegetable Oil Market, By Volume, In Million Tons, 2017-2031F
- Figure 78. United Kingdom Vegetable Oil Market Share (%), By Nature, 2017-2031F
- Figure 79. United Kingdom Vegetable Oil Market Share (%), By Type, 2017-2031F
- Figure 80. United Kingdom Vegetable Oil Market Share (%), By Sales Channel, 2017-2031F
- Figure 81. United Kingdom Vegetable Oil Market Share (%), By Extraction Method, 2017-2031F
- Figure 82. United Kingdom Vegetable Oil Market Share (%), By Packaging Type, 2017-2031F
- Figure 83. United Kingdom Vegetable Oil Market Share (%), By End-use, 2017-2031F
- Figure 84. Russia Vegetable Oil Market, By Value, In USD Billion, 2017-2031F
- Figure 85. Russia Vegetable Oil Market, By Volume, In Million Tons, 2017-2031F
- Figure 86. Russia Vegetable Oil Market Share (%), By Nature, 2017-2031F
- Figure 87. Russia Vegetable Oil Market Share (%), By Type, 2017-2031F
- Figure 88. Russia Vegetable Oil Market Share (%), By Sales Channel, 2017-2031F
- Figure 89. Russia Vegetable Oil Market Share (%), By Extraction Method, 2017-2031F
- Figure 90. Russia Vegetable Oil Market Share (%), By Packaging Type, 2017-2031F
- Figure 91.
- Figure 92. Russia Vegetable Oil Market Share (%), By End-use, 2017-2031F
- Figure 93. Netherlands Vegetable Oil Market, By Value, In USD Billion, 2017-2031F
- Figure 94. Netherlands Vegetable Oil Market, By Volume, In Million Tons, 2017-2031F
- Figure 95. Netherlands Vegetable Oil Market Share (%), By Nature, 2017-2031F
- Figure 96. Netherlands Vegetable Oil Market Share (%), By Type, 2017-2031F
- Figure 97. Netherlands Vegetable Oil Market Share (%), By Sales Channel, 2017-2031F
- Figure 98. Netherlands Vegetable Oil Market Share (%), By Extraction Method, 2017-2031F
- Figure 99. Netherlands Vegetable Oil Market Share (%), By Packaging Type, 2017-2031F
- Figure 100. Netherlands Vegetable Oil Market Share (%), By End-use, 2017-2031F
- Figure 101. Spain Vegetable Oil Market, By Value, In USD Billion, 2017-2031F
- Figure 102. Spain Vegetable Oil Market, By Volume, In Million Tons, 2017-2031F
- Figure 103. Spain Vegetable Oil Market Share (%), By Nature, 2017-2031F
- Figure 104. Spain Vegetable Oil Market Share (%), By Type, 2017-2031F
- Figure 105. Spain Vegetable Oil Market Share (%), By Sales Channel, 2017-2031F
- Figure 106. Spain Vegetable Oil Market Share (%), By Extraction Method, 2017-2031F
- Figure 107. Spain Vegetable Oil Market Share (%), By Packaging Type, 2017-2031F
- Figure 108. Spain Vegetable Oil Market Share (%), By End-use, 2017-2031F
- Figure 109. Turkey Vegetable Oil Market, By Value, In USD Billion, 2017-2031F
- Figure 110. Turkey Vegetable Oil Market, By Volume, In Million Tons, 2017-2031F
- Figure 111. Turkey Vegetable Oil Market Share (%), By Nature, 2017-2031F
- Figure 112. Turkey Vegetable Oil Market Share (%), By Type, 2017-2031F
- Figure 113. Turkey Vegetable Oil Market Share (%), By Sales Channel, 2017-2031F
- Figure 114. Turkey Vegetable Oil Market Share (%), By Extraction Method, 2017-2031F
- Figure 115. Turkey Vegetable Oil Market Share (%), By Packaging Type, 2017-2031F
- Figure 116. Turkey Vegetable Oil Market Share (%), By End-use, 2017-2031F
- Figure 117. Poland Vegetable Oil Market, By Value, In USD Billion, 2017-2031F
- Figure 118. Poland Vegetable Oil Market, By Volume, In Million Tons, 2017-2031F
- Figure 119. Poland Vegetable Oil Market Share (%), By Nature, 2017-2031F
- Figure 120. Poland Vegetable Oil Market Share (%), By Type, 2017-2031F
- Figure 121. Poland Vegetable Oil Market Share (%), By Sales Channel, 2017-2031F
- Figure 122. Poland Vegetable Oil Market Share (%), By Extraction Method, 2017-2031F
- Figure 123. Poland Vegetable Oil Market Share (%), By Packaging Type, 2017-2031F
- Figure 124. Poland Vegetable Oil Market Share (%), By End-use, 2017-2031F
- Figure 125. South America Vegetable Oil Market, By Value, In USD Billion, 2017-2031F
- Figure 126. South America Vegetable Oil Market, By Volume, In Million Tons, 2017-2031F
- Figure 127. South America Vegetable Oil Market Share (%), By Nature, 2017-2031F
- Figure 128. South America Vegetable Oil Market Share (%), By Type, 2017-2031F
- Figure 129. South America Vegetable Oil Market Share (%), By Sales Channel, 2017-2031F
- Figure 130. South America Vegetable Oil Market Share (%), By Extraction Method, 2017-2031F
- Figure 131. South America Vegetable Oil Market Share (%), By Packaging Type, 2017-2031F
- Figure 132. South America Vegetable Oil Market Share (%), By End-use, 2017-2031F
- Figure 133. South America Vegetable Oil Market Share (%), By Country, 2017-2031F
- Figure 134. Brazil Vegetable Oil Market, By Value, In USD Billion, 2017-2031F
- Figure 135. Brazil Vegetable Oil Market, By Volume, In Million Tons, 2017-2031F
- Figure 136. Brazil Vegetable Oil Market Share (%), By Nature, 2017-2031F
- Figure 137. Brazil Vegetable Oil Market Share (%), By Type, 2017-2031F
- Figure 138. Brazil Vegetable Oil Market Share (%), By Sales Channel, 2017-2031F
- Figure 139. Brazil Vegetable Oil Market Share (%), By Extraction Method, 2017-2031F
- Figure 140. Brazil Vegetable Oil Market Share (%), By Packaging Type, 2017-2031F
- Figure 141. Brazil Vegetable Oil Market Share (%), By End-use, 2017-2031F
- Figure 142. Argentina Vegetable Oil Market, By Value, In USD Billion, 2017-2031F
- Figure 143. Argentina Vegetable Oil Market, By Volume, In Million Tons, 2017-2031F
- Figure 144. Argentina Vegetable Oil Market Share (%), By Nature, 2017-2031F
- Figure 145. Argentina Vegetable Oil Market Share (%), By Type, 2017-2031F
- Figure 146. Argentina Vegetable Oil Market Share (%), By Sales Channel, 2017-2031F
- Figure 147. Argentina Vegetable Oil Market Share (%), By Extraction Method, 2017-2031F
- Figure 148. Argentina Vegetable Oil Market Share (%), By Packaging Type, 2017-2031F
- Figure 149. Argentina Vegetable Oil Market Share (%), By End-use, 2017-2031F
- Figure 150. Asia-Pacific Vegetable Oil Market, By Value, In USD Billion, 2017-2031F
- Figure 151. Asia-Pacific Vegetable Oil Market, By Volume, In Million Tons, 2017-2031F
- Figure 152. Asia-Pacific Vegetable Oil Market Share (%), By Nature, 2017-2031F
- Figure 153. Asia-Pacific Vegetable Oil Market Share (%), By Type, 2017-2031F
- Figure 154. Asia-Pacific Vegetable Oil Market Share (%), By Sales Channel, 2017-2031F
- Figure 155. Asia-Pacific Vegetable Oil Market Share (%), By Extraction Method, 2017-2031F
- Figure 156. Asia-Pacific Vegetable Oil Market Share (%), By Packaging Type, 2017-2031F
- Figure 157. Asia-Pacific Vegetable Oil Market Share (%), By End-use, 2017-2031F
- Figure 158. Asia-Pacific Vegetable Oil Market Share (%), By Country, 2017-2031F
- Figure 159. India Vegetable Oil Market, By Value, In USD Billion, 2017-2031F
- Figure 160. India Vegetable Oil Market, By Volume, In Million Tons, 2017-2031F
- Figure 161. India Vegetable Oil Market Share (%), By Nature, 2017-2031F
- Figure 162. India Vegetable Oil Market Share (%), By Type, 2017-2031F
- Figure 163. India Vegetable Oil Market Share (%), By Sales Channel, 2017-2031F
- Figure 164. India Vegetable Oil Market Share (%), By Extraction Method, 2017-2031F
- Figure 165. India Vegetable Oil Market Share (%), By Packaging Type, 2017-2031F
- Figure 166. India Vegetable Oil Market Share (%), By End-use, 2017-2031F
- Figure 167. China Vegetable Oil Market, By Value, In USD Billion, 2017-2031F
- Figure 168. China Vegetable Oil Market, By Volume, In Million Tons, 2017-2031F
- Figure 169. China Vegetable Oil Market Share (%), By Nature, 2017-2031F
- Figure 170. China Vegetable Oil Market Share (%), By Type, 2017-2031F
- Figure 171. China Vegetable Oil Market Share (%), By Sales Channel, 2017-2031F
- Figure 172. China Vegetable Oil Market Share (%), By Extraction Method, 2017-2031F
- Figure 173. China Vegetable Oil Market Share (%), By Packaging Type, 2017-2031F
- Figure 174. China Vegetable Oil Market Share (%), By End-use, 2017-2031F
- Figure 175. Japan Vegetable Oil Market, By Value, In USD Billion, 2017-2031F
- Figure 176. Japan Vegetable Oil Market, By Volume, In Million Tons, 2017-2031F
- Figure 177. Japan Vegetable Oil Market Share (%), By Nature, 2017-2031F
- Figure 178. Japan Vegetable Oil Market Share (%), By Type, 2017-2031F
- Figure 179. Japan Vegetable Oil Market Share (%), By Sales Channel, 2017-2031F
- Figure 180. Japan Vegetable Oil Market Share (%), By Extraction Method, 2017-2031F
- Figure 181. Japan Vegetable Oil Market Share (%), By Packaging Type, 2017-2031F
- Figure 182. Japan Vegetable Oil Market Share (%), By End-use, 2017-2031F
- Figure 183. Australia Vegetable Oil Market, By Value, In USD Billion, 2017-2031F
- Figure 184. Australia Vegetable Oil Market, By Volume, In Million Tons, 2017-2031F
- Figure 185. Australia Vegetable Oil Market Share (%), By Nature, 2017-2031F
- Figure 186. Australia Vegetable Oil Market Share (%), By Type, 2017-2031F
- Figure 187. Australia Vegetable Oil Market Share (%), By Sales Channel, 2017-2031F
- Figure 188. Australia Vegetable Oil Market Share (%), By Extraction Method, 2017-2031F
- Figure 189. Australia Vegetable Oil Market Share (%), By Packaging Type, 2017-2031F
- Figure 190. Australia Vegetable Oil Market Share (%), By End-use, 2017-2031F
- Figure 191. Vietnam Vegetable Oil Market, By Value, In USD Billion, 2017-2031F
- Figure 192. Vietnam Vegetable Oil Market, By Volume, In Million Tons, 2017-2031F
- Figure 193. Vietnam Vegetable Oil Market Share (%), By Nature, 2017-2031F
- Figure 194. Vietnam Vegetable Oil Market Share (%), By Type, 2017-2031F
- Figure 195. Vietnam Vegetable Oil Market Share (%), By Sales Channel, 2017-2031F
- Figure 196. Vietnam Vegetable Oil Market Share (%), By Extraction Method, 2017-2031F
- Figure 197. Vietnam Vegetable Oil Market Share (%), By Packaging Type, 2017-2031F
- Figure 198. Vietnam Vegetable Oil Market Share (%), By End-use, 2017-2031F
- Figure 199. South Korea Vegetable Oil Market, By Value, In USD Billion, 2017-2031F
- Figure 200. South Korea Vegetable Oil Market, By Volume, In Million Tons, 2017-2031F
- Figure 201. South Korea Vegetable Oil Market Share (%), By Nature, 2017-2031F
- Figure 202. South Korea Vegetable Oil Market Share (%), By Type, 2017-2031F
- Figure 203. South Korea Vegetable Oil Market Share (%), By Sales Channel, 2017-2031F
- Figure 204. South Korea Vegetable Oil Market Share (%), By Extraction Method, 2017-2031F
- Figure 205. South Korea Vegetable Oil Market Share (%), By Packaging Type, 2017-2031F
- Figure 206. South Korea Vegetable Oil Market Share (%), By End-use, 2017-2031F
- Figure 207. Indonesia Vegetable Oil Market, By Value, In USD Billion, 2017-2031F
- Figure 208. Indonesia Vegetable Oil Market, By Volume, In Million Tons, 2017-2031F
- Figure 209. Indonesia Vegetable Oil Market Share (%), By Nature, 2017-2031F
- Figure 210. Indonesia Vegetable Oil Market Share (%), By Type, 2017-2031F
- Figure 211. Indonesia Vegetable Oil Market Share (%), By Sales Channel, 2017-2031F
- Figure 212. Indonesia Vegetable Oil Market Share (%), By Extraction Method, 2017-2031F
- Figure 213. Indonesia Vegetable Oil Market Share (%), By Packaging Type, 2017-2031F
- Figure 214. Indonesia Vegetable Oil Market Share (%), By End-use, 2017-2031F
- Figure 215. Philippines Vegetable Oil Market, By Value, In USD Billion, 2017-2031F
- Figure 216. Philippines Vegetable Oil Market, By Volume, In Million Tons, 2017-2031F
- Figure 217. Philippines Vegetable Oil Market Share (%), By Nature, 2017-2031F
- Figure 218. Philippines Vegetable Oil Market Share (%), By Type, 2017-2031F
- Figure 219. Philippines Vegetable Oil Market Share (%), By Sales Channel, 2017-2031F
- Figure 220. Philippines Vegetable Oil Market Share (%), By Extraction Method, 2017-2031F
- Figure 221. Philippines Vegetable Oil Market Share (%), By Packaging Type, 2017-2031F
- Figure 222. Philippines Vegetable Oil Market Share (%), By End-use, 2017-2031F
- Figure 223. Middle East & Africa Vegetable Oil Market, By Value, In USD Billion, 2017-2031F
- Figure 224. Middle East & Africa Vegetable Oil Market, By Volume, In Million Tons, 2017-2031F
- Figure 225. Middle East & Africa Vegetable Oil Market Share (%), By Nature, 2017-2031F
- Figure 226. Middle East & Africa Vegetable Oil Market Share (%), By Type, 2017-2031F
- Figure 227. Middle East & Africa Vegetable Oil Market Share (%), By Sales Channel, 2017-2031F
- Figure 228. Middle East & Africa Vegetable Oil Market Share (%), By Extraction Method, 2017-2031F
- Figure 229. Middle East & Africa Vegetable Oil Market Share (%), By Packaging Type, 2017-2031F
- Figure 230. Middle East & Africa Vegetable Oil Market Share (%), By End-use, 2017-2031F
- Figure 231. Middle East & Africa Vegetable Oil Market Share (%), By Country, 2017-2031F
- Figure 232. Saudi Arabia Vegetable Oil Market, By Value, In USD Billion, 2017-2031F
- Figure 233. Saudi Arabia Vegetable Oil Market, By Volume, In Million Tons, 2017-2031F
- Figure 234. Saudi Arabia Vegetable Oil Market Share (%), By Nature, 2017-2031F
- Figure 235. Saudi Arabia Vegetable Oil Market Share (%), By Type, 2017-2031F
- Figure 236. Saudi Arabia Vegetable Oil Market Share (%), By Sales Channel, 2017-2031F
- Figure 237. Saudi Arabia Vegetable Oil Market Share (%), By Extraction Method, 2017-2031F
- Figure 238. Saudi Arabia Vegetable Oil Market Share (%), By Packaging Type, 2017-2031F
- Figure 239. Saudi Arabia Vegetable Oil Market Share (%), By End-use, 2017-2031F
- Figure 240. UAE Vegetable Oil Market, By Value, In USD Billion, 2017-2031F
- Figure 241. UAE Vegetable Oil Market, By Volume, In Million Tons, 2017-2031F
- Figure 242. UAE Vegetable Oil Market Share (%), By Nature, 2017-2031F
- Figure 243. UAE Vegetable Oil Market Share (%), By Type, 2017-2031F
- Figure 244. UAE Vegetable Oil Market Share (%), By Sales Channel, 2017-2031F
- Figure 245. UAE Vegetable Oil Market Share (%), By Extraction Method, 2017-2031F
- Figure 246. UAE Vegetable Oil Market Share (%), By Packaging Type, 2017-2031F
- Figure 247. UAE Vegetable Oil Market Share (%), By End-use, 2017-2031F
- Figure 248. South Africa Vegetable Oil Market, By Value, In USD Billion, 2017-2031F
- Figure 249. South Africa Vegetable Oil Market, By Volume, In Million Tons, 2017-2031F
- Figure 250. South Africa Vegetable Oil Market Share (%), By Nature, 2017-2031F
- Figure 251. South Africa Vegetable Oil Market Share (%), By Type, 2017-2031F
- Figure 252. South Africa Vegetable Oil Market Share (%), By Sales Channel, 2017-2031F
- Figure 253. South Africa Vegetable Oil Market Share (%), By Extraction Method, 2017-2031F
- Figure 254. South Africa Vegetable Oil Market Share (%), By Packaging Type, 2017-2031F
- Figure 255. South Africa Vegetable Oil Market Share (%), By End-use, 2017-2031F
- Figure 256. By Nature Map-Market Size (USD Billion) & Growth Rate (%), 2023
- Figure 257. By Type Map-Market Size (USD Billion) & Growth Rate (%), 2023
- Figure 258. By Sales Channel Map-Market Size (USD Billion) & Growth Rate (%), 2023
- Figure 259. By Extraction Method Map-Market Size (USD Billion) & Growth Rate (%), 2023
- Figure 260. By Packaging Type Map-Market Size (USD Billion) & Growth Rate (%), 2023
- Figure 261. By End-use Map-Market Size (USD Billion) & Growth Rate (%), 2023
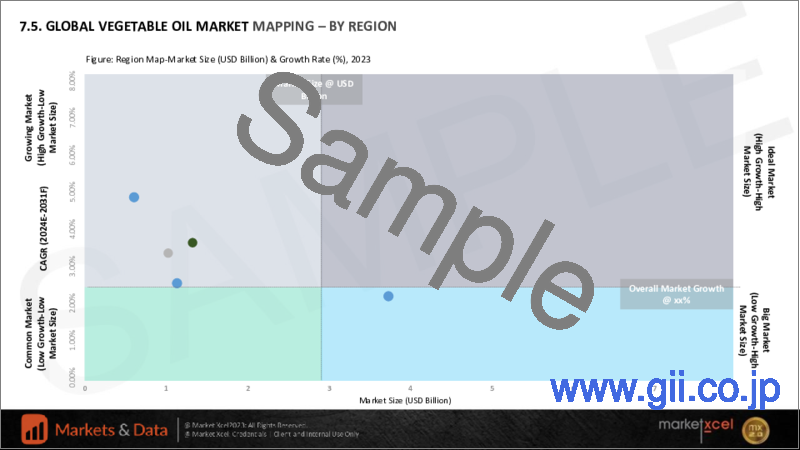
- Figure 262. By Region Map-Market Size (USD Billion) & Growth Rate (%), 2023
Global vegetable oil market size was estimated to be 251.2 million tonnes, which is expected to reach USD 323.3 million tonnes in 2031, with a CAGR of 3.2% for the forecast period between 2024 and 2031. Vegetable oil refers to a plant derived lipid extracted from various seeds, fruits or nuts, serving into a culinary and industrial segment. Vegetable oil is commonly used oil including soybean, canola, olive and sunflower oil. In the culinary segment, vegetable oil serves as a cooking medium, adding flavor and texture to a wide array of dishes. Additionally, it also prevents in salad dressing and marinades.
Beyond the kitchen, vegetable oil has its application in industrial segment owing to biodiesel production, lubrication, and also as a component in cosmetic and pharmaceutical industry. The versatility of vegetable oil extends its nutritional benefits, containing unsaturated fats that also contribute to heart health. Furthermore, it has been demonstrated that eating foods high in monounsaturated fats, such as almond oil, canola oil, sunflower oil, hazelnut oil, and olive oil, raises good cholesterol levels and lowers the risk of heart and cardiovascular diseases. Additionally, it also contains vitamin E which acts as an antioxidant.
In 2022, Foreign Agriculture Service of USDA stated that Canada has emerged as a prominent import market for vegetable oils (excluding soybean), with a substantial export value of USD 373.73 million. This highlights the nation's significant demand for vegetable oil, showcasing their integral role in both culinary and industrial applications. The diverse uses of vegetable oils, from cooking to various industrial processes, contribute to their growing market presence in Canada, reflecting a combination of economic, dietary, and industrial factors driving the consumption of vegetable oil.
Expansion of Food Sector and Constant Product Innovations Fuelling the Market
Global vegetable oil market is witnessing significant growth, primarily driven by the expanding foodservice industry worldwide and the increasing utilization of vegetable oils in biofuel production. This growth is forecasted to continue due to the determined efforts of global market participants to introduce innovative products. While food applications constitute a substantial portion of the vegetable oil market, the non-food, industrial segment is anticipated to experience a faster growth. This acceleration is attributed to the biodiesel industry, emphasizing the versatile applications of vegetable oils beyond culinary uses. As the market evolves, the interplay of factors such as changing consumer preferences, technological advancements, and sustainability initiatives will further shape the trajectory of the vegetable oil industry during the forecast period.
For instance, in July 2022, Eni has launched the world's first integrated project for vegetable oil production in Kenya, marking a significant step in Africa's inclusion in the vertical bio-refinery supply chain. With an initial capacity of 15,000 tons, the oilseed collection and pressing plant (agri-hub) in Makueni started production with the goal of producing 2,500 tons by 2022. The project aligns with Eni's sustainability goals, contributing to carbon neutrality by 2050. Notably, the initiative engages 25,000 local farmers, providing income opportunities and prioritizing social development owing to 200 people per day at the construction centre.
Asia-Pacific Holds the Largest Market Share
In Asia-Pacific, China holds the largest share of vegetable oil consumption, as well as production. Despite the high production volume, consumption exceeds the production volume, leading to higher import volumes relative to export volumes. Furthermore, China imports extra oil to meet domestic demand, making up over half of Asia's total production. Furthermore, Malaysia and Thailand are also among the largest oil producers in Asia and India is the third-largest oil-consuming country in the world, after the United States and China. Asia-Pacific dominates the production share in the vegetable industry. Palm oil is the most produced oil, and it is mostly produced in Malaysia and Indonesia. Additionally, because Indonesia continues to use more palm oil domestically, particularly for biofuels, palm oil has put higher pressure on the price of vegetable oil globally. In addition to this, in November 2023, high imports of palm oil increased Indian imports for palm oil by 22% in November and 13% in December.
Increasing Demand for Fortified Vegetable Oils
The heightened demand for stimulated vegetable oil is primarily attributed to the increasing number of health-conscious consumers seeking enhanced nutritional benefits. The trend aligns with dietary guidelines and public health campaigns advocating a proactive approach to address nutritional deficiencies. In response to the growing demand, the industry has strategically emphasized innovation. Companies are actively developing and promoting fortified vegetable oils to cater to a market that is becoming increasingly health conscious. The shift reflects consumer preferences and highlights the industry's commitment to align with evolving health and wellness trends, thereby contributing to the population's overall well-being.
For instance, USAID Advancing Food Fortification Opportunities to Reinforce Diets (AFFORD) project was started in 2022 in the view of economically and nutritionally vulnerable population groups, especially women and children who lack essential nutrients, like vitamin A, iron, folic acid, zinc, and iodine, in their diets poses a significant global health risk. The fortification of vitamins and minerals into vegetable oils is expected to grow the market globally.
Impact of COVID-19
The vegetable oil industry confronted substantial challenges amid the COVID-19 pandemic, marked by a surge in demand, as more people were cooking at home during lockdowns. Also, the sector struggled with labour shortages, transportation disruptions, and global supply chain issues, impacting production and distribution. These challenges resulted in price fluctuations, introducing uncertainties in the market. Simultaneously, the pandemic catalyzed a shift in consumer preferences towards healthier oils, driven by heightened health concerns. The change influenced market dynamics, causing price fluctuations for these health-conscious options. The crisis underscored the industry's struggle to adapt to evolving consumer behaviour amid logistical hurdles.
Key Players Landscape and Outlook
Vegetable oil market is anticipated to grow due to its rich content of essential vitamins. The positive outlook stems from the widespread uses of vegetable oil in both the food and non-food industries. Supportive government policies and initiatives, and manufacturers adopting sustainable business practices, are expected to shape the market's growth trajectory. Additionally, increasing vegetable oil applications across diverse industries further contribute to the optimistic outlook. As a versatile product with essential nutrients, vegetable oil is positioned to meet the demands of a growing market, making it a key player in the evolving global economic landscape.
For instance, in November 2021, Cargill Incorporated made a strategic move by investing USD 35 million to upgrade and acquire an edible oil refinery in Nellore, India. This significant investment allowed Cargill to enhance its existing supply chain, effectively meeting the growing demands of its customers. The upgrade aimed at increasing the facility's production capacity, positioning Cargill to capitalize on the expanding market for edible oils. By strengthening its operations in Nellore, Cargill tried to solidify its position as a key player in the global agribusiness landscape.
Table of Contents
1. Research Methodology
2. Project Scope & Definitions
3. Impact of COVID-19 on Global Vegetable Oil Market
4. Executive Summary
5. Voice of Customer
- 5.1. Demographics (Age/Cohort Analysis - Baby Boomers and Gen X, Millennials, Gen Z; Gender; Income - Low, Mid and High; Geography; Nationality; etc.)
- 5.2. Brand and Product Awareness
- 5.3. Factors Considered in Purchase Decision
- 5.3.1. Product Preferences
- 5.3.2. Usage Patterns
- 5.3.3. Brand Perception
- 5.3.4. Packaging and Presentation
- 5.3.5. Quality and Health Considerations
- 5.3.6. Price Sensitivity
- 5.3.7. Availability and Accessibility
- 5.4. Purchase Channel
- 5.5. Frequency of Purchase
- 5.6. Existing or Intended User
- 5.7. Recommendations from friends, family/online reviews
- 5.8. Role of Brand Ambassador or Influencer Marketing on Product/Brand Absorption
6. Vegetable Oil Market Outlook, 2017-2031F
- 6.1. Market Size & Forecast
- 6.1.1. By Value
- 6.1.2. By Volume
- 6.2. By Nature
- 6.2.1. Organic
- 6.2.2. Conventional
- 6.3. By Type
- 6.3.1. Palm Oil
- 6.3.2. Soybean Oil
- 6.3.3. Coconut Oil
- 6.3.4. Rapeseed Oil
- 6.3.5. Canola Oil
- 6.3.6. Sunflower Oil
- 6.3.7. Others
- 6.4. By Sales Channel
- 6.4.1. Direct Sales
- 6.4.2. Supermarket/Hypermarket
- 6.4.3. Convenience Stores
- 6.4.4. Specialty Stores
- 6.4.5. E-Commerce
- 6.4.6. Others
- 6.5. By Extraction Method
- 6.5.1. Mechanical Extraction
- 6.5.2. Solvent Extraction
- 6.5.3. Hydrogenation
- 6.5.4. Sparging
- 6.6. By Packaging Type
- 6.6.1. Cans
- 6.6.2. Bottles
- 6.6.3. Pouches
- 6.6.4. Others
- 6.7. By End-use
- 6.7.1. Food
- 6.7.2. Pharmaceutical Products
- 6.7.3. Personal Care Products
- 6.7.3.1. Soaps
- 6.7.3.2. Perfumes
- 6.7.3.3. Others
- 6.7.4. Industrial
- 6.7.4.1. Paints
- 6.7.4.2. Lubricants
- 6.7.4.3. Biofuels
- 6.7.4.4. Others
- 6.7.5. Others
- 6.8. By Region
- 6.8.1. North America
- 6.8.2. Europe
- 6.8.3. South America
- 6.8.4. Asia-Pacific
- 6.8.5. Middle East and Africa
- 6.9. By Company Market Share (%), 2023
7. Vegetable oil Market Outlook, By Region, 2017-2031F
- 7.1. North America*
- 7.1.1. Market Size & Forecast
- 7.1.1.1. By Value
- 7.1.1.2. By Volume
- 7.1.2. By Nature
- 7.1.2.1. Organic
- 7.1.2.2. Conventional
- 7.1.3. By Type
- 7.1.3.1. Palm Oil
- 7.1.3.2. Soybean Oil
- 7.1.3.3. Coconut Oil
- 7.1.3.4. Rapeseed Oil
- 7.1.3.5. Canola Oil
- 7.1.3.6. Sunflower Oil
- 7.1.3.7. Other
- 7.1.4. By Sales Channel
- 7.1.4.1. Direct Sales
- 7.1.4.2. Supermarket/Hypermarket
- 7.1.4.3. Convenience Stores
- 7.1.4.4. Specialty Stores
- 7.1.4.5. E-Commerce
- 7.1.4.6. Others
- 7.1.5. By Extraction Method
- 7.1.5.1. Mechanical Extraction
- 7.1.5.2. Solvent Extraction
- 7.1.5.3. Hydrogenation
- 7.1.5.4. Sparging
- 7.1.6. By Packaging Type
- 7.1.6.1. Cans
- 7.1.6.2. Bottles
- 7.1.6.3. Pouches
- 7.1.6.4. Others
- 7.1.7. By End-use
- 7.1.7.1. Food
- 7.1.7.2. Pharmaceutical Products
- 7.1.7.3. Personal Care Products
- 7.1.7.3.1. Soaps
- 7.1.7.3.2. Perfumes
- 7.1.7.3.3. Others
- 7.1.7.4. Industrial
- 7.1.7.4.1. Paints
- 7.1.7.4.2. Lubricants
- 7.1.7.4.3. Biofuels
- 7.1.7.4.4. Others
- 7.1.7.5. Others
- 7.1.8. United States*
- 7.1.8.1. Market Size & Forecast
- 7.1.8.1.1. By Value
- 7.1.8.1.2. By Volume
- 7.1.8.2. By Nature
- 7.1.8.2.1. Organic
- 7.1.8.2.2. Conventional
- 7.1.8.3. By Type
- 7.1.8.3.1. Palm Oil
- 7.1.8.3.2. Soybean Oil
- 7.1.8.3.3. Coconut Oil
- 7.1.8.3.4. Rapeseed Oil
- 7.1.8.3.5. Canola Oil
- 7.1.8.3.6. Sunflower Oil
- 7.1.8.3.7. Others
- 7.1.8.4. By Sales Channel
- 7.1.8.4.1. Direct Sales
- 7.1.8.4.2. Supermarket/Hypermarket
- 7.1.8.4.3. Convenience Stores
- 7.1.8.4.4. Specialty Stores
- 7.1.8.4.5. E-Commerce
- 7.1.8.4.6. Others
- 7.1.8.5. By Extraction Method
- 7.1.8.5.1. Mechanical Extraction
- 7.1.8.5.2. Solvent Extraction
- 7.1.8.5.3. Hydrogenation
- 7.1.8.5.4. Sparging
- 7.1.8.6. By Packaging Type
- 7.1.8.6.1. Cans
- 7.1.8.6.2. Bottles
- 7.1.8.6.3. Pouches
- 7.1.8.6.4. Others
- 7.1.8.7. By End-use
- 7.1.8.7.1. Food
- 7.1.8.7.2. Pharmaceutical Products
- 7.1.8.7.3. Personal Care Products
- 7.1.8.7.3.1. Soaps
- 7.1.8.7.3.2. Perfumes
- 7.1.8.7.3.3. Others
- 7.1.8.7.4. Industrial
- 7.1.8.7.4.1. Paints
- 7.1.8.7.4.2. Lubricants
- 7.1.8.7.4.3. Biofuels
- 7.1.8.7.4.4. Others
- 7.1.8.7.5. Others
- 7.1.9. Canada
- 7.1.10. Mexico
- 7.1.1. Market Size & Forecast
All segments will be provided for all regions and countries covered:
- 7.2. Europe
- 7.2.1. Germany
- 7.2.2. France
- 7.2.3. Italy
- 7.2.4. United Kingdom
- 7.2.5. Russia
- 7.2.6. Netherlands
- 7.2.7. Spain
- 7.2.8. Turkey
- 7.2.9. Poland
- 7.3. South America
- 7.3.1. Brazil
- 7.3.2. Argentina
- 7.4. Asia-Pacific
- 7.4.1. India
- 7.4.2. China
- 7.4.3. Japan
- 7.4.4. Australia
- 7.4.5. Vietnam
- 7.4.6. South Korea
- 7.4.7. Indonesia
- 7.4.8. Philippines
- 7.5. Middle East and Africa
- 7.5.1. UAE
- 7.5.2. Saudi Arabia
- 7.5.3. South Africa
8. Market Mapping, 2023
- 8.1. By Nature
- 8.2. By Type
- 8.3. By Sales Channel
- 8.4. By Extraction Method
- 8.5. By Packaging Type
- 8.6. By End-use
- 8.7. By Region
9. Macro Environment and Industry Structure
- 9.1. Supply Demand Analysis
- 9.2. Import Export Analysis
- 9.3. Value Chain Analysis
- 9.4. PESTEL Analysis
- 9.4.1. Political Factors
- 9.4.2. Economic System
- 9.4.3. Social Implications
- 9.4.4. Technological Advancements
- 9.4.5. Environmental Impacts
- 9.4.6. Legal Compliances and Regulatory Policies (Statutory Bodies Included)
- 9.5. Porter's Five Forces Analysis
- 9.5.1. Supplier Power
- 9.5.2. Buyer Power
- 9.5.3. Substitution Threat
- 9.5.4. Threat from New Entrant
- 9.5.5. Competitive Rivalry
10. Market Dynamics
- 10.1. Growth Drivers
- 10.2. Growth Inhibitors (Challenges and Restraints)
11. Key Players Landscape
- 11.1. Competition Matrix of Top Five Market Leaders
- 11.2. Market Revenue Analysis of Top Five Market Leaders (in %, 2023)
- 11.3. Mergers and Acquisitions/Joint Ventures (If Applicable)
- 11.4. SWOT Analysis (For Five Market Players)
- 11.5. Patent Analysis (If Applicable)
12. Pricing Analysis
13. Case Studies
14. Key Players Outlook
- 14.1. Cargill, Incorporated
- 14.1.1. Company Details
- 14.1.2. Key Management Personnel
- 14.1.3. Products & Services
- 14.1.4. Financials (As reported)
- 14.1.5. Key Market Focus & Geographical Presence
- 14.1.6. Recent Developments
- 14.2. ADANI GROUP (Adani Wilmar)
- 14.3. CONAGRA BRANDS, Inc.
- 14.4. Bunge Global SA
- 14.5. Emami Agrotech Ltd.
- 14.6. Wilmar International Ltd
- 14.7. Sime Darby Plantation
- 14.8. IOI Corporation
- 14.9. Louis Dreyfus Company B.V.
- 14.10. Flambo International Limited (Golden Agri-Resources)
Companies mentioned above DO NOT hold any order as per market share and can be changed as per information available during research work.
