|
|
市場調査レポート
商品コード
1388954
がん治療薬の世界市場:用途別・治療法別・売上高上位の医薬品別・エンドユーザー別・地域別の評価、機会と予測 (2016年~2030年)Cancer Therapeutics Market Assessment, By Applications, By Therapeutics, By Top Selling Drugs, By End User, By Region, Opportunities and Forecast, 2016-2030F |
||||||
|
|
|||||||
カスタマイズ可能
|
|||||||


| がん治療薬の世界市場:用途別・治療法別・売上高上位の医薬品別・エンドユーザー別・地域別の評価、機会と予測 (2016年~2030年) |
|
出版日: 2023年12月01日
発行: Markets & Data
ページ情報: 英文 205 Pages
納期: 3~5営業日
|

- 全表示
- 概要
- 図表
- 目次
世界のがん治療薬の市場規模は、2022年に1,515億米ドルと評価され、2030年には3,368億米ドルに達すると予測され、2023年から2030Fまでの予測期間のCAGRは10.5%です。世界のがん治療薬市場は大幅に成長・変化しています。早期診断・治療に対する意識の高まり、がん罹患率の上昇、医療技術の向上、病気にかかりやすい高齢化人口の増加などが市場拡大に寄与しています。
免疫療法、標的治療薬、個別化医療など、新規のがん治療法の開発が進んでいることも、主要な促進要因のひとつです。これらの治療法は、患者の転帰と生存率を劇的に改善するとともに、さまざまながん種の治療において有望な結果を示しています。多くの新薬が承認されたのは、製薬業界における腫瘍学の研究開発活動が活発に行われ、治療環境全体が改善されたためです。さらに、世界中の政府や医療機関が、経済的で効率的ながん治療へのアクセスやがん研究への資金提供を積極的に奨励しています。診療報酬の改善や医療インフラの拡充により、現在ではより多くの人々ががん治療へのアクセスを容易にしています。
当レポートでは、世界のがん治療薬の市場について分析し、製品の概略や市場の基本構造、全体的な市場規模の動向見通し、セグメント別・地域別の詳細動向、市場の背景事情や主な影響要因、主要企業のプロファイル・市場シェアなどを調査しております。
目次
第1章 調査手法
第2章 プロジェクトの範囲と定義
第3章 新型コロナウイルス感染症 (COVID-19) が世界のがん治療薬市場に与える影響
第4章 エグゼクティブサマリー
第5章 世界のがん治療薬市場の将来展望 (2016年~2030年)
- 市場規模と予測
- 金額ベース
- 数量ベース
- 用途別
- 肺がん
- 血液がん
- 結腸直腸がん
- 前立腺がん
- 乳がん
- 子宮頸がん
- 膠芽腫
- 頭頸部がん
- 悪性髄膜腫
- 中皮腫
- 黒色腫
- その他
- 治療法別
- 化学療法
- 標的療法
- 免疫療法
- ホルモン療法
- その他
- 売上高上位の医薬品別
- レブラミド
- アバスチン
- ハーセプチン
- リツキサン
- オプジーボ
- グリベック
- ベルケイド
- インブルヴィカ
- イブランス
- ザイティガ
- アリムタ
- シュタンディ
- タルセバ
- パージェタ
- テモダル
- その他
- エンドユーザー別
- 病院
- 専門クリニック
- がん・放射線治療センター
- 地域別
- 北米
- 欧州
- アジア太平洋
- 南米
- 中東・アフリカ
- 企業別市場シェア (%、2022年)
第6章 世界のがん治療薬市場の将来展望:地域別 (2016年~2030年)
- 北米*
- 市場規模と予測
- 金額ベース
- 数量ベース
- 用途別
- 治療法別
- 売上高上位の医薬品別
- エンドユーザー別
- 米国*
- カナダ
- メキシコ
- 市場規模と予測
各セグメントの情報は、対象となる全ての地域・国について提供されます。
- 欧州
- ドイツ
- フランス
- イタリア
- 英国
- ロシア
- オランダ
- スペイン
- トルコ
- ポーランド
- 南米
- ブラジル
- アルゼンチン
- アジア太平洋
- インド
- 中国
- 日本
- オーストラリア
- ベトナム
- 韓国
- インドネシア
- フィリピン
- 中東・アフリカ
- サウジアラビア
- アラブ首長国連邦
- 南アフリカ
第7章 市場マッピング (2022年)
- 用途別
- 治療法別
- 売上高上位の医薬品別
- エンドユーザー別
- 地域別
第8章 マクロ環境と産業構造
- 需給分析
- 輸出入分析 (数量・金額ベース)
- サプライ/バリューチェーン分析
- PESTEL分析
- ポーターのファイブフォース分析
第9章 市場力学
- 成長促進要因
- 成長抑制要因 (課題、制約)
第10章 規制の枠組みとイノベーション
- 臨床試験
- 特許の情勢
- 規制当局の承認
- イノベーション/新興技術
第11章 主要企業の情勢
- 市場リーダー上位5社:競合マトリックス
- 市場リーダー上位5社:市場収益分析 (%、2022年)
- 企業合併・買収 (M&A)/合弁事業 (該当する場合)
- SWOT分析 (市場参入企業5社の場合)
- 特許分析 (該当する場合)
第12章 価格分析
第13章 ケーススタディ
第14章 主要企業の見通し
- F. Hoffmann-La Roche AG
- 企業概要
- 経営幹部
- 製品・サービス
- 財務状況 (報告どおり)
- 重点市場と地理的プレゼンス
- 最近の動向
- Bristol-Myers Squibb Company
- AbbVie, Inc.
- Johnson &Johnson
- Celgene Corporation
- Astellas Pharma, Inc.
- Pfizer, Inc.
- Novartis AG
- Merck KGaA
- Eli Lilly and Company
上記企業は市場シェア順ではなく、調査作業中に入手した情報に従って変更される可能性があります。
第15章 戦略提言
第16章 Market Xcelについて、免責事項
List of Tables
- Table 1. Pricing Analysis of Products from Key Players
- Table 2. Competition Matrix of Top 5 Market Leaders
- Table 3. Mergers & Acquisitions/ Joint Ventures (If Applicable)
- Table 4. About Us - Regions and Countries Where We Have Executed Client Projects
List of Figures
- Figure 1. Global Cancer Therapeutics Market, By Value, In USD Billion, 2016-2030F
- Figure 2. Global Cancer Therapeutics Market, By Volume, In Million Units, 2016-2030F
- Figure 3. Global Cancer Therapeutics Market Share, By Applications, In USD Billion, 2016-2030F
- Figure 4. Global Cancer Therapeutics Market Share, By Therapeutics, In USD Billion, 2016-2030F
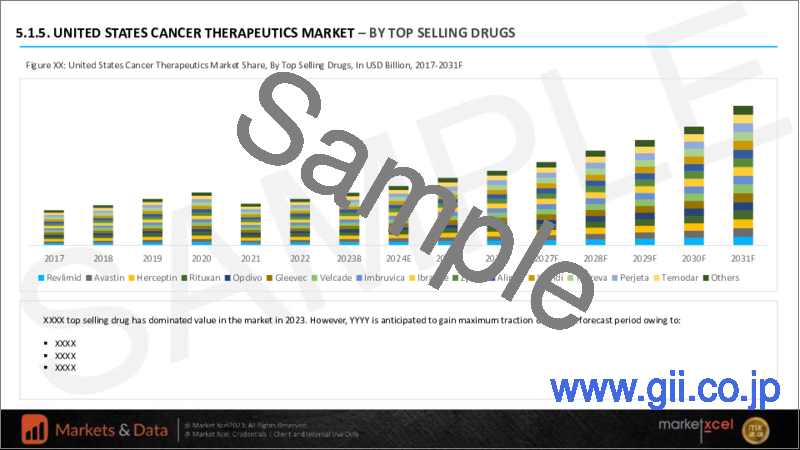
- Figure 5. Global Cancer Therapeutics Market Share, By Top Selling Drugs, In USD Billion, 2016-2030F
- Figure 6. Global Cancer Therapeutics Market Share, By End-user, In USD Billion, 2016-2030F
- Figure 7. Global Cancer Therapeutics Market Share, By Region, In USD Billion, 2016-2030F
- Figure 8. North America Cancer Therapeutics Market, By Value, In USD Billion, 2016-2030F
- Figure 9. North America Cancer Therapeutics Market, By Volume, In Million Units, 2016-2030F
- Figure 10. North America Cancer Therapeutics Market Share, By Applications, In USD Billion, 2016-2030F
- Figure 11. North America Cancer Therapeutics Market Share, By Therapeutics, In USD Billion, 2016-2030F
- Figure 12. North America Cancer Therapeutics Market Share, By Top Selling Drugs, In USD Billion, 2016-2030F
- Figure 13. North America Cancer Therapeutics Market Share, By End-user, In USD Billion, 2016-2030F
- Figure 14. North America Cancer Therapeutics Market Share, By Country, In USD Billion, 2016-2030F
- Figure 15. United States Cancer Therapeutics Market, By Value, In USD Billion, 2016-2030F
- Figure 16. United States Cancer Therapeutics Market, By Volume, In Million Units, 2016-2030F
- Figure 17. United States Cancer Therapeutics Market Share, By Applications, In USD Billion, 2016-2030F
- Figure 18. United States Cancer Therapeutics Market Share, By Therapeutics, In USD Billion, 2016-2030F
- Figure 19. United States Cancer Therapeutics Market Share, By Top Selling Drugs, In USD Billion, 2016-2030F
- Figure 20. United States Cancer Therapeutics Market Share, By End-user, In USD Billion, 2016-2030F
- Figure 21. Canada Cancer Therapeutics Market, By Value, In USD Billion, 2016-2030F
- Figure 22. Canada Cancer Therapeutics Market, By Volume, In Million Units, 2016-2030F
- Figure 23. Canada Cancer Therapeutics Market Share, By Applications, In USD Billion, 2016-2030F
- Figure 24. Canada Cancer Therapeutics Market Share, By Therapeutics, In USD Billion, 2016-2030F
- Figure 25. Canada Cancer Therapeutics Market Share, By Top Selling Drugs, In USD Billion, 2016-2030F
- Figure 26. Canada Cancer Therapeutics Market Share, By End-user, In USD Billion, 2016-2030F
- Figure 27. Mexico Cancer Therapeutics Market, By Value, In USD Billion, 2016-2030F
- Figure 28. Mexico Cancer Therapeutics Market, By Volume, In Million Units, 2016-2030F
- Figure 29. Mexico Cancer Therapeutics Market Share, By Applications, In USD Billion, 2016-2030F
- Figure 30. Mexico Cancer Therapeutics Market Share, By Therapeutics, In USD Billion, 2016-2030F
- Figure 31. Mexico Cancer Therapeutics Market Share, By Top Selling Drugs, In USD Billion, 2016-2030F
- Figure 32. Mexico Cancer Therapeutics Market Share, By End-user, In USD Billion, 2016-2030F
- Figure 33. Europe Cancer Therapeutics Market, By Value, In USD Billion, 2016-2030F
- Figure 34. Europe Cancer Therapeutics Market, By Volume, In Million Units, 2016-2030F
- Figure 35. Europe Cancer Therapeutics Market Share, By Applications, In USD Billion, 2016-2030F
- Figure 36. Europe Cancer Therapeutics Market Share, By Therapeutics, In USD Billion, 2016-2030F
- Figure 37. Europe Cancer Therapeutics Market Share, By Top Selling Drugs, In USD Billion, 2016-2030F
- Figure 38. Europe Cancer Therapeutics Market Share, By End-user, In USD Billion, 2016-2030F
- Figure 39. Europe Cancer Therapeutics Market Share, By Country, In USD Billion, 2016-2030F
- Figure 40. Germany Cancer Therapeutics Market, By Value, In USD Billion, 2016-2030F
- Figure 41. Germany Cancer Therapeutics Market, By Volume, In Million Units, 2016-2030F
- Figure 42. Germany Cancer Therapeutics Market Share, By Applications, In USD Billion, 2016-2030F
- Figure 43. Germany Cancer Therapeutics Market Share, By Therapeutics, In USD Billion, 2016-2030F
- Figure 44. Germany Cancer Therapeutics Market Share, By Top Selling Drugs, In USD Billion, 2016-2030F
- Figure 45. Germany Cancer Therapeutics Market Share, By End-user, In USD Billion, 2016-2030F
- Figure 46. France Cancer Therapeutics Market, By Value, In USD Billion, 2016-2030F
- Figure 47. France Cancer Therapeutics Market, By Volume, In Million Units, 2016-2030F
- Figure 48. France Cancer Therapeutics Market Share, By Applications, In USD Billion, 2016-2030F
- Figure 49. France Cancer Therapeutics Market Share, By Therapeutics, In USD Billion, 2016-2030F
- Figure 50. France Cancer Therapeutics Market Share, By Top Selling Drugs, In USD Billion, 2016-2030F
- Figure 51. France Cancer Therapeutics Market Share, By End-user, In USD Billion, 2016-2030F
- Figure 52. Italy Cancer Therapeutics Market, By Value, In USD Billion, 2016-2030F
- Figure 53. Italy Cancer Therapeutics Market, By Volume, In Million Units, 2016-2030F
- Figure 54. Italy Cancer Therapeutics Market Share, By Applications, In USD Billion, 2016-2030F
- Figure 55. Italy Cancer Therapeutics Market Share, By Therapeutics, In USD Billion, 2016-2030F
- Figure 56. Italy Cancer Therapeutics Market Share, By Top Selling Drugs, In USD Billion, 2016-2030F
- Figure 57. Italy Cancer Therapeutics Market Share, By End-user, In USD Billion, 2016-2030F
- Figure 58. United Kingdom Cancer Therapeutics Market, By Value, In USD Billion, 2016-2030F
- Figure 59. United Kingdom Cancer Therapeutics Market, By Volume, In Million Units, 2016-2030F
- Figure 60. United Kingdom Cancer Therapeutics Market Share, By Applications, In USD Billion, 2016-2030F
- Figure 61. United Kingdom Cancer Therapeutics Market Share, By Therapeutics, In USD Billion, 2016-2030F
- Figure 62. United Kingdom Cancer Therapeutics Market Share, By Top Selling Drugs, In USD Billion, 2016-2030F
- Figure 63. United Kingdom Cancer Therapeutics Market Share, By End-user, In USD Billion, 2016-2030F
- Figure 64. Russia Cancer Therapeutics Market, By Value, In USD Billion, 2016-2030F
- Figure 65. Russia Cancer Therapeutics Market, By Volume, In Million Units, 2016-2030F
- Figure 66. Russia Cancer Therapeutics Market Share, By Applications, In USD Billion, 2016-2030F
- Figure 67. Russia Cancer Therapeutics Market Share, By Therapeutics, In USD Billion, 2016-2030F
- Figure 68. Russia Cancer Therapeutics Market Share, By Top Selling Drugs, In USD Billion, 2016-2030F
- Figure 69. Russia Cancer Therapeutics Market Share, By End-user, In USD Billion, 2016-2030F
- Figure 70. Netherlands Cancer Therapeutics Market, By Value, In USD Billion, 2016-2030F
- Figure 71. Netherlands Cancer Therapeutics Market, By Volume, In Million Units, 2016-2030F
- Figure 72. Netherlands Cancer Therapeutics Market Share, By Applications, In USD Billion, 2016-2030F
- Figure 73. Netherlands Cancer Therapeutics Market Share, By Therapeutics, In USD Billion, 2016-2030F
- Figure 74. Netherlands Cancer Therapeutics Market Share, By Top Selling Drugs, In USD Billion, 2016-2030F
- Figure 75. Netherlands Cancer Therapeutics Market Share, By End-user, In USD Billion, 2016-2030F
- Figure 76. Spain Cancer Therapeutics Market, By Value, In USD Billion, 2016-2030F
- Figure 77. Spain Cancer Therapeutics Market, By Volume, In Million Units, 2016-2030F
- Figure 78. Spain Cancer Therapeutics Market Share, By Applications, In USD Billion, 2016-2030F
- Figure 79. Spain Cancer Therapeutics Market Share, By Therapeutics, In USD Billion, 2016-2030F
- Figure 80. Spain Cancer Therapeutics Market Share, By Top Selling Drugs, In USD Billion, 2016-2030F
- Figure 81. Spain Cancer Therapeutics Market Share, By End-user, In USD Billion, 2016-2030F
- Figure 82. Turkey Cancer Therapeutics Market, By Value, In USD Billion, 2016-2030F
- Figure 83. Turkey Cancer Therapeutics Market, By Volume, In Million Units, 2016-2030F
- Figure 84. Turkey Cancer Therapeutics Market Share, By Applications, In USD Billion, 2016-2030F
- Figure 85. Turkey Cancer Therapeutics Market Share, By Therapeutics, In USD Billion, 2016-2030F
- Figure 86. Turkey Cancer Therapeutics Market Share, By Top Selling Drugs, In USD Billion, 2016-2030F
- Figure 87. Turkey Cancer Therapeutics Market Share, By End-user, In USD Billion, 2016-2030F
- Figure 88. Poland Cancer Therapeutics Market, By Value, In USD Billion, 2016-2030F
- Figure 89. Poland Cancer Therapeutics Market, By Volume, In Million Units, 2016-2030F
- Figure 90. Poland Cancer Therapeutics Market Share, By Applications, In USD Billion, 2016-2030F
- Figure 91. Poland Cancer Therapeutics Market Share, By Therapeutics, In USD Billion, 2016-2030F
- Figure 92. Poland Cancer Therapeutics Market Share, By Top Selling Drugs, In USD Billion, 2016-2030F
- Figure 93. Poland Cancer Therapeutics Market Share, By End-user, In USD Billion, 2016-2030F
- Figure 94. South America Cancer Therapeutics Market, By Value, In USD Billion, 2016-2030F
- Figure 95. South America Cancer Therapeutics Market, By Volume, In Million Units, 2016-2030F
- Figure 96. South America Cancer Therapeutics Market Share, By Applications, In USD Billion, 2016-2030F
- Figure 97. South America Cancer Therapeutics Market Share, By Therapeutics, In USD Billion, 2016-2030F
- Figure 98. South America Cancer Therapeutics Market Share, By Top Selling Drugs, In USD Billion, 2016-2030F
- Figure 99. South America Cancer Therapeutics Market Share, By End-user, In USD Billion, 2016-2030F
- Figure 100. South America Cancer Therapeutics Market Share, By Country, In USD Billion, 2016-2030F
- Figure 101. Brazil Cancer Therapeutics Market, By Value, In USD Billion, 2016-2030F
- Figure 102. Brazil Cancer Therapeutics Market, By Volume, In Million Units, 2016-2030F
- Figure 103. Brazil Cancer Therapeutics Market Share, By Applications, In USD Billion, 2016-2030F
- Figure 104. Brazil Cancer Therapeutics Market Share, By Therapeutics, In USD Billion, 2016-2030F
- Figure 105. Brazil Cancer Therapeutics Market Share, By Top Selling Drugs, In USD Billion, 2016-2030F
- Figure 106. Brazil Cancer Therapeutics Market Share, By End-user, In USD Billion, 2016-2030F
- Figure 107. Argentina Cancer Therapeutics Market, By Value, In USD Billion, 2016-2030F
- Figure 108. Argentina Cancer Therapeutics Market, By Volume, In Million Units, 2016-2030F
- Figure 109. Argentina Cancer Therapeutics Market Share, By Applications, In USD Billion, 2016-2030F
- Figure 110. Argentina Cancer Therapeutics Market Share, By Therapeutics, In USD Billion, 2016-2030F
- Figure 111. Argentina Cancer Therapeutics Market Share, By Top Selling Drugs, In USD Billion, 2016-2030F
- Figure 112. Argentina Cancer Therapeutics Market Share, By End-user, In USD Billion, 2016-2030F
- Figure 113. Asia-Pacific Cancer Therapeutics Market, By Value, In USD Billion, 2016-2030F
- Figure 114. Asia-Pacific Cancer Therapeutics Market, By Volume, In Million Units, 2016-2030F
- Figure 115. Asia-Pacific Cancer Therapeutics Market Share, By Applications, In USD Billion, 2016-2030F
- Figure 116. Asia-Pacific Cancer Therapeutics Market Share, By Therapeutics, In USD Billion, 2016-2030F
- Figure 117. Asia-Pacific Cancer Therapeutics Market Share, By Top Selling Drugs, In USD Billion, 2016-2030F
- Figure 118. Asia-Pacific Cancer Therapeutics Market Share, By End-user, In USD Billion, 2016-2030F
- Figure 119. Asia-Pacific Cancer Therapeutics Market Share, By Country, In USD Billion, 2016-2030F
- Figure 120. India Cancer Therapeutics Market, By Value, In USD Billion, 2016-2030F
- Figure 121. India Cancer Therapeutics Market, By Volume, In Million Units, 2016-2030F
- Figure 122. India Cancer Therapeutics Market Share, By Applications, In USD Billion, 2016-2030F
- Figure 123. India Cancer Therapeutics Market Share, By Therapeutics, In USD Billion, 2016-2030F
- Figure 124. India Cancer Therapeutics Market Share, By Top Selling Drugs, In USD Billion, 2016-2030F
- Figure 125. India Cancer Therapeutics Market Share, By End-user, In USD Billion, 2016-2030F
- Figure 126. China Cancer Therapeutics Market, By Value, In USD Billion, 2016-2030F
- Figure 127. China Cancer Therapeutics Market, By Volume, In Million Units, 2016-2030F
- Figure 128. China Cancer Therapeutics Market Share, By Applications, In USD Billion, 2016-2030F
- Figure 129. China Cancer Therapeutics Market Share, By Therapeutics, In USD Billion, 2016-2030F
- Figure 130. China Cancer Therapeutics Market Share, By Top Selling Drugs, In USD Billion, 2016-2030F
- Figure 131. China Cancer Therapeutics Market Share, By End-user, In USD Billion, 2016-2030F
- Figure 132. Japan Cancer Therapeutics Market, By Value, In USD Billion, 2016-2030F
- Figure 133. Japan Cancer Therapeutics Market, By Volume, In Million Units, 2016-2030F
- Figure 134. Japan Cancer Therapeutics Market Share, By Applications, In USD Billion, 2016-2030F
- Figure 135. Japan Cancer Therapeutics Market Share, By Therapeutics, In USD Billion, 2016-2030F
- Figure 136. Japan Cancer Therapeutics Market Share, By Top Selling Drugs, In USD Billion, 2016-2030F
- Figure 137. Japan Cancer Therapeutics Market Share, By End-user, In USD Billion, 2016-2030F
- Figure 138. Australia Cancer Therapeutics Market, By Value, In USD Billion, 2016-2030F
- Figure 139. Australia Cancer Therapeutics Market, By Volume, In Million Units, 2016-2030F
- Figure 140. Australia Cancer Therapeutics Market Share, By Applications, In USD Billion, 2016-2030F
- Figure 141. Australia Cancer Therapeutics Market Share, By Therapeutics, In USD Billion, 2016-2030F
- Figure 142. Australia Cancer Therapeutics Market Share, By Top Selling Drugs, In USD Billion, 2016-2030F
- Figure 143. Australia Cancer Therapeutics Market Share, By End-user, In USD Billion, 2016-2030F
- Figure 144. Vietnam Cancer Therapeutics Market, By Value, In USD Billion, 2016-2030F
- Figure 145. Vietnam Cancer Therapeutics Market, By Volume, In Million Units, 2016-2030F
- Figure 146. Vietnam Cancer Therapeutics Market Share, By Applications, In USD Billion, 2016-2030F
- Figure 147. Vietnam Cancer Therapeutics Market Share, By Therapeutics, In USD Billion, 2016-2030F
- Figure 148. Vietnam Cancer Therapeutics Market Share, By Top Selling Drugs, In USD Billion, 2016-2030F
- Figure 149. Vietnam Cancer Therapeutics Market Share, By End-user, In USD Billion, 2016-2030F
- Figure 150. South Korea Cancer Therapeutics Market, By Value, In USD Billion, 2016-2030F
- Figure 151. South Korea Cancer Therapeutics Market, By Volume, In Million Units, 2016-2030F
- Figure 152. South Korea Cancer Therapeutics Market Share, By Applications, In USD Billion, 2016-2030F
- Figure 153. South Korea Cancer Therapeutics Market Share, By Therapeutics, In USD Billion, 2016-2030F
- Figure 154. South Korea Cancer Therapeutics Market Share, By Top Selling Drugs, In USD Billion, 2016-2030F
- Figure 155. South Korea Cancer Therapeutics Market Share, By End-user, In USD Billion, 2016-2030F
- Figure 156. Indonesia Cancer Therapeutics Market, By Value, In USD Billion, 2016-2030F
- Figure 157. Indonesia Cancer Therapeutics Market, By Volume, In Million Units, 2016-2030F
- Figure 158. Indonesia Cancer Therapeutics Market Share, By Applications, In USD Billion, 2016-2030F
- Figure 159. Indonesia Cancer Therapeutics Market Share, By Therapeutics, In USD Billion, 2016-2030F
- Figure 160. Indonesia Cancer Therapeutics Market Share, By Top Selling Drugs, In USD Billion, 2016-2030F
- Figure 161. Indonesia Cancer Therapeutics Market Share, By End-user, In USD Billion, 2016-2030F
- Figure 162. Philippines Cancer Therapeutics Market, By Value, In USD Billion, 2016-2030F
- Figure 163. Philippines Cancer Therapeutics Market, By Volume, In Million Units, 2016-2030F
- Figure 164. Philippines Cancer Therapeutics Market Share, By Applications, In USD Billion, 2016-2030F
- Figure 165. Philippines Cancer Therapeutics Market Share, By Therapeutics, In USD Billion, 2016-2030F
- Figure 166. Philippines Cancer Therapeutics Market Share, By Top Selling Drugs, In USD Billion, 2016-2030F
- Figure 167. Philippines Cancer Therapeutics Market Share, By End-user, In USD Billion, 2016-2030F
- Figure 168. Middle East & Africa Cancer Therapeutics Market, By Value, In USD Billion, 2016-2030F
- Figure 169. Middle East & Africa Cancer Therapeutics Market, By Volume, In Million Units, 2016-2030F
- Figure 170. Middle East & Africa Cancer Therapeutics Market Share, By Applications, In USD Billion, 2016-2030F
- Figure 171. Middle East & Africa Cancer Therapeutics Market Share, By Therapeutics, In USD Billion, 2016-2030F
- Figure 172. Middle East & Africa Cancer Therapeutics Market Share, By Top Selling Drugs, In USD Billion, 2016-2030F
- Figure 173. Middle East & Africa Cancer Therapeutics Market Share, By End-user, In USD Billion, 2016-2030F
- Figure 174. Middle East & Africa Cancer Therapeutics Market Share, By Country, In USD Billion, 2016-2030F
- Figure 175. Saudi Arabia Cancer Therapeutics Market, By Value, In USD Billion, 2016-2030F
- Figure 176. Saudi Arabia Cancer Therapeutics Market, By Volume, In Million Units, 2016-2030F
- Figure 177. Saudi Arabia Cancer Therapeutics Market Share, By Applications, In USD Billion, 2016-2030F
- Figure 178. Saudi Arabia Cancer Therapeutics Market Share, By Therapeutics, In USD Billion, 2016-2030F
- Figure 179. Saudi Arabia Cancer Therapeutics Market Share, By Top Selling Drugs, In USD Billion, 2016-2030F
- Figure 180. Saudi Arabia Cancer Therapeutics Market Share, By End-user, In USD Billion, 2016-2030F
- Figure 181. UAE Cancer Therapeutics Market, By Value, In USD Billion, 2016-2030F
- Figure 182. UAE Cancer Therapeutics Market, By Volume, In Million Units, 2016-2030F
- Figure 183. UAE Cancer Therapeutics Market Share, By Applications, In USD Billion, 2016-2030F
- Figure 184. UAE Cancer Therapeutics Market Share, By Therapeutics, In USD Billion, 2016-2030F
- Figure 185. UAE Cancer Therapeutics Market Share, By Top Selling Drugs, In USD Billion, 2016-2030F
- Figure 186. UAE Cancer Therapeutics Market Share, By End-user, In USD Billion, 2016-2030F
- Figure 187. South Africa Cancer Therapeutics Market, By Value, In USD Billion, 2016-2030F
- Figure 188. South Africa Cancer Therapeutics Market, By Volume, In Million Units, 2016-2030F
- Figure 189. South Africa Cancer Therapeutics Market Share, By Applications, In USD Billion, 2016-2030F
- Figure 190. South Africa Cancer Therapeutics Market Share, By Therapeutics, In USD Billion, 2016-2030F
- Figure 191. South Africa Cancer Therapeutics Market Share, By Top Selling Drugs, In USD Billion, 2016-2030F
- Figure 192. South Africa Cancer Therapeutics Market Share, By End-user, In USD Billion, 2016-2030F
- Figure 193. By Applications Map-Market Size (USD Billion) & Growth Rate (%), 2022
- Figure 194. By Therapeutics Map-Market Size (USD Billion) & Growth Rate (%), 2022
- Figure 195. By Top Selling Drugs Map-Market Size (USD Billion) & Growth Rate (%), 2022
- Figure 196. By End-user Map-Market Size (USD Billion) & Growth Rate (%), 2022
- Figure 197. By Region Map-Market Size (USD Billion) & Growth Rate (%), 2022
Global cancer therapeutics market size was valued at USD 151.5 billion in 2022, and is expected to reach USD 336.8 billion in 2030, with a CAGR of 10.5% for the forecast period between 2023 and 2030F. The global market for cancer therapies is expanding and changing significantly. The rise in early diagnosis and treatment awareness, rising cancer prevalence, improvements in medical technology, and increasing aging population that is more prone to diseases has contributed to the market's expansion.
The ongoing development of novel cancer treatments, including immunotherapies, targeted medicines, and individualized medicine, has been one of the major drivers. These treatments have dramatically improved patient outcomes and survival rates while demonstrating promising results in the treatment of different cancer types. Many new medications have been approved because of considerable oncology research and development activities in the pharmaceutical industry, improving the overall treatment environment. Additionally, governments and healthcare organizations from all over the world have been actively encouraging access to economical and efficient cancer therapies as well as funding in cancer research. Due to improvement in reimbursement practices and the expansion of the healthcare infrastructure, a larger population now has easier access to cancer therapies.
Rise in Prevalence of Cancer Cases
The market for cancer therapies is expanding because of the rising incidence of cancer cases and new cancer research. Additionally, according to the Globocan 2020 data sheet, 19,292,789 new instances of cancer were diagnosed globally, and roughly 9,958,133 people died because of cancer worldwide. Additionally, the International Agency for Research on Cancer (IARC) estimates that by the year 2040, there would be 30.2 million cancer patients worldwide and 16.3 million cancer-related deaths. Due to this, the market for cancer therapeutics is anticipated to grow throughout the forecast period. Also, increasing need for sophisticated cancer medicines for the effective treatment of patients will expand the market. Additionally, 19.3 million people worldwide were given a cancer diagnosis in 2020, while the number of cancer-related deaths increased to 10 million. In addition, 2.3 million new instances of breast cancer were diagnosed in the year 2020, accounting for about 12% of all cancer cases. Wherein, one of the main causes of cancer-related deaths in women is breast cancer.
Surge in Collaboration Between Pharmaceutical Companies
The global cancer therapeutics market has witnessed a remarkable surge in collaboration among pharmaceutical companies in recent years. The trend is driven by several key factors that underscore the importance of cooperation in the fight against cancer. Cancer is a complex and multifaceted disease, often requiring a multi-pronged approach for effective treatment. Collaborations between pharmaceutical giants and smaller, specialized biotech firms have allowed for the pooling of resources, knowledge, and expertise. This has expedited the development of innovative cancer therapies and drugs, leading to more promising treatment options for patients. The rising cost of research and development in the pharmaceutical industry, has made collaboration a financially prudent choice. By sharing the financial burden, companies can allocate their resources more efficiently, potentially reducing the overall cost of drug development. This, in turn, can result in more affordable cancer treatments for patients. The increasing prevalence of cancer worldwide has created a sense of urgency to find effective therapies. Collaborations enable pharmaceutical companies to expedite clinical trials and regulatory approvals, getting potentially life-saving treatments to patients faster.
On July 13, 2023 , ICR announced a collaboration with the Bellvitge Biomedical Research Institute aimed at integrating AI, drug discovery, and investigational cancer models and platforms. This partnership seeks to pioneer therapies combating drug resistance. The joint research team's focus is on developing small molecules capable of targeting vulnerabilities in cancers with KRAS mutation.
Technological Advancements
The global cancer therapeutics market has witnessed significant technological advancements in recent years, revolutionizing the way cancer is diagnosed and treated. These innovations have improved patient outcomes and increased the overall efficiency of cancer care. Breakthroughs in immunotherapy have ushered in a new era of cancer treatment. Therapies like, checkpoint inhibitors and CAR-T cell therapy, harness the body's immune system to target and destroy cancer cells, offering remarkable results in various malignancies. The advent of precision medicine has enabled oncologists to tailor treatments based on an individual's genetic profile. Genetic sequencing and biomarker analysis help identify specific mutations and drive the development of targeted therapies, minimizing side effects and optimizing treatment efficacy.
In January 2023, the FDA granted Roche authorization to market Tecentriq (atezolizumab), which is used in conjunction with chemotherapy, as the first-line therapy for people with metastatic non-small cell lung cancer (NSCLC) who have at least 1% PD-L1 expression.
Innovative Cancer Therapies
The global cancer therapeutics market has witnessed a remarkable surge in innovative therapies, offering new hope in the battle against cancer. Immunotherapy is a modern approach that harnesses the body's immune system to target and destroy cancer cells. Checkpoint inhibitors like PD-1 and CTLA-4 inhibitors have demonstrated remarkable success, providing long-lasting responses in various malignancies. Targeted therapies, such as tyrosine kinase inhibitors, aim at specific molecular pathways driving cancer growth. CAR-T cell therapy has emerged as a notable change, engineering a patient's own T cells to attack cancer cells with unprecedented precision, leading to remarkable outcomes in hematological malignancies.
Novartis announced results from a new pooled exploratory analysis across the entire MONALEESA Phase III program in September 2022, confirming nearly one year of additional overall survival (OS) benefit in a subgroup of patients with aggressive forms of HR+/HER2- advanced breast cancer (aBC).
Impact of COVID-19
The COVID-19 pandemic had a global impact on healthcare systems, as well as the cancer medicines business. According to a paper published in Cancer Connect 2020, scientists from Dana Farber Cancer Institute discovered a 46% drop in diagnoses of the six most frequent cancer types during the COVID-19 pandemic, breast, colorectal, lung, pancreatic, gastric, and esophageal cancers. Furthermore, the centers for Disease Control and Prevention (CDC) and many medical professional organizations advised that cancer screening and other health prevention services, as well as elective surgeries, be postponed, unless the risks outweighed the benefits, and that hospital infrastructure remained secure for the treatment of COVID-19 patients. As a result, the COVID-19 pandemic had a major influence on the cancer treatments business.
Key Players Landscape and Outlook
The Global Cancer Therapeutics Market is highly competitive, with several large firms. Strategic collaborations and increased investment in oncology research by major players aid in securing their position and presence globally. These market participants are attempting to increase their market share by undergoing collaborations, mergers, and acquisitions etc. Businesses are also investing in the development of new products and concentrating on keeping competitive pricing.
Trastuzumab Deruxtecan (Enhertu), developed by AstraZeneca, was granted FDA approval in February 2023 for the treatment of patients with metastatic HER2-positive breast cancer who have had at least two prior systemic treatments.
Table of Contents
1. Research Methodology
2. Project Scope & Definitions
3. Impact of COVID-19 on the Global Cancer Therapeutics Market
4. Executive Summary
5. Global Cancer Therapeutics Market Outlook, 2016-2030F
- 5.1. Market Size & Forecast
- 5.1.1. By Value
- 5.1.2. By Volume
- 5.2. By Applications
- 5.2.1. Lung Cancer
- 5.2.2. Blood Cancer
- 5.2.3. Colorectal Cancer
- 5.2.4. Prostate Cancer
- 5.2.5. Breast Cancer
- 5.2.6. Cervical Cancer
- 5.2.7. Glioblastoma
- 5.2.8. Head and Neck Cancer
- 5.2.9. Malignant Meningioma
- 5.2.10. Mesothelioma
- 5.2.11. Melanoma
- 5.2.12. Others
- 5.3. By Therapeutics
- 5.3.1. Chemotherapy
- 5.3.2. Targeted Therapy
- 5.3.3. Immunotherapy
- 5.3.4. Hormonal Therapy
- 5.3.5. Other
- 5.4. By Top Selling Drugs
- 5.4.1. Revlimid
- 5.4.2. Avastin
- 5.4.3. Herceptin
- 5.4.4. Rituxan
- 5.4.5. Opdivo
- 5.4.6. Gleevec
- 5.4.7. Velcade
- 5.4.8. Imbruvica
- 5.4.9. Ibrance
- 5.4.10. Zytiga
- 5.4.11. Alimta
- 5.4.12. Xtandi
- 5.4.13. Tarceva
- 5.4.14. Perjeta
- 5.4.15. Temodar
- 5.4.16. Others
- 5.5. By End-user
- 5.5.1. Hospitals
- 5.5.2. Specialty Clinics
- 5.5.3. Cancer and Radiation Therapy Centers
- 5.6. By Region
- 5.6.1. North America
- 5.6.2. Europe
- 5.6.3. Asia-Pacific
- 5.6.4. South America
- 5.6.5. Middle East & Africa
- 5.7. By Company Market Share (%), 2022
6. Global Cancer Therapeutics Market Outlook, By Region, 2016-2030F
- 6.1. North America*
- 6.1.1. Market Size & Forecast
- 6.1.1.1. By Value
- 6.1.1.2. By Volume
- 6.1.2. By Application
- 6.1.2.1. Lung Cancer
- 6.1.2.2. Blood Cancer
- 6.1.2.3. Colorectal Cancer
- 6.1.2.4. Prostate Cancer
- 6.1.2.5. Breast Cancer
- 6.1.2.6. Cervical Cancer
- 6.1.2.7. Glioblastoma
- 6.1.2.8. Head and Neck Cancer
- 6.1.2.9. Malignant Meningioma
- 6.1.2.10. Mesothelioma
- 6.1.2.11. Melanoma
- 6.1.2.12. Others
- 6.1.3. By Therapeutics
- 6.1.3.1. Chemotherapy
- 6.1.3.2. Targeted Therapy
- 6.1.3.3. Immunotherapy
- 6.1.3.4. Hormonal Therapy
- 6.1.3.5. Other
- 6.1.4. By Top Selling Drugs
- 6.1.4.1. Revlimid
- 6.1.4.2. Avastin
- 6.1.4.3. Herceptin
- 6.1.4.4. Rituxan
- 6.1.4.5. Opdivo
- 6.1.4.6. Gleevec
- 6.1.4.7. Velcade
- 6.1.4.8. Imbruvica
- 6.1.4.9. Ibrance
- 6.1.4.10. Zytiga
- 6.1.4.11. Alimta
- 6.1.4.12. Xtandi
- 6.1.4.13. Tarceva
- 6.1.4.14. Perjeta
- 6.1.4.15. Temodar
- 6.1.4.16. Others
- 6.1.5. By End User
- 6.1.5.1. Hospitals
- 6.1.5.2. Specialty Clinics
- 6.1.5.3. Cancer and Radiation Therapy Centers
- 6.1.6. United States*
- 6.1.6.1. Market Size & Forecast
- 6.1.6.1.1. By Value
- 6.1.6.1.2. By Volume
- 6.1.6.2. By Applications
- 6.1.6.2.1. Lung Cancer
- 6.1.6.2.2. Blood Cancer
- 6.1.6.2.3. Colorectal Cancer
- 6.1.6.2.4. Prostate Cancer
- 6.1.6.2.5. Breast Cancer
- 6.1.6.2.6. Cervical Cancer
- 6.1.6.2.7. Glioblastoma
- 6.1.6.2.8. Head and Neck Cancer
- 6.1.6.2.9. Malignant Meningioma
- 6.1.6.2.10. Mesothelioma
- 6.1.6.2.11. Melanoma
- 6.1.6.2.12. Others
- 6.1.6.3. By Therapeutics
- 6.1.6.3.1.1. Chemotherapy
- 6.1.6.3.1.2. Targeted Therapy
- 6.1.6.3.1.3. Immunotherapy
- 6.1.6.3.1.4. Hormonal Therapy
- 6.1.6.3.1.5. Other
- 6.1.6.4. By Top Selling Drugs
- 6.1.6.4.1.1. Revlimid
- 6.1.6.4.1.2. Avastin
- 6.1.6.4.1.3. Herceptin
- 6.1.6.4.1.4. Rituxan
- 6.1.6.4.1.5. Opdivo
- 6.1.6.4.1.6. Gleevec
- 6.1.6.4.1.7. Velcade
- 6.1.6.4.1.8. Imbruvica
- 6.1.6.4.1.9. Ibrance
- 6.1.6.4.1.10. Zytiga
- 6.1.6.4.1.11. Alimta
- 6.1.6.4.1.12. Xtandi
- 6.1.6.4.1.13. Tarceva
- 6.1.6.4.1.14. Perjeta
- 6.1.6.4.1.15. Temodar
- 6.1.6.4.1.16. Others
- 6.1.6.5. By End User
- 6.1.6.5.1.1. Hospitals
- 6.1.6.5.1.2. Specialty Clinics
- 6.1.6.5.1.3. Cancer and Radiation Therapy Centers
- 6.1.7. Canada
- 6.1.8. Mexico
- 6.1.1. Market Size & Forecast
All segments will be provided for all regions and countries covered:
- 6.2. Europe
- 6.2.1. Germany
- 6.2.2. France
- 6.2.3. Italy
- 6.2.4. United Kingdom
- 6.2.5. Russia
- 6.2.6. Netherlands
- 6.2.7. Spain
- 6.2.8. Turkey
- 6.2.9. Poland
- 6.3. South America
- 6.3.1. Brazil
- 6.3.2. Argentina
- 6.4. Asia-Pacific
- 6.4.1. India
- 6.4.2. China
- 6.4.3. Japan
- 6.4.4. Australia
- 6.4.5. Vietnam
- 6.4.6. South Korea
- 6.4.7. Indonesia
- 6.4.8. Philippines
- 6.5. Middle East & Africa
- 6.5.1. Saudi Arabia
- 6.5.2. UAE
- 6.5.3. South Africa
7. Market Mapping, 2022
- 7.1. By Applications
- 7.2. By Therapeutics
- 7.3. By Top Selling Drugs
- 7.4. By End User
- 7.5. By Region
8. Macro Environment and Industry Structure
- 8.1. Supply Demand Analysis
- 8.2. Import Export Analysis - Volume and Value
- 8.3. Supply/Value Chain Analysis
- 8.4. PESTEL Analysis
- 8.4.1. Political Factors
- 8.4.2. Economic System
- 8.4.3. Social Implications
- 8.4.4. Technological Advancements
- 8.4.5. Environmental Impacts
- 8.4.6. Legal Compliances and Regulatory Policies (Statutory Bodies Included)
- 8.5. Porter's Five Forces Analysis
- 8.5.1. Supplier Power
- 8.5.2. Buyer Power
- 8.5.3. Substitution Threat
- 8.5.4. Threat from New Entrant
- 8.5.5. Competitive Rivalry
9. Market Dynamics
- 9.1. Growth Drivers
- 9.2. Growth Inhibitors (Challenges, Restraints)
10. Regulatory Framework and Innovation
- 10.1. Clinical Trials
- 10.2. Patent Landscape
- 10.3. Regulatory Approvals
- 10.4. Innovations/Emerging Technologies
11. Key Players Landscape
- 11.1. Competition Matrix of Top Five Market Leaders
- 11.2. Market Revenue Analysis of Top Five Market Leaders (in %, 2022)
- 11.3. Mergers and Acquisitions/Joint Ventures (If Applicable)
- 11.4. SWOT Analysis (For Five Market Players)
- 11.5. Patent Analysis (If Applicable)
12. Pricing Analysis
13. Case Studies
14. Key Players Outlook
- 14.1. F. Hoffmann-La Roche AG
- 14.1.1. Company Details
- 14.1.2. Key Management Personnel
- 14.1.3. Products & Services
- 14.1.4. Financials (As reported)
- 14.1.5. Key Market Focus & Geographical Presence
- 14.1.6. Recent Developments
- 14.2. Bristol-Myers Squibb Company
- 14.3. AbbVie, Inc.
- 14.4. Johnson & Johnson
- 14.5. Celgene Corporation
- 14.6. Astellas Pharma, Inc.
- 14.7. Pfizer, Inc.
- 14.8. Novartis AG
- 14.9. Merck KGaA
- 14.10. Eli Lilly and Company
Companies mentioned above DO NOT hold any order as per market share and can be changed as per information available during research work.
