
エリスリトールの市場機会、成長促進要因、産業動向分析、予測、2025年~2034年
Erythritol Market Opportunity, Growth Drivers, Industry Trend Analysis, and Forecast 2025 - 2034- 発行日
- ページ情報
- 英文 165 Pages
- 納期
- 2~3営業日
- 商品コード
- 1750579
- カスタマイズ可能 お客様のご希望に応じて、既存データの加工や未掲載情報(例:国別セグメント)の追加などの対応が可能です。詳細はお問い合わせください。
- 翻訳ツール提供対象 PDF対応AI翻訳ツールの無料貸し出しサービスのご利用が可能です
概要
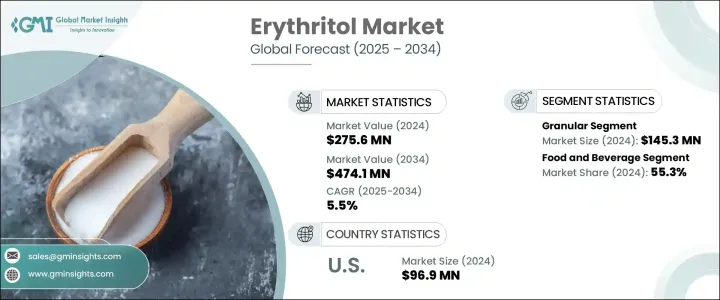
エリスリトールの世界市場は、2024年に2億7,560万米ドルと評価され、消費者の健康意識と低カロリー・無糖製品の需要により、CAGR 5.5%で成長し、2034年には4億7,410万米ドルに達すると予測されています。
より健康的なライフスタイルを志向する個人が増えるにつれ、エリスリトールは、焼き菓子、菓子類、食品・飲料などの砂糖代替品として人気を博しています。この動向は特に欧州と北米で顕著であり、砂糖代替品へのシフトが市場の大幅な拡大に拍車をかけています。さらに、アジア太平洋とラテンアメリカの新興市場でエリスリトールの採用が増加していることも、その継続的な成長を後押ししています。これらの地域が経済的に成長し、健康志向の消費習慣が進化するにつれて、エリスリトールの市場浸透率は一貫して増加すると予想されます。
同市場は、より健康的で持続可能な選択肢を求める需要の高まりに沿った、天然材料や植物由来の食品材料の増加から利益を得ています。植物由来の糖アルコールであるエリスリトールは、この動向にスムーズに適合し、従来の砂糖に代わるものを求める消費者の支持を得ています。市場全体の成長は、エリスリトールのような砂糖代替品への持続的な需要を牽引する、より健康的な生活への世界の後押しを反映しています。
| 市場範囲 | |
|---|---|
| 開始年 | 2024 |
| 予測年 | 2025-2034 |
| 開始金額 | 2億7,560万米ドル |
| 予測金額 | 4億7,410万米ドル |
| CAGR | 5.5% |
2024年、エリスリトール市場の粒状セグメントは1億4,530万米ドルと評価され、特に食品・飲料製造など様々な用途での使いやすさと汎用性の高さから、2025年から2034年にかけてCAGR 5.6%で成長すると予測されています。食感も甘味も砂糖によく似ているため、焼き菓子、飲料、菓子類に最適です。レシピの計量や混合が容易なことも、住宅や商業施設での普及に貢献しています。粒状は、カロリーを追加することなく砂糖のような味を提供する能力から特に好まれ、消費者に健康的な選択肢を提供しています。
食品・飲料セクターは、2024年に1億5,240万米ドルを占め、2034年までCAGR 5.7%で成長すると予想されています。この分野におけるエリスリトールの需要は、より健康的で低カロリー、砂糖不使用の製品に対する消費者の嗜好の高まりが原動力となっています。エリスリトールの低グリセミック指数は、焼成時の高熱に耐える能力とともに、クッキーからケーキやペストリーに至るまで、幅広い食品の製造に理想的な選択肢となっています。
米国のエリスリトール市場は2024年に9,690万米ドルとなり、2034年までのCAGR成長率は5.5%と予測されています。低炭水化物ダイエットやケトジェニックダイエットの人気に牽引され、北東部や西部などの地域で需要が旺盛です。砂糖の摂取に伴う健康リスクに対する意識の高まりが、加工食品、食品・飲料、スナック菓子におけるエリスリトールの使用増加につながり、市場の成長を後押ししています。
エリスリトールの世界市場における主要企業は、Foodchem International Corporation、Tate & Lyle、Cargill、Jungbunzlauer Suisse AG、Shandong Sanyuan Biotechnologyなどです。各社は、天然甘味料の需要拡大に対応するため、製品のイノベーション、流通チャネルの拡大、持続可能な生産方法の開発に投資することに注力し、その地位を強化しています。エリスリトール市場での存在感を高めるため、企業はいくつかの重要な戦略を採用しています。これには、効率改善とコスト削減のために生産プロセスの技術的進歩に注力することや、より幅広い砂糖代替品を提供するために製品ポートフォリオを拡大することなどが含まれます。さらに、大手メーカーは市場参入を強化し、新たな消費者層を開拓するために、食品・飲料分野の主要企業と戦略的パートナーシップを結んでいます。
目次
第1章 調査手法と範囲
第2章 エグゼクティブサマリー
第3章 業界考察
- エコシステム分析
- バリューチェーンに影響を与える要因
- 利益率分析
- ディスラプション
- 将来の展望
- 製造業者
- 販売代理店
- トランプ政権による関税への影響
- 貿易への影響
- 貿易量の混乱
- 報復措置
- 業界への影響
- 供給側の影響(原材料)
- 主要原材料の価格変動
- サプライチェーンの再構築
- 生産コストへの影響
- 供給側の影響(原材料)
- 需要側の影響(販売価格)
- 最終市場への価格伝達
- 市場シェアの動向
- 消費者の反応パターン
- 影響を受ける主要企業
- 戦略的な業界対応
- サプライチェーンの再構成
- 価格設定と製品戦略
- 政策関与
- 展望と今後の検討事項
- 貿易への影響
- 貿易統計(HSコード)
- 主要輸出国、2021-2024
- 主要輸入国、2021-2024
- サプライヤーの情勢
- 利益率分析
- 主なニュースと取り組み
- 規制情勢
- FDA規制とGRASステータス
- 欧州食品安全機関(EFSA)のガイドライン
- アジア太平洋の規制環境
- 国際規格と認証
- 影響要因
- 促進要因
- 低カロリー・無糖食品の需要増加
- 消費者の健康意識の高まり
- 植物由来および天然食品成分の動向の成長
- ケトジェニックダイエットと低炭水化物ダイエットの人気
- 業界の潜在的リスク&課題
- 他の甘味料に比べて生産コストが高め
- 新興市場における消費者の認知度の低さ
- 促進要因
- 貿易分析
- 輸入・輸出シナリオ
- 関税および非関税障壁
- 反ダンピング措置と貿易紛争
- 自由貿易協定の影響
- テクノロジーの情勢
- 現在の生産技術
- 発酵プロセスの革新
- 精製および結晶化技術
- 新興技術と特許
- 価格分析
- 価格動向2021-2024
- コスト構造分析
- 価格戦略評価
- 地域による価格差
- バリューチェーン分析
- 原材料調達とサプライヤー
- 製造・加工
- 流通チャネル
- 最終用途アプリケーション
- 業界への影響分析
- COVID-19の影響評価
- ロシア・ウクライナ戦争の影響
- 経済不況の要因
- サプライチェーンの混乱
- 成長可能性分析
- ポーター分析
- PESTEL分析
第4章 競合情勢
- イントロダクション
- 企業の市場シェア分析
- 世界市場シェア分布
- 地域市場シェア分析
- ティア分析主要プレーヤー
- 競合ベンチマーキング
- 製品ポートフォリオの比較
- 生産能力評価
- 価格戦略の比較
- 流通ネットワークの強さ
- 研究開発能力とイノベーション
- 戦略的取り組み
- 合併と買収
- ジョイントベンチャーとパートナーシップ
- 能力拡張
- 新製品の発売
- 技術協力
- 競合ポジショニングマトリックス
- マーケットリーダー
- 新興プレーヤー
- イノベーター
- ニッチプレイヤー
- 戦略的ダッシュボード
第5章 市場推定・予測:形態別、2021年~2034年
- 主要動向
- 粉末
- 粒状
- 液体
第6章 市場推定・予測:純度別、2021年~2034年
- 主要動向
- 高純度(99%以上)
- 標準純度(95~98%)
- その他
第7章 市場推定・予測:用途別、2021年~2034年
- 主要動向
- 食品・飲料
- ベーカリー・菓子類
- 飲料
- 乳製品
- 冷凍デザート
- その他
- 医薬品
- 錠剤・カプセル
- シロップ・懸濁液
- その他
- パーソナルケア・化粧品
- オーラルケア製品
- スキンケア製品
- その他
- その他
- 農業用途
- 工業用途
第8章 市場推定・予測:地域別、2021年~2034年
- 主要動向
- 北米
- 米国
- カナダ
- メキシコ
- 欧州
- 英国
- ドイツ
- フランス
- イタリア
- スペイン
- ロシア
- アジア太平洋地域
- 中国
- インド
- 日本
- 韓国
- オーストラリア
- ラテンアメリカ
- ブラジル
- アルゼンチン
- 中東・アフリカ
- 南アフリカ
- サウジアラビア
- アラブ首長国連邦
第9章 企業プロファイル
- Baolingbao Biology Co., Ltd.
- Cargill, Inc.
- Changzhou Niutang Chemical Plant Co., Ltd.
- Foodchem International Corporation
- Futaste Co., Ltd.
- Ingredion Incorporated
- Jungbunzlauer Suisse AG
- Mitsubishi Chemical Group Corporation
- Nikken Chemical Co., Ltd.
- RAJVI ENTERPRISE
- Shandong Sanyuan Biotechnology Co., Ltd.
- Tate & Lyle PLC
- Xiwang Group
- Zibo ZhongShi GeRui Biotech Co., Ltd.
目次
The Global Erythritol Market was valued at USD 275.6 million in 2024 and is estimated to grow at a CAGR of 5.5% to reach USD 474.1 million by 2034, driven by the health awareness among consumers and the demand for low-calorie and sugar-free products. As more individuals turn to healthier lifestyles, erythritol has gained popularity as a sugar substitute in foods and beverages such as baked goods, confectionery, and beverages. This trend is especially notable in Europe and North America, where the shift toward sugar alternatives has spurred significant market expansion. In addition, the increasing adoption of erythritol in emerging markets across Asia-Pacific and Latin America further supports its continued growth. As these regions grow economically and health-conscious consumer habits evolve, erythritol's market penetration is expected to increase consistently.
The market benefits from the rise in natural and plant-based food ingredients, which align with the growing demand for healthier and more sustainable options. Erythritol, as a plant-derived sugar alcohol, fits seamlessly into this trend, gaining favor with consumers seeking alternatives to traditional sugars. The overall growth of the market reflects the global push toward healthier living, driving sustained demand for sugar substitutes like erythritol.
| Market Scope | |
|---|---|
| Start Year | 2024 |
| Forecast Year | 2025-2034 |
| Start Value | $275.6 Million |
| Forecast Value | $474.1 Million |
| CAGR | 5.5% |
In 2024, the granular segment of the erythritol market was valued at USD 145.3 million and is projected to grow at a CAGR of 5.6% from 2025 to 2034 due to its ease of use and versatility in various applications, especially in food and beverage manufacturing. It closely resembles sugar in both texture and sweetness, making it ideal for baked goods, beverages, and confectionery. Its ability to be measured and mixed easily in recipes also contributes to its widespread adoption in residential and commercial settings. The granular form is particularly favored for its ability to deliver a sugar-like taste without the added calories, offering a healthier alternative for consumers.
The food & beverage sector, which accounted for USD 152.4 million in 2024 and is expected to grow at a CAGR of 5.7% through 2034. The demand for erythritol in this sector is driven by increasing consumer preference for healthier, low-calorie, and sugar-free products. Erythritol's low glycemic index, along with its ability to withstand high heat during baking, makes it an ideal choice for creating a wide range of food products, from cookies to cakes and pastries.
United States Erythritol Market was valued at USD 96.9 million in 2024, with a projected growth rate of 5.5% CAGR through 2034. The demand is strong in regions like the Northeast and West, driven by the popularity of low-carb and ketogenic diets. The growing awareness of the health risks associated with sugar consumption has led to increased use of erythritol in processed foods, beverages, and snacks, fueling market growth.
Key players in the Global Erythritol Market include Foodchem International Corporation, Tate & Lyle, Cargill, Jungbunzlauer Suisse AG, and Shandong Sanyuan Biotechnology. Companies are strengthening their positions by focusing on product innovation, expanding distribution channels, and investing in developing sustainable production methods to cater to the growing demand for natural sweeteners. To enhance their presence in the erythritol market, companies are adopting several key strategies. These include focusing on technological advancements in production processes to improve efficiency and reduce costs, as well as expanding their product portfolios to offer a wider range of sugar alternatives. Additionally, leading manufacturers are forming strategic partnerships with key players in the food and beverage sector to enhance market access and reach new consumer segments.
Table of Contents
Chapter 1 Methodology & Scope
- 1.1 Research methodology
- 1.2 Research approach & data sources
- 1.2.1 Primary research
- 1.2.2 Secondary research
- 1.2.3 Market size estimation techniques
- 1.2.4 Forecasting methodology
- 1.3 Research scope & assumptions
- 1.4 Market definition & segmentation
- 1.5 Limitations & challenges
- 1.6 Data validation & triangulation approach
Chapter 2 Executive Summary
- 2.1 Market overview & key findings
- 2.2 Market dynamics summary
- 2.3 Regional market highlights
- 2.4 Segmental performance overview
- 2.5 Competitive landscape snapshot
- 2.6 Future market outlook
- 2.7 Investment feasibility matrix
Chapter 3 Industry Insights
- 3.1 Industry ecosystem analysis
- 3.1.1 Factor affecting the value chain
- 3.1.2 Profit margin analysis
- 3.1.3 Disruptions
- 3.1.4 Future outlook
- 3.1.5 Manufacturers
- 3.1.6 Distributors
- 3.2 Trump administration tariffs
- 3.2.1 Impact on trade
- 3.2.1.1 Trade volume disruptions
- 3.2.1.2 Retaliatory measures
- 3.2.2 Impact on the industry
- 3.2.2.1 Supply-side impact (raw materials)
- 3.2.2.1.1 Price volatility in key materials
- 3.2.2.1.2 Supply chain restructuring
- 3.2.2.1.3 Production cost implications
- 3.2.2.1 Supply-side impact (raw materials)
- 3.2.3 Demand-side impact (selling price)
- 3.2.3.1 Price transmission to end markets
- 3.2.3.2 Market share dynamics
- 3.2.3.3 Consumer response patterns
- 3.2.4 Key companies impacted
- 3.2.5 Strategic industry responses
- 3.2.5.1 Supply chain reconfiguration
- 3.2.5.2 Pricing and product strategies
- 3.2.5.3 Policy engagement
- 3.2.6 Outlook and future considerations
- 3.2.1 Impact on trade
- 3.3 Trade statistics (HS code)
- 3.3.1 Major exporting countries, 2021-2024
- 3.3.2 Major importing countries, 2021-2024
- 3.4 Supplier landscape
- 3.5 Profit margin analysis
- 3.6 Key news & initiatives
- 3.7 Regulatory landscape
- 3.7.1 FDA regulations & GRAS status
- 3.7.2 European food safety authority (EFSA) guidelines
- 3.7.3 Asia-Pacific regulatory environment
- 3.7.4 International standards & certifications
- 3.8 Impact forces
- 3.8.1 Growth drivers
- 3.8.1.1 Increasing demand for low-calorie and sugar-free food products
- 3.8.1.2 Rising health consciousness among consumers
- 3.8.1.3 Growth of plant-based and natural food ingredient trends
- 3.8.1.4 Popularity of ketogenic and low-carb diets
- 3.8.2 Industry pitfalls & challenges
- 3.8.2.1 High production costs compared to other sweeteners
- 3.8.2.2 Limited consumer awareness in emerging markets
- 3.8.1 Growth drivers
- 3.9 Trade analysis
- 3.9.1 Import-export scenario
- 3.9.2 Tariff & non-tariff barriers
- 3.9.3 Anti-dumping measures & trade disputes
- 3.9.4 Free trade agreements impact
- 3.10 Technology landscape
- 3.10.1 Current production technologies
- 3.10.2 Fermentation process innovations
- 3.10.3 Purification & crystallization techniques
- 3.10.4 Emerging technologies & patents
- 3.11 Pricing Analysis
- 3.11.1 Price trends 2021-2024
- 3.11.2 Cost structure analysis
- 3.11.3 Pricing strategy assessment
- 3.11.4 Regional price variations
- 3.12 Value chain analysis
- 3.12.1 Raw material sourcing & suppliers
- 3.12.2 Manufacturing & processing
- 3.12.3 Distribution channels
- 3.12.4 End use applications
- 3.13 Industry impact analysis
- 3.13.1 Covid-19 impact assessment
- 3.13.2 Russia-Ukraine war implications
- 3.13.3 Economic recession factors
- 3.13.4 Supply chain disruptions
- 3.14 Growth potential analysis
- 3.15 Porter's analysis
- 3.16 PESTEL analysis
- 3.16.1 Political factors
- 3.16.2 Economic influences
- 3.16.3 Social trends
- 3.16.4 Technological innovations
- 3.16.5 Legal & regulatory framework
- 3.16.6 Environmental considerations
Chapter 4 Competitive Landscape, 2024
- 4.1 Introduction
- 4.2 Company market share analysis
- 4.2.1 Global market share distribution
- 4.2.2 Regional market share analysis
- 4.2.3 Tier analysis of key players
- 4.3 Competitive benchmarking
- 4.3.1 Product portfolio comparison
- 4.3.2 Production capacity assessment
- 4.3.3 Pricing strategy comparison
- 4.3.4 Distribution network strength
- 4.3.5 R&D capabilities & innovation
- 4.4 Strategic initiatives
- 4.4.1 Mergers & acquisitions
- 4.4.2 Joint ventures & partnerships
- 4.4.3 Capacity expansions
- 4.4.4 New product launches
- 4.4.5 Technological collaborations
- 4.5 Competitive positioning matrix
- 4.5.1 Market leaders
- 4.5.2 Emerging players
- 4.5.3 Innovators
- 4.5.4 Niche players
- 4.6 Strategic dashboard
Chapter 5 Market Estimates & Forecast, By Form, 2021-2034 (USD Billion) (Kilo Tons)
- 5.1 Key trends
- 5.2 Powder
- 5.3 Granular
- 5.4 Liquid
Chapter 6 Market Estimates & Forecast, By Purity Level, 2021-2034 (USD Billion) (Kilo Tons)
- 6.1 Key trends
- 6.2 High purity (=>99%)
- 6.3 Standard purity (95-98%)
- 6.4 Others
Chapter 7 Market Estimates & Forecast, By Application, 2021-2034 (USD Billion) (Kilo Tons)
- 7.1 Key trends
- 7.2 Food and beverages
- 7.2.1 Bakery & confectionery
- 7.2.2 Beverages
- 7.2.3 Dairy products
- 7.2.4 Frozen desserts
- 7.2.5 Others
- 7.3 Pharmaceutical
- 7.3.1 Tablets & capsules
- 7.3.2 Syrups & suspensions
- 7.3.3 Others
- 7.4 Personal care and cosmetics
- 7.4.1 Oral care products
- 7.4.2 Skin care products
- 7.4.3 Others
- 7.5 Others
- 7.5.1 Agricultural applications
- 7.5.2 Industrial uses
Chapter 8 Market Estimates & Forecast, By Region, 2021-2034 (USD Billion) (Kilo Tons)
- 8.1 Key trends
- 8.2 North America
- 8.2.1 U.S.
- 8.2.2 Canada
- 8.2.3 Mexico
- 8.3 Europe
- 8.3.1 UK
- 8.3.2 Germany
- 8.3.3 France
- 8.3.4 Italy
- 8.3.5 Spain
- 8.3.6 Russia
- 8.4 Asia Pacific
- 8.4.1 China
- 8.4.2 India
- 8.4.3 Japan
- 8.4.4 South Korea
- 8.4.5 Australia
- 8.5 Latin America
- 8.5.1 Brazil
- 8.5.2 Argentina
- 8.6 MEA
- 8.6.1 South Africa
- 8.6.2 Saudi Arabia
- 8.6.3 UAE
Chapter 9 Company Profiles
- 9.1 Baolingbao Biology Co., Ltd.
- 9.2 Cargill, Inc.
- 9.3 Changzhou Niutang Chemical Plant Co., Ltd.
- 9.4 Foodchem International Corporation
- 9.5 Futaste Co., Ltd.
- 9.6 Ingredion Incorporated
- 9.7 Jungbunzlauer Suisse AG
- 9.8 Mitsubishi Chemical Group Corporation
- 9.9 Nikken Chemical Co., Ltd.
- 9.10 RAJVI ENTERPRISE
- 9.11 Shandong Sanyuan Biotechnology Co., Ltd.
- 9.12 Tate & Lyle PLC
- 9.13 Xiwang Group
- 9.14 Zibo ZhongShi GeRui Biotech Co., Ltd.
- 発行日
- 発行
- Global Market Insights Inc.
- ページ情報
- 英文 165 Pages
- 納期
- 2~3営業日