|
|
市場調査レポート
商品コード
1349460
半導体製造材料の世界市場 (2016-2030年):材料タイプ・半導体タイプ・エンドユーザー・地域別の機会と予測Semiconductor Fabrication Materials Market Assessment, By Material Type, By Semiconductor type, By End-user, By Region, Opportunities, and Forecast, 2016-2030F |
||||||
|
|
|||||||
カスタマイズ可能
|
|||||||


| 半導体製造材料の世界市場 (2016-2030年):材料タイプ・半導体タイプ・エンドユーザー・地域別の機会と予測 |
|
出版日: 2023年09月18日
発行: Markets & Data
ページ情報: 英文 125 Pages
納期: 3~5営業日
|

- 全表示
- 概要
- 図表
- 目次
世界の半導体製造材料の市場規模は、2022年の587億米ドルから、予測期間中は7.1%のCAGRで推移し、2030年には1,016億米ドルに成長すると予測されています。
同市場の成長は、スマートフォン、タブレット、ラップトップ、ウェアラブルガジェットなどの広範なデバイスが含まれるCE製品への需要の高まりなどによって推進されています。消費者の嗜好がより高い出力と高度な機能を備えたデバイスに傾く中で、半導体産業は、競争力のある材料を組み込むことによる需要の増加を経験しています。
さらに、データセンターの急拡大とクラウドコンピューティングの普及も半導体製造材料の需要をさらに高めています。クラウドベースのサービスが急増し、IoTが広く統合されたことで、高い運用効率を確保しながら、より大きなデータ量を巧みに管理できる半導体が要求されるようになっています。
また、自動車部門では、電気自動車、自動運転技術、相互接続機能の出現を特徴とする急速な変革期を迎えており、これらの変化により、複雑な要求に対応できる半導体ソリューションが必要とされるようになっています。また、さまざまな分野でのAIおよび機械学習の成長も半導体製造材料市場の極めて重要な促進要因となっています。
当レポートでは、世界の半導体製造材料の市場を調査し、市場の定義と概要、市場規模の推移・予測、各種区分・地域別の詳細分析、産業構造、市場成長への影響因子の分析、ケーススタディ、競合情勢、主要企業のプロファイルなどをまとめています。
目次
第1章 調査手法
第2章 プロジェクトの範囲と定義
第3章 COVID-19による半導体製造材料市場への影響
第4章 ロシア・ウクライナ戦争の影響
第5章 エグゼクティブサマリー
第6章 顧客の声
- 市場認識と製品情報
- ブランドの認知度とロイヤルティ
- 購入決定時に考慮される要素
- 購入頻度
- 購入媒体
第7章 半導体製造材料市場の展望
- 市場規模・予測
- 材料タイプ別
- シリコンウエハ
- ウェットケミカル
- CMPスラリーおよびパッド
- フォトマスク
- フォトレジストおよびフォトレジスト付属品
- 産業用ガス
- スパッタターゲット
- 静電チャック
- ICリードフレーム
- その他
- 半導体タイプ別
- n型
- p型
- エンドユーザー別
- 電気・電子
- エネルギー・電力
- 医療機器
- 輸送
- 通信
- その他
- 地域別
- 北米
- 欧州
- 南米
- アジア太平洋
- 中東・アフリカ
第8章 半導体製造材料市場の展望:地域別
- 北米
- 欧州
- 南米
- アジア太平洋
- 中東・アフリカ
第9章 供給サイドの分析
- 製造能力:企業別
- 製造量:企業別
- 稼働効率:企業別
- 主要工場の所在地(最大25カ所)
第10章 市場マッピング
- 材料の種類別
- 半導体の種類別
- エンドユーザー別
- 地域別
第11章 マクロ環境と産業構造
- 需給分析
- 輸出入分析:数量・金額
- サプライ/バリューチェーン分析
- PESTEL分析
- ポーターのファイブフォース分析
第12章 市場力学
- 成長促進因子
- 成長抑制因子 (課題・制約)
第13章 主要企業の情勢
- 市場リーダー上位5社の競合マトリックス
- 市場リーダー上位5社の市場収益分析
- M&A・ジョイントベンチャー (該当する場合)
- SWOT分析 (参入5社)
- 特許分析 (該当する場合)
第14章 価格分析
第15章 ケーススタディ
第16章 主要企業の見通し
- DuPont de Nemours, Inc.
- Air Liquide S.A.
- Air Products and Chemicals, Inc.
- JSR Corporation
- Honeywell International, Inc.
- Sumco Corporation
- Nippon Sanso Holdings Corporation
- Tokyo Ohka Kogyo America, Inc.
- BASF SE
- Photronics, Inc.
第17章 戦略的提言
第18章 当社について・免責事項
List of Tables
- Table 1. Pricing Analysis of Products from Key Players
- Table 2. Competition Matrix of Top 5 Market Leaders
- Table 3. Mergers & Acquisitions/ Joint Ventures (If Applicable)
- Table 4. About Us - Regions and Countries Where We Have Executed Client Projects
List of Figures
- Figure 1. Global Semiconductor Fabrication Material Market, By Value, in USD Billion, 2016-2030F
- Figure 2. Global Semiconductor Fabrication Material Market, By Volume, in Tons, 2016-2030F
- Figure 3. Global Semiconductor Fabrication Material Market Share, By Material Type, in USD Billion, 2016-2030F
- Figure 4. Global Semiconductor Fabrication Material Market Share, By Semiconductor Type, in USD Billion, 2016-2030F
- Figure 5. Global Semiconductor Fabrication Material Market Share, By End User, in USD Billion, 2016-2030F
- Figure 6. Global Semiconductor Fabrication Material Market Share, By Region, in USD Billion, 2016-2030F
- Figure 7. North America Semiconductor Fabrication Material Market, By Value, in USD Billion, 2016-2030F
- Figure 8. North America Semiconductor Fabrication Material Market, By Volume, in Tons, 2016-2030F
- Figure 9. North America Semiconductor Fabrication Material Market Share, By Material Type, in USD Billion, 2016-2030F
- Figure 10. North America Semiconductor Fabrication Material Market Share, By Semiconductor Type, in USD Billion, 2016-2030F
- Figure 11. North America Semiconductor Fabrication Material Market Share, By End User, in USD Billion, 2016-2030F
- Figure 12. North America Semiconductor Fabrication Material Market Share, By Country, in USD Billion, 2016-2030F
- Figure 13. United States Semiconductor Fabrication Material Market, By Value, in USD Billion, 2016-2030F
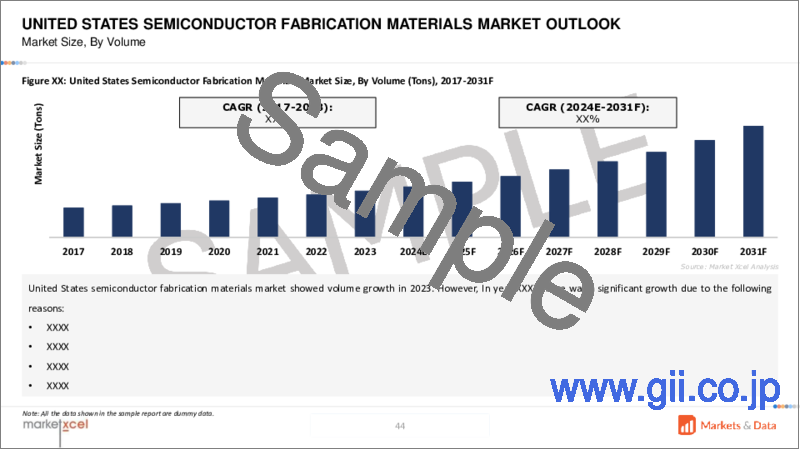
- Figure 14. United States Semiconductor Fabrication Material Market, By Volume, in Tons, 2016-2030F
- Figure 15. United States Semiconductor Fabrication Material Market Share, By Material Type, in USD Billion, 2016-2030F
- Figure 16. United States Semiconductor Fabrication Material Market Share, By Semiconductor Type, in USD Billion, 2016-2030F
- Figure 17. United States Semiconductor Fabrication Material Market Share, By End User, in USD Billion, 2016-2030F
- Figure 18. Canada Semiconductor Fabrication Material Market, By Value, in USD Billion, 2016-2030F
- Figure 19. Canada Semiconductor Fabrication Material Market, By Volume, in Tons, 2016-2030F
- Figure 20. Canada Semiconductor Fabrication Material Market Share, By Material Type, in USD Billion, 2016-2030F
- Figure 21. Canada Semiconductor Fabrication Material Market Share, By Semiconductor Type, in USD Billion, 2016-2030F
- Figure 22. Canada Semiconductor Fabrication Material Market Share, By End User, in USD Billion, 2016-2030F
- Figure 23. Mexico Semiconductor Fabrication Material Market, By Value, in USD Billion, 2016-2030F
- Figure 24. Mexico Semiconductor Fabrication Material Market, By Volume, in Tons, 2016-2030F
- Figure 25. Mexico Semiconductor Fabrication Material Market Share, By Material Type, in USD Billion, 2016-2030F
- Figure 26. Mexico Semiconductor Fabrication Material Market Share, By Semiconductor Type, in USD Billion, 2016-2030F
- Figure 27. Mexico Semiconductor Fabrication Material Market Share, By End User, in USD Billion, 2016-2030F
- Figure 28. Europe Semiconductor Fabrication Material Market, By Value, in USD Billion, 2016-2030F
- Figure 29. Europe Semiconductor Fabrication Material Market, By Volume, in Tons, 2016-2030F
- Figure 30. Europe Semiconductor Fabrication Material Market Share, By Material Type, in USD Billion, 2016-2030F
- Figure 31. Europe Semiconductor Fabrication Material Market Share, By Semiconductor Type, in USD Billion, 2016-2030F
- Figure 32. Europe Semiconductor Fabrication Material Market Share, By End User, in USD Billion, 2016-2030F
- Figure 33. Europe Semiconductor Fabrication Material Market Share, By Country, in USD Billion, 2016-2030F
- Figure 34. Germany Semiconductor Fabrication Material Market, By Value, in USD Billion, 2016-2030F
- Figure 35. Germany Semiconductor Fabrication Material Market, By Volume, in Tons, 2016-2030F
- Figure 36. Germany Semiconductor Fabrication Material Market Share, By Material Type, in USD Billion, 2016-2030F
- Figure 37. Germany Semiconductor Fabrication Material Market Share, By Semiconductor Type, in USD Billion, 2016-2030F
- Figure 38. Germany Semiconductor Fabrication Material Market Share, By End User, in USD Billion, 2016-2030F
- Figure 39. France Semiconductor Fabrication Material Market, By Value, in USD Billion, 2016-2030F
- Figure 40. France Semiconductor Fabrication Material Market, By Volume, in Tons, 2016-2030F
- Figure 41. France Semiconductor Fabrication Material Market Share, By Material Type, in USD Billion, 2016-2030F
- Figure 42. France Semiconductor Fabrication Material Market Share, By Semiconductor Type, in USD Billion, 2016-2030F
- Figure 43. France Semiconductor Fabrication Material Market Share, By End User, in USD Billion, 2016-2030F
- Figure 44. Italy Semiconductor Fabrication Material Market, By Value, in USD Billion, 2016-2030F
- Figure 45. Italy Semiconductor Fabrication Material Market, By Volume, in Tons, 2016-2030F
- Figure 46. Italy Semiconductor Fabrication Material Market Share, By Material Type, in USD Billion, 2016-2030F
- Figure 47. Italy Semiconductor Fabrication Material Market Share, By Semiconductor Type, in USD Billion, 2016-2030F
- Figure 48. Italy Semiconductor Fabrication Material Market Share, By End User, in USD Billion, 2016-2030F
- Figure 49. United Kingdom Semiconductor Fabrication Material Market, By Value, in USD Billion, 2016-2030F
- Figure 50. United Kingdom Semiconductor Fabrication Material Market, By Volume, in Tons, 2016-2030F
- Figure 51. United Kingdom Semiconductor Fabrication Material Market Share, By Material Type, in USD Billion, 2016-2030F
- Figure 52. United Kingdom Semiconductor Fabrication Material Market Share, By Semiconductor Type, in USD Billion, 2016-2030F
- Figure 53. United Kingdom Semiconductor Fabrication Material Market Share, By End User, in USD Billion, 2016-2030F
- Figure 54. Russia Semiconductor Fabrication Material Market, By Value, in USD Billion, 2016-2030F
- Figure 55. Russia Semiconductor Fabrication Material Market, By Volume, in Tons, 2016-2030F
- Figure 56. Russia Semiconductor Fabrication Material Market Share, By Material Type, in USD Billion, 2016-2030F
- Figure 57. Russia Semiconductor Fabrication Material Market Share, By Semiconductor Type, in USD Billion, 2016-2030F
- Figure 58. Russia Semiconductor Fabrication Material Market Share, By End User, in USD Billion, 2016-2030F
- Figure 59. Netherlands Semiconductor Fabrication Material Market, By Value, in USD Billion, 2016-2030F
- Figure 60. Netherlands Semiconductor Fabrication Material Market, By Volume, in Tons, 2016-2030F
- Figure 61. Netherlands Semiconductor Fabrication Material Market Share, By Material Type, in USD Billion, 2016-2030F
- Figure 62. Netherlands Semiconductor Fabrication Material Market Share, By Semiconductor Type, in USD Billion, 2016-2030F
- Figure 63. Netherlands Semiconductor Fabrication Material Market Share, By End User, in USD Billion, 2016-2030F
- Figure 64. Market, By Value, in USD Billion, 2016-2030F
- Figure 65. Spain Semiconductor Fabrication Material Market, By Volume, in Tons, 2016-2030F
- Figure 66. Spain Semiconductor Fabrication Material Market Share, By Material Type, in USD Billion, 2016-2030F
- Figure 67. Spain Semiconductor Fabrication Material Market Share, By Semiconductor Type, in USD Billion, 2016-2030F
- Figure 68. Spain Semiconductor Fabrication Material Market Share, By End User, in USD Billion, 2016-2030F
- Figure 69. Turkey Semiconductor Fabrication Material Market, By Value, in USD Billion, 2016-2030F
- Figure 70. Turkey Semiconductor Fabrication Material Market, By Volume, in Tons, 2016-2030F
- Figure 71. Turkey Semiconductor Fabrication Material Market Share, By Material Type, in USD Billion, 2016-2030F
- Figure 72. Turkey Semiconductor Fabrication Material Market Share, By Semiconductor Type, in USD Billion, 2016-2030F
- Figure 73. Turkey Semiconductor Fabrication Material Market Share, By End User, in USD Billion, 2016-2030F
- Figure 74. Poland Semiconductor Fabrication Material Market, By Value, in USD Billion, 2016-2030F
- Figure 75. Poland Semiconductor Fabrication Material Market, By Volume, in Tons, 2016-2030F
- Figure 76. Poland Semiconductor Fabrication Material Market Share, By Material Type, in USD Billion, 2016-2030F
- Figure 77. Poland Semiconductor Fabrication Material Market Share, By Semiconductor Type, in USD Billion, 2016-2030F
- Figure 78. Poland Semiconductor Fabrication Material Market Share, By End User, in USD Billion, 2016-2030F
- Figure 79. South America Semiconductor Fabrication Material Market, By Value, in USD Billion, 2016-2030F
- Figure 80. South America Semiconductor Fabrication Material Market, By Volume, in Tons, 2016-2030F
- Figure 81. South America Semiconductor Fabrication Material Market Share, By Material Type, in USD Billion, 2016-2030F
- Figure 82. South America Semiconductor Fabrication Material Market Share, By Semiconductor Type, in USD Billion, 2016-2030F
- Figure 83. South America Semiconductor Fabrication Material Market Share, By End User, in USD Billion, 2016-2030F
- Figure 84. South America Semiconductor Fabrication Material Market Share, By Country, in USD Billion, 2016-2030F
- Figure 85. Brazil Semiconductor Fabrication Material Market, By Value, in USD Billion, 2016-2030F
- Figure 86. Brazil Semiconductor Fabrication Material Market, By Volume, in Tons, 2016-2030F
- Figure 87. Brazil Semiconductor Fabrication Material Market Share, By Material Type, in USD Billion, 2016-2030F
- Figure 88. Brazil Semiconductor Fabrication Material Market Share, By Semiconductor Type, in USD Billion, 2016-2030F
- Figure 89. Brazil Semiconductor Fabrication Material Market Share, By End User, in USD Billion, 2016-2030F
- Figure 90. Argentina Semiconductor Fabrication Material Market, By Value, in USD Billion, 2016-2030F
- Figure 91. Argentina Semiconductor Fabrication Material Market, By Volume, in Tons, 2016-2030F
- Figure 92. Argentina Semiconductor Fabrication Material Market Share, By Material Type, in USD Billion, 2016-2030F
- Figure 93. Argentina Semiconductor Fabrication Material Market Share, By Semiconductor Type, in USD Billion, 2016-2030F
- Figure 94. Argentina Semiconductor Fabrication Material Market Share, By End User, in USD Billion, 2016-2030F
- Figure 95. Asia-Pacific Semiconductor Fabrication Material Market, By Value, in USD Billion, 2016-2030F
- Figure 96. Asia-Pacific Semiconductor Fabrication Material Market, By Volume, in Tons, 2016-2030F
- Figure 97. Asia-Pacific Semiconductor Fabrication Material Market Share, By Material Type, in USD Billion, 2016-2030F
- Figure 98. Asia-Pacific Semiconductor Fabrication Material Market Share, By Semiconductor Type, in USD Billion, 2016-2030F
- Figure 99. Asia-Pacific Semiconductor Fabrication Material Market Share, By End User, in USD Billion, 2016-2030F
- Figure 100. Asia-Pacific Semiconductor Fabrication Material Market Share, By Country, in USD Billion, 2016-2030F
- Figure 101. India Semiconductor Fabrication Material Market, By Value, in USD Billion, 2016-2030F
- Figure 102. India Semiconductor Fabrication Material Market, By Volume, in Tons, 2016-2030F
- Figure 103. India Semiconductor Fabrication Material Market Share, By Material Type, in USD Billion, 2016-2030F
- Figure 104. India Semiconductor Fabrication Material Market Share, By Semiconductor Type, in USD Billion, 2016-2030F
- Figure 105. India Semiconductor Fabrication Material Market Share, By End User, in USD Billion, 2016-2030F
- Figure 106. China Semiconductor Fabrication Material Market, By Value, in USD Billion, 2016-2030F
- Figure 107. China Semiconductor Fabrication Material Market, By Volume, in Tons, 2016-2030F
- Figure 108. China Semiconductor Fabrication Material Market Share, By Material Type, in USD Billion, 2016-2030F
- Figure 109. China Semiconductor Fabrication Material Market Share, By Semiconductor Type, in USD Billion, 2016-2030F
- Figure 110. China Semiconductor Fabrication Material Market Share, By End User, in USD Billion, 2016-2030F
- Figure 111. Japan Semiconductor Fabrication Material Market, By Value, in USD Billion, 2016-2030F
- Figure 112. Japan Semiconductor Fabrication Material Market, By Volume, in Tons, 2016-2030F
- Figure 113. Japan Semiconductor Fabrication Material Market Share, By Material Type, in USD Billion, 2016-2030F
- Figure 114. Japan Semiconductor Fabrication Material Market Share, By Semiconductor Type, in USD Billion, 2016-2030F
- Figure 115. Japan Semiconductor Fabrication Material Market Share, By End User, in USD Billion, 2016-2030F
- Figure 116. Australia Semiconductor Fabrication Material Market, By Value, in USD Billion, 2016-2030F
- Figure 117. Australia Semiconductor Fabrication Material Market, By Volume, in Tons, 2016-2030F
- Figure 118. Australia Semiconductor Fabrication Material Market Share, By Material Type, in USD Billion, 2016-2030F
- Figure 119. Australia Semiconductor Fabrication Material Market Share, By Semiconductor Type, in USD Billion, 2016-2030F
- Figure 120. Australia Semiconductor Fabrication Material Market Share, By End User, in USD Billion, 2016-2030F
- Figure 121. Vietnam Semiconductor Fabrication Material Market, By Value, in USD Billion, 2016-2030F
- Figure 122. Vietnam Semiconductor Fabrication Material Market, By Volume, in Tons, 2016-2030F
- Figure 123. Vietnam Semiconductor Fabrication Material Market Share, By Material Type, in USD Billion, 2016-2030F
- Figure 124. Vietnam Semiconductor Fabrication Material Market Share, By Semiconductor Type, in USD Billion, 2016-2030F
- Figure 125. Vietnam Semiconductor Fabrication Material Market Share, By End User, in USD Billion, 2016-2030F
- Figure 126. South Korea Semiconductor Fabrication Material Market, By Value, in USD Billion, 2016-2030F
- Figure 127. South Korea Semiconductor Fabrication Material Market, By Volume, in Tons, 2016-2030F
- Figure 128. South Korea Semiconductor Fabrication Material Market Share, By Material Type, in USD Billion, 2016-2030F
- Figure 129. South Korea Semiconductor Fabrication Material Market Share, By Semiconductor Type, in USD Billion, 2016-2030F
- Figure 130. South Korea Semiconductor Fabrication Material Market Share, By End User, in USD Billion, 2016-2030F
- Figure 131. Indonesia Semiconductor Fabrication Material Market, By Value, in USD Billion, 2016-2030F
- Figure 132. Indonesia Semiconductor Fabrication Material Market, By Volume, in Tons, 2016-2030F
- Figure 133. Indonesia Semiconductor Fabrication Material Market Share, By Material Type, in USD Billion, 2016-2030F
- Figure 134. Indonesia Semiconductor Fabrication Material Market Share, By Semiconductor Type, in USD Billion, 2016-2030F
- Figure 135. Indonesia Semiconductor Fabrication Material Market Share, By End User, in USD Billion, 2016-2030F
- Figure 136. Philippines Semiconductor Fabrication Material Market, By Value, in USD Billion, 2016-2030F
- Figure 137. Philippines Semiconductor Fabrication Material Market, By Volume, in Tons, 2016-2030F
- Figure 138. Philippines Semiconductor Fabrication Material Market Share, By Material Type, in USD Billion, 2016-2030F
- Figure 139. Philippines Semiconductor Fabrication Material Market Share, By Semiconductor Type, in USD Billion, 2016-2030F
- Figure 140. Philippines Semiconductor Fabrication Material Market Share, By End User, in USD Billion, 2016-2030F
- Figure 141. Middle East & Africa Semiconductor Fabrication Material Market, By Value, in USD Billion, 2016-2030F
- Figure 142. Middle East & Africa Semiconductor Fabrication Material Market, By Volume, in Tons, 2016-2030F
- Figure 143. Middle East & Africa Semiconductor Fabrication Material Market Share, By Material Type, in USD Billion, 2016-2030F
- Figure 144. Middle East & Africa Semiconductor Fabrication Material Market Share, By Semiconductor Type, in USD Billion, 2016-2030F
- Figure 145. Middle East & Africa Semiconductor Fabrication Material Market Share, By End User, in USD Billion, 2016-2030F
- Figure 146. Middle East & Africa Semiconductor Fabrication Material Market Share, By Country, in USD Billion, 2016-2030F
- Figure 147. Saudi Arabia Semiconductor Fabrication Material Market, By Value, in USD Billion, 2016-2030F
- Figure 148. Saudi Arabia Semiconductor Fabrication Material Market, By Volume, in Tons, 2016-2030F
- Figure 149. Saudi Arabia Semiconductor Fabrication Material Market Share, By Material Type, in USD Billion, 2016-2030F
- Figure 150. Saudi Arabia Semiconductor Fabrication Material Market Share, By Semiconductor Type, in USD Billion, 2016-2030F
- Figure 151. Saudi Arabia Semiconductor Fabrication Material Market Share, By End User, in USD Billion, 2016-2030F
- Figure 152. UAE Semiconductor Fabrication Material Market, By Value, in USD Billion, 2016-2030F
- Figure 153. UAE Semiconductor Fabrication Material Market, By Volume, in Tons, 2016-2030F
- Figure 154. UAE Semiconductor Fabrication Material Market Share, By Material Type, in USD Billion, 2016-2030F
- Figure 155. UAE Semiconductor Fabrication Material Market Share, By Semiconductor Type, in USD Billion, 2016-2030F
- Figure 156. UAE Semiconductor Fabrication Material Market Share, By End User, in USD Billion, 2016-2030F
- Figure 157. South Africa Semiconductor Fabrication Material Market, By Value, in USD Billion, 2016-2030F
- Figure 158. South Africa Semiconductor Fabrication Material Market, By Volume, in Tons, 2016-2030F
- Figure 159. South Africa Semiconductor Fabrication Material Market Share, By Material Type, in USD Billion, 2016-2030F
- Figure 160. South Africa Semiconductor Fabrication Material Market Share, By Semiconductor Type, in USD Billion, 2016-2030F
- Figure 161. South Africa Semiconductor Fabrication Material Market Share, By End User, in USD Billion, 2016-2030F
- Figure 162. By Material Type Map-Market Size (USD Billion) & Growth Rate (%), 2022
- Figure 163. By Semiconductor Type Map-Market Size (USD Billion) & Growth Rate (%), 2022
- Figure 164. By End User Map-Market Size (USD Billion) & Growth Rate (%), 2022
- Figure 165. By Region Map-Market Size (USD Billion) & Growth Rate (%), 2022
Global semiconductor fabrication materials market size was valued at USD 58.7 billion in 2022, which is expected to grow to USD 101.6 billion in 2030, with a CAGR of 7.1% during the forecast period between, 2023 and 2030. The growth trajectory of the semiconductor fabrication materials market is influenced by drivers such as the rising demand for consumer electronics, which encompasses a wide spectrum of devices like smartphones, tablets, laptops, and wearable gadgets. As consumer preferences pivot towards devices imbued with heightened power and advanced functionalities, the semiconductor industry witnesses an increase in demand due to the incorporation of competitive materials.
Concurrently, the surging expansion of data centers and the proliferation of cloud computing further raises the demand for semiconductor fabrication materials. Also, due to the surge in cloud-based services and the pervasive integration of the Internet of Things (IoT) mandated semiconductors that can adeptly manage larger data volumes while ensuring elevated operational efficiency.
Furthermore, the automotive sector is undergoing a rapid transformation characterized by the emergence of electric vehicles, autonomous driving technologies and interconnected features. This change in basic assumptions necessitates a new era of semiconductor solutions capable of accommodating the intricate demands of modern vehicles. Similarly, the increasing prominence of artificial intelligence (AI) and machine learning application spanning across various sectors, serves as another pivotal driver in the semiconductor fabrication materials market.
Strong Demand for Consumer Electronics to Drive the Market
The growing consumer appetite for electronic devices spanning various categories including smartphones, tablets, laptops, and wearable technologies serves as a pivotal driver behind the escalating demand for intricately engineered semiconductor fabrication materials. As consumers continue to exhibit an ever-heightened inclination towards devices with better power, enriched features, and flawless interconnectivity, the semiconductor industry is paramount in orchestrating a responsive course of action.
For instance, according to the Appliances and Consumer Electronics (ACE) industry body CEAMA, in 2022, the industry observed a notable surge of 35%, attributed to enhanced sales within the cooling product sector. An upswing in the sales of mid-range and premium electronic devices in India notably fortified this growth. This heightened sales trajectory is anticipated to sustain its momentum over the forecast period, consequently leading to a robust and sustained demand for materials used in the fabrication of semiconductors.
Application of Semiconductors in Artificial Intelligence and Machine Learning
The expanding prevalence of AI and machine learning applications accentuates the growing reliance on advanced semiconductor fabrication materials. These materials are pivotal in supporting the intricate processors and memory technologies that are the backbone of AI and machine learning functionalities. This dependence is particularly salient across a wide array of industries, ranging from healthcare to finance, where the integration of AI and machine learning is becoming increasingly indispensable, reshaping decision-making processes, and predictive capabilities. Given the complexity of these specialized processors and memory technologies, a concurrent demand arises for sophisticated semiconductor fabrication materials, which serve as the foundational building blocks for the meticulous engineering of these crucial components.
For instance, using AI-powered chips within autonomous vehicles equipping them with the ability to assess their environment and make instantaneous decisions swiftly. Similarly, within the healthcare sector, AI-powered chips are finding application in real-time patient monitoring and the timely detection of potential health anomalies. These expanding applications of AI technology serve as a compelling driver propelling the requirement for advanced semiconductor fabrication materials globally.
Growing Automotive Sector Rises the Demand for Semiconductor
A shift towards greater connectivity, autonomy, and electrification marks the evolving landscape of modern vehicles. This transformation necessitates semiconductor components that deliver high performance and endure the demanding conditions inherent to automotive environments. Consequently, the automotive sector is emerging as a significant driver in the global demand for semiconductor fabrication materials.
For instance, the Federation of Automobile Dealers Associations disclosed that retail sales for 2022 reached an impressive 2.21 crore vehicles. Notably, the automobile sector experienced a significant year-on-year volume increase, with a notable surge of 15.28%, compared to the 1,83,21,760 units sold in 2021. This global increase in vehicle sold raises the requirement for semiconductors, increasing demand for global semiconductor fabrication materials.
Impact of COVID-19
The global semiconductor fabrication materials market experienced a dual impact from the COVID-19 pandemic. It encountered hurdles from supply shortages, varying demand patterns, and logistical challenges. Industries, like automotive, were adversely affected due to the market restrictions, which reduced the global demand for semiconductor fabrication materials. Moreover, the constrained supply of raw materials further weakened the market's supply side.
Conversely, the semiconductor fabrication materials market saw positive effects, driven by heightened demand from sectors such as the electronic sector. The rise in remote work, telemedicine, and online services increased demand for data centers and related infrastructure, influencing the market for semiconductor materials.
Impact of Russia-Ukraine War
The ongoing conflict between Russia and Ukraine has severe impact on the semiconductor fabrication materials market as both countries were major manufacturers of raw materials for semiconductors. Ukraine occupied a crucial position as a vital source and supplier of essential raw materials. Notably, it exported semiconductor-grade neon, a critical component employed in semiconductor manufacturing processes. Similarly, Russia's significance stems from being a primary source of palladium, a pivotal material used extensively in memory and sensor chips. Russia accounts for a substantial 45 percent share of the global palladium supply. Therefore, the war between Ukraine and Russia has significantly disrupted the global semiconductor supply chains.
Key Players Landscape and Outlook
Prominent manufacturers of semiconductor fabrication materials are expanding their operations in key semiconductor manufacturing hubs. This strategic expansion is undertaken with the objective of effectively catering to the escalating global demand for semiconductor fabrication material.
For instance, Air Liquide is committing a substantial investment of approx. USD 200 million to establish expansive production facilities across Taiwan and South Korea, anticipated to commence operations in 2024 and 2025 respectively, these facilities have been meticulously situated in proximity to key strategic clientele.
On a global level, the semiconductor fabrication materials market displays a positive outlook shaped by the progress in downstream sectors. The relentless pursuit of technological advancement, combined with the escalating demand for high-performance electronics across sectors like consumer electronics, automotive, and data centers, emphasizes a steady market growth. The integration of innovative materials and innovative manufacturing processes aligns with the evolving landscape of semiconductor technology as AI, machine learning, and other emerging technologies assume greater significance further strengthening the market's outlook.
Table of Contents
1. Research Methodology
2. Project Scope & Definitions
3. Impact of COVID-19 on Semiconductor Fabrication Materials Market
4. Impact of Russia-Ukraine War
5. Executive Summary
6. Voice of Customer
- 6.1. Market Awareness and Product Information
- 6.2. Brand Awareness and Loyalty
- 6.3. Factors Considered in Purchase Decision
- 6.3.1. Brand Name
- 6.3.2. Quality
- 6.3.3. Quantity
- 6.3.4. Price
- 6.3.5. Product Specification
- 6.3.6. Application Specification
- 6.3.7. VOC/Toxicity Content
- 6.3.8. Availability of Product
- 6.4. Frequency of Purchase
- 6.5. Medium of Purchase
7. Semiconductor Fabrication Material Market Outlook, 2016-2030F
- 7.1. Market Size & Forecast
- 7.1.1. By Value
- 7.1.2. By Volume
- 7.2. By Material Type
- 7.2.1. Silicon wafers
- 7.2.2. Wet Chemicals
- 7.2.3. CMP slurry and pads
- 7.2.4. Photomasks
- 7.2.5. Photoresist and Photoresist ancillaries
- 7.2.6. Industrial Gases
- 7.2.6.1. Argon
- 7.2.6.2. Helium
- 7.2.6.3. Rare Gases
- 7.2.6.4. Others
- 7.2.7. Sputter targets
- 7.2.8. Electrostatic chunks
- 7.2.9. IC lead frame
- 7.2.10. Others
- 7.3. By Semiconductor type
- 7.3.1. n-type
- 7.3.2. p-type
- 7.4. By End-user
- 7.4.1. Electrical and Electronics
- 7.4.1.1. Consumer Electronics
- 7.4.1.2. Appliances
- 7.4.1.3. Others
- 7.4.2. Energy and Power
- 7.4.3. Medical devices
- 7.4.4. Transportation
- 7.4.4.1. Automotive
- 7.4.4.2. Marine
- 7.4.4.3. Aerospace
- 7.4.4.4. Others
- 7.4.5. Telecommunication
- 7.4.6. Others
- 7.4.1. Electrical and Electronics
- 7.5. By Region
- 7.5.1. North America
- 7.5.2. Europe
- 7.5.3. South America
- 7.5.4. Asia-Pacific
- 7.5.5. Middle East and Africa
8. Semiconductor Fabrication Material Market Outlook, By Region, 2016-2030F
- 8.1. North America*
- 8.1.1. By Material Type
- 8.1.1.1. Silicon wafers
- 8.1.1.2. Wet Chemicals
- 8.1.1.3. CMP slurry and pads
- 8.1.1.4. Photomasks
- 8.1.1.5. Photoresist and Photoresist ancillaries
- 8.1.1.6. Industrial Gases
- 8.1.1.6.1. Argon
- 8.1.1.6.2. Helium
- 8.1.1.6.3. Rare Gases
- 8.1.1.6.4. Others
- 8.1.1.7. Sputter targets
- 8.1.1.8. Electrostatic chunks
- 8.1.1.9. IC lead frame
- 8.1.1.10. Others
- 8.1.2. By Semiconductor type
- 8.1.2.1. n-type
- 8.1.2.2. p-type
- 8.1.3. By End-user
- 8.1.3.1. Electrical and Electronics
- 8.1.3.1.1. Consumer Electronics
- 8.1.3.1.2. Appliances
- 8.1.3.1.3. Others
- 8.1.3.2. Energy and Power
- 8.1.3.3. Medical devices
- 8.1.3.4. Transportation
- 8.1.3.4.1. Automotive
- 8.1.3.4.2. Marine
- 8.1.3.4.3. Aerospace
- 8.1.3.4.4. Others
- 8.1.3.5. Telecommunication
- 8.1.3.6. Others
- 8.1.4. United States*
- 8.1.4.1. By Material Type
- 8.1.4.1.1. Silicon wafers
- 8.1.4.1.2. Wet Chemicals
- 8.1.4.1.3. CMP slurry and pads
- 8.1.4.1.4. Photomasks
- 8.1.4.1.5. Photoresist and Photoresist ancillaries
- 8.1.4.1.6. Industrial Gases
- 8.1.4.1.6.1. Argon
- 8.1.4.1.6.2. Helium
- 8.1.4.1.6.3. Rare Gases
- 8.1.4.1.6.4. Others
- 8.1.4.1.7. Sputter targets
- 8.1.4.1.8. Electrostatic chunks
- 8.1.4.1.9. IC lead frame
- 8.1.4.1.10. Others
- 8.1.4.2. By Semiconductor type
- 8.1.4.2.1. n-type
- 8.1.4.2.2. p-type
- 8.1.4.3. By End-user
- 8.1.4.3.1. Electrical and Electronics
- 8.1.4.3.1.1. Consumer Electronics
- 8.1.4.3.1.2. Appliances
- 8.1.4.3.1.3. Others
- 8.1.4.3.2. Energy and Power
- 8.1.4.3.3. Medical devices
- 8.1.4.3.4. Transportation
- 8.1.4.3.4.1. Automotive
- 8.1.4.3.4.2. Marine
- 8.1.4.3.4.3. Aerospace
- 8.1.4.3.4.4. Others
- 8.1.4.3.5. Telecommunication
- 8.1.4.3.6. Others
- 8.1.1. By Material Type
All segments will be provided for all regions and countries covered
- 8.1.5. Canada
- 8.1.6. Mexico
- 8.2. Europe
- 8.2.1. Germany
- 8.2.2. France
- 8.2.3. Italy
- 8.2.4. United Kingdom
- 8.2.5. Russia
- 8.2.6. Netherlands
- 8.2.7. Spain
- 8.2.8. Turkey
- 8.2.9. Poland
- 8.3. South America
- 8.3.1. Brazil
- 8.3.2. Argentina
- 8.4. Asia-Pacific
- 8.4.1. India
- 8.4.2. China
- 8.4.3. Japan
- 8.4.4. Australia
- 8.4.5. Vietnam
- 8.4.6. South Korea
- 8.4.7. Indonesia
- 8.4.8. Philippines
- 8.5. Middle East & Africa
- 8.5.1. Saudi Arabia
- 8.5.2. UAE
- 8.5.3. South Africa
9. Supply Side Analysis
- 9.1. Capacity, By Company
- 9.2. Production, By Company
- 9.3. Operating Efficiency, By Company
- 9.4. Key Plant Locations (Up to 25)
10. Market Mapping, 2022
- 10.1. By Material Type
- 10.2. By Semiconductor Type
- 10.3. By End-user
- 10.4. By Region
11. Macro Environment and Industry Structure
- 11.1. Supply Demand Analysis
- 11.2. Import Export Analysis - Volume and Value
- 11.3. Supply/Value Chain Analysis
- 11.4. PESTEL Analysis
- 11.4.1. Political Factors
- 11.4.2. Economic System
- 11.4.3. Social Implications
- 11.4.4. Technological Advancements
- 11.4.5. Environmental Impacts
- 11.4.6. Legal Compliances and Regulatory Policies (Statutory Bodies Included)
- 11.5. Porter's Five Forces Analysis
- 11.5.1. Supplier Power
- 11.5.2. Buyer Power
- 11.5.3. Substitution Threat
- 11.5.4. Threat from New Entrant
- 11.5.5. Competitive Rivalry
12. Market Dynamics
- 12.1. Growth Drivers
- 12.2. Growth Inhibitors (Challenges, Restraints)
13. Key Players Landscape
- 13.1. Competition Matrix of Top Five Market Leaders
- 13.2. Market Revenue Analysis of Top Five Market Leaders (in %, 2022)
- 13.3. Mergers and Acquisitions/Joint Ventures (If Applicable)
- 13.4. SWOT Analysis (For Five Market Players)
- 13.5. Patent Analysis (If Applicable)
14. Pricing Analysis
15. Case Studies
16. Key Players Outlook
- 16.1. DuPont de Nemours, Inc.
- 16.1.1. Company Details
- 16.1.2. Key Management Personnel
- 16.1.3. Products & Services
- 16.1.4. Financials (As reported)
- 16.1.5. Key Market Focus & Geographical Presence
- 16.1.6. Recent Developments
- 16.2. Air Liquide S.A.
- 16.3. Air Products and Chemicals, Inc.
- 16.4. JSR Corporation
- 16.5. Honeywell International, Inc.
- 16.6. Sumco Corporation
- 16.7. Nippon Sanso Holdings Corporation
- 16.8. Tokyo Ohka Kogyo America, Inc.
- 16.9. BASF SE
- 16.10. Photronics, Inc.
Companies mentioned above DO NOT hold any order as per market share and can be changed as per information available during research work.
