|
|
市場調査レポート
商品コード
1346101
衛星通信の世界市場の評価:コンポーネント別、周波数帯域別、用途別、エンドユーザー別、地域別、機会、予測(2016年~2030年)Satellite Telecommunication Market Assessment, By Component, By Frequency Band, By Application, By End-user, By Region, Opportunities and Forecast, 2016-2030F |
||||||
|
|
|||||||
カスタマイズ可能
|
|||||||


| 衛星通信の世界市場の評価:コンポーネント別、周波数帯域別、用途別、エンドユーザー別、地域別、機会、予測(2016年~2030年) |
|
出版日: 2023年09月08日
発行: Market Xcel - Markets and Data
ページ情報: 英文 142 Pages
納期: 3~5営業日
|

- 全表示
- 概要
- 図表
- 目次
世界の衛星通信の市場規模は、2022年の690億米ドルから2030年に1,610億米ドルに達し、2023年~2030年の予測期間中にCAGRで11.2%の成長が予測されています。
さまざまな産業や地域において、信頼性が高く効率的な通信や接続サービスへの需要が高まっていることにより、市場は安定した成長を示しています。衛星技術の進歩、メガコンステレーション、衛星ベースのアプリケーションの普及が市場拡大に寄与しています。
北米は、政府・軍事、放送・メディア、海事・航空、企業、消費者向けブロードバンドなどのさまざまな部門に牽引され、衛星通信サービスに対する高い需要を持っています。SpaceXのStarlinkやOneWebのような最大規模の衛星メガコンステレーションは、北米の企業によって展開されています。これらの衛星コンステレーションは、世界のブロードバンドインターネットの通信範囲を提供を目的としており、市場に大きな影響を与えると予想されます。
ITUのMeasuring Digital Developmentの報告によると、国際帯域幅の利用は2021年~2022年に急拡大し、約30%の急成長を記録して毎秒932テラビットに達しています。これと並行して、衛星通信(satcom)部門でも、超ハイスループット衛星(UHTS)技術の登場やESIM(Earth Station in Motion)ソリューションの開発など、産業の進化を反映した進歩が見られます。
衛星メガコンステレーションとブロードバンド接続の拡大
デジタルサービス、IoT機器、データ集約型アプリケーションの普及により、特に地上ネットワークが限定されていたり利用できなかったりする遠隔地や未整備の地域では、高速ブロードバンド接続のニーズが急増しています。SpaceX(Starlink)、OneWeb、Amazon(Project Kuiper)のような企業は、低軌道(LEO)衛星の著名なコンステレーションを展開し、世界のブロードバンドインターネットの通信範囲を提供しています。これらのメガコンステレーションは、世界中の接続性とアクセシビリティの大幅な向上を約束します。
例えば、2023年1月、SpaceXは5億5,000万米ドルを投じた取り組みの要となる、インドネシアの強力な通信衛星、SATRIAの打ち上げに成功しました。このプロジェクトの主な目的は、島国全土の学校、医療センター、公共施設、政府庁舎など、さまざまな機関に高速インターネットアクセスを拡大することです。SATRIAプロジェクトは、インドネシア政府と、衛星通信事業者であるPT Pasifik Satellite Nusantara(PSN)が率いるコンソーシアムとの共同事業です。毎秒150ギガバイトという驚異的なスループットを誇るSATRIAは、約94,000の学校、約50,000の村役場、さまざまな政府施設、そして世界で4番目に人口の多い国である広大な群島に点在する数多くの病院や医療施設への接続を確立します。
IoTソリューションの急速な普及が市場の需要曲線に影響
IoTの急速な普及が市場の需要に大きな影響を与えています。IoTの利用が産業全体で増加し続ける中、特に従来の通信インフラが不足している遠隔地や手の届きにくい地域では、信頼性の高い広範な接続性がもっとも重要になります。IoT対応のセンサーやデバイスは、災害管理、環境モニタリング、リモートセンシングにおいて極めて重要です。
衛星は、このような用途に向けて継続的なデータ収集と通信を可能にし、早期警報システムや緊急対応に役立ちます。例えば、2022年11月、米国を拠点とする初の超小型衛星通信企業であるSateliotは、SpaceXのFalcon 9ロケットの打ち上げにより、世界中で5G接続を提供しました。Sateliotの5G衛星ネットワークは、インテリジェントな標準のIoTデバイスを持つ誰もが同社の宇宙ネットワークに接続し、強力でクリアなセルラー信号を受信できるようにすることで、接続性の問題を解決しています。海洋研究者は、シロナガスクジラのような減少しつつある個体群をより手頃な価格でうまくモニタリングできるようになり、絶滅危惧種の保護に役立っています。
当レポートでは、世界の衛星通信市場について調査分析し、市場規模と予測、市場力学、主要企業の情勢と見通しなどを提供しています。
目次
第1章 調査手法
第2章 プロジェクトの範囲と定義
第3章 衛星通信市場に対するCOVID-19の影響
第4章 ロシア・ウクライナ戦争の影響
第5章 エグゼクティブサマリー
第6章 顧客の声
- 人口統計(年齢、地域、収入など)
- 市場の認知度と製品情報
- 製品の品質
- 製品の生涯価値
- ブランドの認知度とロイヤルティ
- 購入決定において考慮される要素
- 購入の目的
第7章 世界の衛星通信市場の見通し(2016年~2030年)
- 市場規模と予測
- 金額
- 数量
- コンポーネント別
- ハードウェア
- ソフトウェア
- サービス
- 周波数帯域別
- Cバンド
- Kuバンド
- Kaバンド
- その他
- 用途別
- 海事・航空
- 軍事・防衛
- IoT・M2M接続
- 農業・環境モニタリング
- その他
- エンドユーザー別
- IT・通信
- 自動車・輸送
- メディア・エンターテインメント
- エネルギー・公共事業
- 石油・ガス
- その他
- 地域別
- 北米
- 欧州
- 南米
- アジア太平洋
- 中東・アフリカ
- 市場シェア:企業別(2022年)
第8章 世界の衛星通信市場の見通し:地域別(2016年~2030年)
- 北米
- 米国
- カナダ
- メキシコ
- 欧州
- ドイツ
- フランス
- イタリア
- 英国
- ロシア
- オランダ
- スペイン
- トルコ
- ポーランド
- 南米
- ブラジル
- アルゼンチン
- アジア太平洋
- インド
- 中国
- 日本
- オーストラリア
- ベトナム
- 韓国
- インドネシア
- フィリピン
- 中東・アフリカ
- サウジアラビア
- アラブ首長国連邦
- 南アフリカ
第9章 市場マッピング(2022年)
- コンポーネント別
- 周波数帯域別
- 用途別
- エンドユーザー別
- 地域別
第10章 マクロ環境と産業構造
- 需給分析
- 輸出入の分析
- バリューチェーン分析
- PESTEL分析
- ポーターのファイブフォース分析
第11章 市場力学
- 成長促進要因
- 成長抑制要因(課題、抑制要因)
第12章 主要企業情勢
- マーケットリーダー上位5社の競合マトリクス
- マーケットリーダー上位5社市場の収益分析(2022年)
- 合併と買収/合弁事業(該当する場合)
- SWOT分析(市場参入企業5社向け)
- 特許分析(該当する場合)
第13章 価格分析
第14章 ケーススタディ
第15章 主要企業の見通し
- SES S.A
- Intelsat US LLC
- EUTELSAT COMMUNICATIONS SA
- Inmarsat Global Limited
- Iridium Communications Inc.
- Viasat Inc.
- China Satellite Communications Co. Ltd.
- Telesat Corporation
- Hispasat, SA.
- Orbcomm LLC
第16章 戦略的推奨事項
第17章 当社について、免責事項
List of Tables
- Table 1. Pricing Analysis of Products from Key Players
- Table 2. Competition Matrix of Top 5 Market Leaders
- Table 3. Mergers & Acquisitions/ Joint Ventures (If Applicable)
- Table 4. About Us - Regions and Countries Where We Have Executed Client Projects
List of Figures
- Figure 1. Global Satellite Telecom Market, By Value, In USD Billion, 2016-2030F
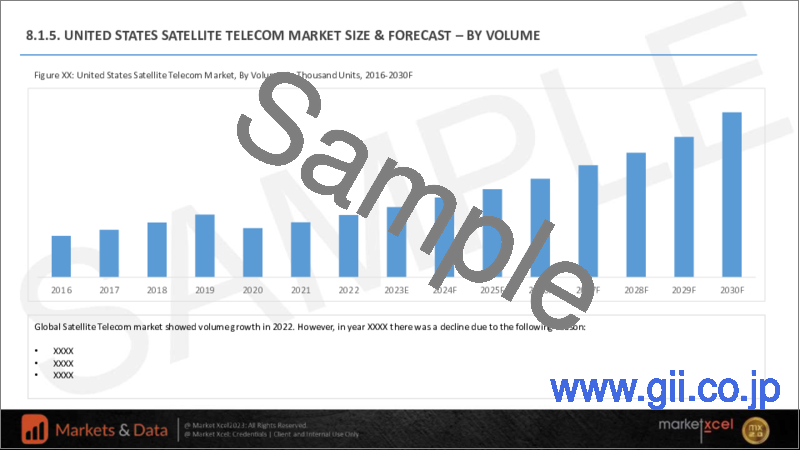
- Figure 2. Global Satellite Telecom Market, By Volume, In Unit Thousand, 2016-2030F
- Figure 3. Global Satellite Telecom Market Share, By Components, In USD Billion, 2016-2030F
- Figure 4. Global Satellite Telecom Market Share, By Frequency Band, In USD Billion, 2016-2030F
- Figure 5. Global Satellite Telecom Market Share, By Application, In USD Billion, 2016-2030F
- Figure 6. Global Satellite Telecom Market Share, By End-User, In USD Billion, 2016-2030F
- Figure 7. Global Satellite Telecom Market Share, By Region, In USD Billion, 2016-2030F
- Figure 8. North America Satellite Telecom Market, By Value, In USD Billion, 2016-2030F
- Figure 9. North America Satellite Telecom Market, By Volume, In Unit Thousand, 2016-2030F
- Figure 10. North America Satellite Telecom Market Share, By Components, In USD Billion, 2016-2030F
- Figure 11. North America Satellite Telecom Market Share, By Frequency Band, In USD Billion, 2016-2030F
- Figure 12. North America Satellite Telecom Market Share, By Application, In USD Billion, 2016-2030F
- Figure 13. North America Satellite Telecom Market Share, By End-User, In USD Billion, 2016-2030F
- Figure 14. North America Satellite Telecom Market Share, By Country, In USD Billion, 2016-2030F
- Figure 15. United States Satellite Telecom Market, By Value, In USD Billion, 2016-2030F
- Figure 16. United States Satellite Telecom Market, By Volume, In Unit Thousand, 2016-2030F
- Figure 17. United States Satellite Telecom Market Share, By Components, In USD Billion, 2016-2030F
- Figure 18. United States Satellite Telecom Market Share, By Frequency Band, In USD Billion, 2016-2030F
- Figure 19. United States Satellite Telecom Market Share, By Application, In USD Billion, 2016-2030F
- Figure 20. United States Satellite Telecom Market Share, By End-User, In USD Billion, 2016-2030F
- Figure 21. Canada Satellite Telecom Market, By Value, In USD Billion, 2016-2030F
- Figure 22. Canada Satellite Telecom Market, By Volume, In Unit Thousand, 2016-2030F
- Figure 23. Canada Satellite Telecom Market Share, By Components, In USD Billion, 2016-2030F
- Figure 24. Canada Satellite Telecom Market Share, By Frequency Band, In USD Billion, 2016-2030F
- Figure 25. Canada Satellite Telecom Market Share, By Application, In USD Billion, 2016-2030F
- Figure 26. Canada Satellite Telecom Market Share, By End-User, In USD Billion, 2016-2030F
- Figure 27. Mexico Satellite Telecom Market, By Value, In USD Billion, 2016-2030F
- Figure 28. Mexico Satellite Telecom Market, By Volume, In Unit Thousand, 2016-2030F
- Figure 29. Mexico Satellite Telecom Market Share, By Components, In USD Billion, 2016-2030F
- Figure 30. Mexico Satellite Telecom Market Share, By Frequency Band, In USD Billion, 2016-2030F
- Figure 31. Mexico Satellite Telecom Market Share, By Application, In USD Billion, 2016-2030F
- Figure 32. Mexico Satellite Telecom Market Share, By End-User, In USD Billion, 2016-2030F
- Figure 33. Europe Satellite Telecom Market, By Value, In USD Billion, 2016-2030F
- Figure 34. Europe Satellite Telecom Market, By Volume, In Unit Thousand, 2016-2030F
- Figure 35. Europe Satellite Telecom Market Share, By Components, In USD Billion, 2016-2030F
- Figure 36. Europe Satellite Telecom Market Share, By Frequency Band, In USD Billion, 2016-2030F
- Figure 37. Europe Satellite Telecom Market Share, By Application, In USD Billion, 2016-2030F
- Figure 38. Europe Satellite Telecom Market Share, By End-User, In USD Billion, 2016-2030F
- Figure 39. Europe Satellite Telecom Market Share, By Country, In USD Billion, 2016-2030F
- Figure 40. Germany Satellite Telecom Market, By Value, In USD Billion, 2016-2030F
- Figure 41. Germany Satellite Telecom Market, By Volume, In Unit Thousand, 2016-2030F
- Figure 42. Germany Satellite Telecom Market Share, By Components, In USD Billion, 2016-2030F
- Figure 43. Germany Satellite Telecom Market Share, By Frequency Band, In USD Billion, 2016-2030F
- Figure 44. Germany Satellite Telecom Market Share, By Application, In USD Billion, 2016-2030F
- Figure 45. Germany Satellite Telecom Market Share, By End-User, In USD Billion, 2016-2030F
- Figure 46. France Satellite Telecom Market, By Value, In USD Billion, 2016-2030F
- Figure 47. France Satellite Telecom Market, By Volume, In Unit Thousand, 2016-2030F
- Figure 48. France Satellite Telecom Market Share, By Components, In USD Billion, 2016-2030F
- Figure 49. France Satellite Telecom Market Share, By Frequency Band, In USD Billion, 2016-2030F
- Figure 50. France Satellite Telecom Market Share, By Application, In USD Billion, 2016-2030F
- Figure 51. France Satellite Telecom Market Share, By End-User, In USD Billion, 2016-2030F
- Figure 52. Italy Satellite Telecom Market, By Value, In USD Billion, 2016-2030F
- Figure 53. Italy Satellite Telecom Market, By Volume, In Unit Thousand, 2016-2030F
- Figure 54. Italy Satellite Telecom Market Share, By Components, In USD Billion, 2016-2030F
- Figure 55. Italy Satellite Telecom Market Share, By Frequency Band, In USD Billion, 2016-2030F
- Figure 56. Italy Satellite Telecom Market Share, By Application, In USD Billion, 2016-2030F
- Figure 57. Italy Satellite Telecom Market Share, By End-User, In USD Billion, 2016-2030F
- Figure 58. United Kingdom Satellite Telecom Market, By Value, In USD Billion, 2016-2030F
- Figure 59. United Kingdom Satellite Telecom Market, By Volume, In Unit Thousand, 2016-2030F
- Figure 60. United Kingdom Satellite Telecom Market Share, By Components, In USD Billion, 2016-2030F
- Figure 61. United Kingdom Satellite Telecom Market Share, By Frequency Band, In USD Billion, 2016-2030F
- Figure 62. United Kingdom Satellite Telecom Market Share, By Application, In USD Billion, 2016-2030F
- Figure 63. United Kingdom Satellite Telecom Market Share, By End-User, In USD Billion, 2016-2030F
- Figure 64. Russia Satellite Telecom Market, By Value, In USD Billion, 2016-2030F
- Figure 65. Russia Satellite Telecom Market, By Volume, In Unit Thousand, 2016-2030F
- Figure 66. Russia Satellite Telecom Market Share, By Components, In USD Billion, 2016-2030F
- Figure 67. Russia Satellite Telecom Market Share, By Frequency Band, In USD Billion, 2016-2030F
- Figure 68. Russia Satellite Telecom Market Share, By Application, In USD Billion, 2016-2030F
- Figure 69. Russia Satellite Telecom Market Share, By End-User, In USD Billion, 2016-2030F
- Figure 70. Netherlands Satellite Telecom Market, By Value, In USD Billion, 2016-2030F
- Figure 71. Netherlands Satellite Telecom Market, By Volume, In Unit Thousand, 2016-2030F
- Figure 72. Netherlands Satellite Telecom Market Share, By Components, In USD Billion, 2016-2030F
- Figure 73. Netherlands Satellite Telecom Market Share, By Frequency Band, In USD Billion, 2016-2030F
- Figure 74. Netherlands Satellite Telecom Market Share, By Application, In USD Billion, 2016-2030F
- Figure 75. Netherlands Satellite Telecom Market Share, By End-User, In USD Billion, 2016-2030F
- Figure 76. Spain Satellite Telecom Market, By Value, In USD Billion, 2016-2030F
- Figure 77. Spain Satellite Telecom Market, By Volume, In Unit Thousand, 2016-2030F
- Figure 78. Spain Satellite Telecom Market Share, By Components, In USD Billion, 2016-2030F
- Figure 79. Spain Satellite Telecom Market Share, By Frequency Band, In USD Billion, 2016-2030F
- Figure 80. Spain Satellite Telecom Market Share, By Application, In USD Billion, 2016-2030F
- Figure 81. Spain Satellite Telecom Market Share, By End-User, In USD Billion, 2016-2030F
- Figure 82. Turkey Satellite Telecom Market, By Value, In USD Billion, 2016-2030F
- Figure 83. Turkey Satellite Telecom Market, By Volume, In Unit Thousand, 2016-2030F
- Figure 84. Turkey Satellite Telecom Market Share, By Components, In USD Billion, 2016-2030F
- Figure 85. Turkey Satellite Telecom Market Share, By Frequency Band, In USD Billion, 2016-2030F
- Figure 86. Turkey Satellite Telecom Market Share, By Application, In USD Billion, 2016-2030F
- Figure 87. Turkey Satellite Telecom Market Share, By End-User, In USD Billion, 2016-2030F
- Figure 88. Poland Satellite Telecom Market, By Value, In USD Billion, 2016-2030F
- Figure 89. Poland Satellite Telecom Market, By Volume, In Unit Thousand, 2016-2030F
- Figure 90. Poland Satellite Telecom Market Share, By Components, In USD Billion, 2016-2030F
- Figure 91. Poland Satellite Telecom Market Share, By Frequency Band, In USD Billion, 2016-2030F
- Figure 92. Poland Satellite Telecom Market Share, By Application, In USD Billion, 2016-2030F
- Figure 93. Poland Satellite Telecom Market Share, By End-User, In USD Billion, 2016-2030F
- Figure 94. South America Satellite Telecom Market, By Value, In USD Billion, 2016-2030F
- Figure 95. South America Satellite Telecom Market, By Volume, In Unit Thousand, 2016-2030F
- Figure 96. South America Satellite Telecom Market Share, By Components, In USD Billion, 2016-2030F
- Figure 97. South America Satellite Telecom Market Share, By Frequency Band, In USD Billion, 2016-2030F
- Figure 98. South America Satellite Telecom Market Share, By Application, In USD Billion, 2016-2030F
- Figure 99. South America Satellite Telecom Market Share, By End-User, In USD Billion, 2016-2030F
- Figure 100. South America Satellite Telecom Market Share, By Country, In USD Billion, 2016-2030F
- Figure 101. Brazil Satellite Telecom Market, By Value, In USD Billion, 2016-2030F
- Figure 102. Brazil Satellite Telecom Market, By Volume, In Unit Thousand, 2016-2030F
- Figure 103. Brazil Satellite Telecom Market Share, By Components, In USD Billion, 2016-2030F
- Figure 104. Brazil Satellite Telecom Market Share, By Frequency Band, In USD Billion, 2016-2030F
- Figure 105. Brazil Satellite Telecom Market Share, By Application, In USD Billion, 2016-2030F
- Figure 106. Brazil Satellite Telecom Market Share, By End-User, In USD Billion, 2016-2030F
- Figure 107. Argentina Satellite Telecom Market, By Value, In USD Billion, 2016-2030F
- Figure 108. Argentina Satellite Telecom Market, By Volume, In Unit Thousand, 2016-2030F
- Figure 109. Argentina Satellite Telecom Market Share, By Components, In USD Billion, 2016-2030F
- Figure 110. Argentina Satellite Telecom Market Share, By Frequency Band, In USD Billion, 2016-2030F
- Figure 111. Argentina Satellite Telecom Market Share, By Application, In USD Billion, 2016-2030F
- Figure 112. Argentina Satellite Telecom Market Share, By End-User, In USD Billion, 2016-2030F
- Figure 113. Asia-Pacific Satellite Telecom Market, By Value, In USD Billion, 2016-2030F
- Figure 114. Asia-Pacific Satellite Telecom Market, By Volume, In Unit Thousand, 2016-2030F
- Figure 115. Asia-Pacific Satellite Telecom Market Share, By Components, In USD Billion, 2016-2030F
- Figure 116. Asia-Pacific Satellite Telecom Market Share, By Frequency Band, In USD Billion, 2016-2030F
- Figure 117. Asia-Pacific Satellite Telecom Market Share, By Application, In USD Billion, 2016-2030F
- Figure 118. Asia- Pacific Cream Market Share, By End-User, In USD Billion, 2016-2030F
- Figure 119. Asia-Pacific Satellite Telecom Market Share, By Country, In USD Billion, 2016-2030F
- Figure 120. India Satellite Telecom Market, By Value, In USD Billion, 2016-2030F
- Figure 121. India Satellite Telecom Market, By Volume, In Unit Thousand, 2016-2030F
- Figure 122. India Satellite Telecom Market Share, By Components, In USD Billion, 2016-2030F
- Figure 123. India Satellite Telecom Market Share, By Frequency Band, In USD Billion, 2016-2030F
- Figure 124. India Satellite Telecom Market Share, By Application, In USD Billion, 2016-2030F
- Figure 125. India Satellite Telecom Market Share, By End-User, In USD Billion, 2016-2030F
- Figure 126. China Satellite Telecom Market, By Value, In USD Billion, 2016-2030F
- Figure 127. China Satellite Telecom Market, By Volume, In Unit Thousand, 2016-2030F
- Figure 128. China Satellite Telecom Market Share, By Components, In USD Billion, 2016-2030F
- Figure 129. China Satellite Telecom Market Share, By Frequency Band, In USD Billion, 2016-2030F
- Figure 130. China Satellite Telecom Market Share, By Application, In USD Billion, 2016-2030F
- Figure 131. China Satellite Telecom Market Share, By End-User, In USD Billion, 2016-2030F
- Figure 132. Japan Satellite Telecom Market, By Value, In USD Billion, 2016-2030F
- Figure 133. Japan Satellite Telecom Market, By Volume, In Unit Thousand, 2016-2030F
- Figure 134. Japan Satellite Telecom Market Share, By Components, In USD Billion, 2016-2030F
- Figure 135. Japan Satellite Telecom Market Share, By Frequency Band, In USD Billion, 2016-2030F
- Figure 136. Japan Satellite Telecom Market Share, By Application, In USD Billion, 2016-2030F
- Figure 137. Japan Satellite Telecom Market Share, By End-User, In USD Billion, 2016-2030F
- Figure 138. Australia Satellite Telecom Market, By Value, In USD Billion, 2016-2030F
- Figure 139. Australia Satellite Telecom Market, By Volume, In Unit Thousand, 2016-2030F
- Figure 140. Australia Satellite Telecom Market Share, By Components, In USD Billion, 2016-2030F
- Figure 141. Australia Satellite Telecom Market Share, By Frequency Band, In USD Billion, 2016-2030F
- Figure 142. Australia Satellite Telecom Market Share, By Application, In USD Billion, 2016-2030F
- Figure 143. Australia Satellite Telecom Market Share, By End-User, In USD Billion, 2016-2030F
- Figure 144. Vietnam Satellite Telecom Market, By Value, In USD Billion, 2016-2030F
- Figure 145. Vietnam Satellite Telecom Market, By Volume, In Unit Thousand, 2016-2030F
- Figure 146. Vietnam Satellite Telecom Market Share, By Components, In USD Billion, 2016-2030F
- Figure 147. Vietnam Satellite Telecom Market Share, By Frequency Band, In USD Billion, 2016-2030F
- Figure 148. Vietnam Satellite Telecom Market Share, By Application, In USD Billion, 2016-2030F
- Figure 149. Vietnam Satellite Telecom Market Share, By End-User, In USD Billion, 2016-2030F
- Figure 150. South Korea Satellite Telecom Market, By Value, In USD Billion, 2016-2030F
- Figure 151. South Korea Satellite Telecom Market, By Volume, In Unit Thousand, 2016-2030F
- Figure 152. South Korea Satellite Telecom Market Share, By Components, In USD Billion, 2016-2030F
- Figure 153. South Korea Satellite Telecom Market Share, By Frequency Band, In USD Billion, 2016-2030F
- Figure 154. South Korea Satellite Telecom Market Share, By Application, In USD Billion, 2016-2030F
- Figure 155. South Korea Satellite Telecom Market Share, By End-User, In USD Billion, 2016-2030F
- Figure 156. Indonesia Satellite Telecom Market, By Value, In USD Billion, 2016-2030F
- Figure 157. Indonesia Satellite Telecom Market, By Volume, In Unit Thousand, 2016-2030F
- Figure 158. Indonesia Satellite Telecom Market Share, By Components, In USD Billion, 2016-2030F
- Figure 159. Indonesia Satellite Telecom Market Share, By Frequency Band, In USD Billion, 2016-2030F
- Figure 160. Indonesia Satellite Telecom Market Share, By Application, In USD Billion, 2016-2030F
- Figure 161. Indonesia Satellite Telecom Market Share, By End-User, In USD Billion, 2016-2030F
- Figure 162. Philippines Satellite Telecom Market, By Value, In USD Billion, 2016-2030F
- Figure 163. Philippines Satellite Telecom Market, By Volume, In Unit Thousand, 2016-2030F
- Figure 164. Philippines Satellite Telecom Market Share, By Components, In USD Billion, 2016-2030F
- Figure 165. Philippines Satellite Telecom Market Share, By Frequency Band, In USD Billion, 2016-2030F
- Figure 166. Philippines Satellite Telecom Market Share, By Application, In USD Billion, 2016-2030F
- Figure 167. Philippines Satellite Telecom Market Share, By End-User, In USD Billion, 2016-2030F
- Figure 168. Middle East & Africa Satellite Telecom Market, By Value, In USD Billion, 2016-2030F
- Figure 169. Middle East & Africa Satellite Telecom Market, By Volume, In Unit Thousand, 2016-2030F
- Figure 170. Middle East & Africa Satellite Telecom Market Share, By Components, In USD Billion, 2016-2030F
- Figure 171. Middle East & Africa Satellite Telecom Market Share, By Frequency Band, In USD Billion, 2016-2030F
- Figure 172. Middle East & Africa Satellite Telecom Market Share, By Application, In USD Billion, 2016-2030F
- Figure 173. Middle East & Africa Satellite Telecom Market Share, By End-User, In USD Billion, 2016-2030F
- Figure 174. Middle East & Africa Satellite Telecom Market Share, By Country, In USD Billion, 2016-2030F
- Figure 175. Saudi Arabia Satellite Telecom Market, By Value, In USD Billion, 2016-2030F
- Figure 176. Saudi Arabia Satellite Telecom Market, By Volume, In Unit Thousand, 2016-2030F
- Figure 177. Saudi Arabia Satellite Telecom Market Share, By Components, In USD Billion, 2016-2030F
- Figure 178. Saudi Arabia Satellite Telecom Market Share, By Frequency Band, In USD Billion, 2016-2030F
- Figure 179. Saudi Arabia Satellite Telecom Market Share, By Application, In USD Billion, 2016-2030F
- Figure 180. Saudi Arabia Satellite Telecom Market Share, By End-User, In USD Billion, 2016-2030F
- Figure 181. UAE Satellite Telecom Market, By Value, In USD Billion, 2016-2030F
- Figure 182. UAE Satellite Telecom Market, By Volume, In Unit Thousand, 2016-2030F
- Figure 183. UAE Satellite Telecom Market Share, By Components, In USD Billion, 2016-2030F
- Figure 184. UAE Satellite Telecom Market Share, By Frequency Band, In USD Billion, 2016-2030F
- Figure 185. UAE Satellite Telecom Market Share, By Application, In USD Billion, 2016-2030F
- Figure 186. UAE Satellite Telecom Market Share, By End-User, In USD Billion, 2016-2030F
- Figure 187. South Africa Satellite Telecom Market, By Value, In USD Billion, 2016-2030F
- Figure 188. South Africa Satellite Telecom Market, By Volume, In Unit Thousand, 2016-2030F
- Figure 189. South Africa Satellite Telecom Market Share, By Components, In USD Billion, 2016-2030F
- Figure 190. South Africa Satellite Telecom Market Share, By Frequency Band, In USD Billion, 2016-2030F
- Figure 191. South Africa Satellite Telecom Market Share, By Application, In USD Billion, 2016-2030F
- Figure 192. South Africa Satellite Telecom Market Share, By End-User, In USD Billion, 2016-2030F
- Figure 193. By Components Map-Market Size (USD Billion) & Growth Rate (%), 2022
- Figure 194. By Frequency Band Map-Market Size (USD Billion) & Growth Rate (%), 2022
- Figure 195. By Application Map-Market Size (USD Billion) & Growth Rate (%), 2022
- Figure 196. By End-User Map-Market Size (USD Billion) & Growth Rate (%), 2022
- Figure 197. By Region Map-Market Size (USD Billion) & Growth Rate (%), 2022
Global Satellite Telecommunication Market size was valued at USD 69 billion in 2022, which is expected to reach USD 161 billion in 2030 with a CAGR of 11.2% during the forecasted period between 2023 and 2030.
The Global Satellite Telecommunication Market is a substantial and dynamic industry with widespread applications across various sectors. It encompasses using satellites for communication, data transmission, broadcasting, and connectivity services on a global scale. The market has been experiencing steady growth due to increasing demand for reliable and efficient communication and connectivity services across various industries and regions. Advancements in satellite technology, mega-constellations, and the proliferation of satellite-based applications have contributed to market expansion.
North America has a high demand for satellite communication services, driven by various sectors, including government & military, broadcasting & media, maritime & aviation, enterprise, and consumer broadband. Some of the largest satellite mega-constellations, such as SpaceX's Starlink and OneWeb, are being deployed by North American companies. These constellations aim to provide global broadband internet coverage and are expected to impact the market significantly.
As reported by the ITU's Measuring Digital Development, the utilization of international bandwidth experienced rapid expansion in 2021-22, registering a speedy growth of approximately 30% to reach 932 terabits per second. Alongside, advancements are being witnessed in the satellite communication (satcom) sector, with the emergence of ultra-high throughput satellite (UHTS) technology and the development of Earth stations in motion (ESIM) solutions, reflecting the evolving landscape of the industry.
Expansion of Satellite Mega-Constellations and Broadband Connectivity
The proliferation of digital services, IoT devices, and data-intensive applications has led to a surge in the need for high-speed broadband connectivity, especially in remote and underserved areas where terrestrial networks may be limited or unavailable. Companies like SpaceX (Starlink), OneWeb, and Amazon (Project Kuiper) are deploying prominent constellations of low earth orbit (LEO) satellites to provide global broadband internet coverage. These mega-constellations promise to enhance connectivity and accessibility across the globe significantly.
For instance, in January 2023, SpaceX successfully launched a potent Indonesian communications satellite, SATRIA, which serves as the linchpin in a USD 550 million initiative. The primary goal of this project is to extend high-speed internet access to various institutions, including schools, medical centers, public facilities, and government buildings all over the island nation. The SATRIA project represents a collaboration between the Indonesian government and a consortium led by PT Pasifik Satellite Nusantara (PSN), a satellite operator. With its impressive throughput of 150 gigabytes per second, SATRIA will establish connectivity for approximately 94,000 schools, nearly 50,000 village offices, various government establishments, as well as numerous hospitals and medical facilities scattered across the extensive archipelago, which happens to be the world's fourth most populous country.
Rapid Adoption of IoT Solutions Influencing the Demand Curve of the Market
The rapid adoption of IoT significantly influences the demand in the global satellite telecommunication market. As IoT applications continue to increase across industries, reliable and widespread connectivity becomes paramount, especially in remote and hard-to-reach areas where traditional communication infrastructure is lacking. IoT-enabled sensors and devices are crucial in disaster management, environmental monitoring, and remote sensing.
Satellites enable continuous data collection and communication for such applications, aiding in early warning systems and emergency response, which will further scatter demand for communication satellites. For instance, in November 2022, Sateliot, the U.S. based first nanosatellite telecommunications company, offered 5G connectivity worldwide with the launch of SpaceX Falcon 9 rockets. Sateliot's 5G satellite network solves the connectivity issue by enabling anyone with an intelligent standard IoT device to contact their space network and receive a strong, clear cellular signal. Marine researchers can now monitor diminishing populations, such as blue whales, more affordably and successfully, aiding in preserving these endangered species.
Maritime and Aviation Sector Dominates SATCOM Market
Adopting new satellite communication technologies and increasing utilization of IoT in the aviation industry for applications like aircraft connectivity, airline services, air traffic control, and maintenance, repair, and overhaul (MRO) facilities are expected to be significant drivers.
Moreover, the growing reliance on satellite communications in military operations is set to boost the market growth further worldwide. In collaboration with government entities, military applications are predicted to emerge as the critical growth vertical in this market. The defense industry's rising demand for SATCOM systems has prompted commercial firms to accelerate the development of smart hardware and services. This integration of satellite communications in military and defense communication will likely become a considerable driving force behind the market's growth throughout the forecast period.
For instance, in June 2023, OneWeb, the global low Earth orbit (LEO) communications network, introduced its "Try Before You Buy" maritime service. This new offering allows maritime users to make bookings and experience the advantages of OneWeb's high-speed enterprise-grade flexible connectivity packages at sea, providing speeds exceeding 100mbps. With the successful deployment of 634 operational satellites in its constellation, OneWeb's network is now complete and fully operational up to 35 degrees latitude.
Antenna Segment Holds Highest Market Share in Global SATCOM Market
The SATCOM market segment comprises receivers, transmitters/transponders, transceivers, amplifiers, converters, antennas, and other elements. In contrast, the antenna segment holds the highest share in 2022 and the transceiver segment is projected to experience the highest growth rate from 2023 to 2030. This growth is driven by the increasing adoption of advanced transceiver systems replacing traditional transmitters and receivers.
For instance, in June 2023, Kymeta, a renowned flat panel satellite antenna company, and OneWeb, a low Earth orbit (LEO) satellite communications company, jointly announced the commercial availability of Kymeta's Peregrine u8 LEO terminal. This milestone marks the world's first flat panel antenna to cater to the maritime market on OneWeb's LEO network.
Impact of COVID-19
Since the beginning of the pandemic, satellite operators providing broadband connectivity directly to consumers have experienced a significant rise in data traffic across Europe and the Americas, with an increase of 15-70%, depending on the country. Additionally, there has been a surge in subscriptions in the United States, Mexico, and Brazil. In response, satellite operators have taken dedicated actions, such as prioritizing educational and business collaboration applications and making Wi-Fi hotspots accessible to those in need.
Despite many people working in urban areas, a considerable population resides outside cities and even on islands, all of whom require reliable connectivity to continue working, attend online classes, and stay connected with their loved ones. To address this need, satellite operators actively support Mobile Network Operators (MNOs) to extend connectivity to suburban and rural regions. Consequently, satellite capacity has increased from 10% on islands to 50% in rural areas during the lockdown period.
Impact of Russia-Ukraine War
Roscosmos, the Russian space agency, has declined to launch over 30 satellites for OneWeb due to the UK's sanctions against Russia following its invasion. The UK had provided partial financial support to assist OneWeb's recovery from bankruptcy. In response, Russia insists that the UK divest its stake in OneWeb. OneWeb is among a few companies aiming to establish a global network of low-Earth orbit (LEO) satellites to offer Internet services.
Key Players Landscape and Outlook
The Global Satellite Telecommunication Market is exceptionally competitive and remains highly concentrated today. Market participants in the IoT market are attempting to increase their market share through various business methods such as collaborations, agreements, acquisitions, and mergers of multiple players across the value chain. Additionally, companies are paying close attention to item quality and efficient service giving, and they are constantly developing new products to meet client demand.
In June 2022, SES successfully deployed the SES-22 satellite into space using a SpaceX Falcon 9 rocket launched from Cape Canaveral Space Force Station in Florida. This satellite, manufactured by Thales Alenia Space, is specifically designed to liberate the lower 300 MHz of the C-band spectrum. Positioned in the orbital slot at 135 degrees West, delivers television and radio services to numerous American households and offers essential data transmission services.
Table of Contents
1. Research Methodology
2. Project Scope & Definitions
3. Impact of COVID-19 on Satellite Telecom Market
4. Impact of Russia-Ukraine War
5. Executive Summary
6. Voice of Customer
- 6.1. Demographics (Age, Geography, Income, etc.)
- 6.2. Market Awareness and Product Information
- 6.3. Quality of product
- 6.4. Lifetime value of product
- 6.5. Brand Awareness and Loyalty
- 6.6. Factors Considered in Purchase Decision
- 6.6.1. Brand Loyalty
- 6.6.2. Pricing
- 6.6.3. Customisation Options
- 6.7. Purpose of Purchase
7. Global Satellite Telecom Market Outlook, 2016-2030F
- 7.1. Market Size & Forecast
- 7.1.1. By Value
- 7.1.2. By Volume
- 7.2. By Component
- 7.2.1. Hardware
- 7.2.1.1. Amplifier
- 7.2.1.2. Converter
- 7.2.1.3. Receiver
- 7.2.1.4. Antenna
- 7.2.1.5. Transceivers
- 7.2.1.6. Others
- 7.2.2. Software
- 7.2.2.1. Network Management
- 7.2.2.2. Encryption and Security
- 7.2.2.3. Satellite Tracking and Orbit Determination
- 7.2.2.4. Monitoring and Diagnostics
- 7.2.2.5. Satellite Data Analytics
- 7.2.2.6. Others
- 7.2.3. Services
- 7.2.3.1. Fixed Satellite Services (FSS)
- 7.2.3.2. Mobile Satellite Services (MSS)
- 7.2.3.3. VSAT (Very Small Aperture Terminal) Services
- 7.2.1. Hardware
- 7.3. By Frequency Band
- 7.3.1. C-band
- 7.3.2. Ku-band
- 7.3.3. Ka-band
- 7.3.4. Others
- 7.4. By Application
- 7.4.1. Maritime and Aviation
- 7.4.2. Military & Defence
- 7.4.3. IoT and M2M Connectivity
- 7.4.4. Agriculture and Environmental Monitoring
- 7.4.5. Others
- 7.5. By End-user
- 7.5.1. IT & Telecom
- 7.5.2. Automotive & Transportation
- 7.5.3. Media & Entertainment
- 7.5.4. Energy & Utilities
- 7.5.5. Oil and Gas
- 7.5.6. Others
- 7.6. By Region
- 7.6.1. North America
- 7.6.2. Europe
- 7.6.3. South America
- 7.6.4. Asia-Pacific
- 7.6.5. Middle East and Africa
- 7.7. By Company Market Share (%), 2022
8. Global Satellite Telecom Market Outlook, By Region, 2016-2030F
- 8.1. North America*
- 8.1.1. By Component
- 8.1.1.1. Hardware
- 8.1.1.1.1. Amplifier
- 8.1.1.1.2. Converter
- 8.1.1.1.3. Receiver
- 8.1.1.1.4. Antenna
- 8.1.1.1.5. Transceivers
- 8.1.1.1.6. Other accessories
- 8.1.1.2. Software
- 8.1.1.2.1. Network Management
- 8.1.1.2.2. Encryption and Security
- 8.1.1.2.3. Satellite Tracking and Orbit Determination
- 8.1.1.2.4. Monitoring and Diagnostics
- 8.1.1.2.5. Satellite Data Analytics
- 8.1.1.2.6. Others
- 8.1.1.3. Services
- 8.1.1.3.1. Fixed Satellite Services (FSS)
- 8.1.1.3.2. Mobile Satellite Services (MSS)
- 8.1.1.3.3. VSAT (Very Small Aperture Terminal) Services
- 8.1.2. By Frequency Band
- 8.1.2.1. C-band
- 8.1.2.2. Ku-band
- 8.1.2.3. Ka-band
- 8.1.2.4. Others
- 8.1.3. By Application
- 8.1.3.1. Maritime and Aviation
- 8.1.3.2. Military & Defence
- 8.1.3.3. IoT and M2M Connectivity
- 8.1.3.4. Agriculture and Environmental Monitoring
- 8.1.3.5. Others
- 8.1.4. By End-user
- 8.1.4.1. IT & Telecom
- 8.1.4.2. Automotive & Transportation
- 8.1.4.3. Media & Entertainment
- 8.1.4.4. Energy & Utilities
- 8.1.4.5. Oil and Gas
- 8.1.4.6. Others
- 8.1.5. United States*
- 8.1.5.1. By Component
- 8.1.5.2. Hardware
- 8.1.5.2.1. Amplifier
- 8.1.5.2.2. Converter
- 8.1.5.2.3. Receiver
- 8.1.5.2.4. Antenna
- 8.1.5.2.5. Transceivers
- 8.1.5.2.6. Other accessories
- 8.1.5.3. Software
- 8.1.5.3.1. Network Management
- 8.1.5.3.2. Encryption and Security
- 8.1.5.3.3. Satellite Tracking and Orbit Determination
- 8.1.5.3.4. Monitoring and Diagnostics
- 8.1.5.3.5. Satellite Data Analytics
- 8.1.5.3.6. Others
- 8.1.5.4. Services
- 8.1.5.4.1. Fixed Satellite Services (FSS)
- 8.1.5.4.2. Mobile Satellite Services (MSS)
- 8.1.5.4.3. VSAT (Very Small Aperture Terminal) Services
- 8.1.6. Frequency Band
- 8.1.6.1. C-band
- 8.1.6.2. Ku-band
- 8.1.6.3. Ka-band
- 8.1.6.4. Others
- 8.1.7. By Application
- 8.1.7.1. Maritime and Aviation
- 8.1.7.2. Military & Defence
- 8.1.7.3. IoT and M2M Connectivity
- 8.1.7.4. Agriculture and Environmental Monitoring
- 8.1.7.5. Others
- 8.1.8. By End-user
- 8.1.8.1. IT & Telecom
- 8.1.8.2. Automotive & Transportation
- 8.1.8.3. Media & Entertainment
- 8.1.8.4. Energy & Utilities
- 8.1.8.5. Oil and Gas
- 8.1.8.6. Others
- 8.1.9. Canada
- 8.1.10. Mexico
- 8.1.1. By Component
All segments will be provided for all regions and countries covered
- 8.2. Europe
- 8.2.1. Germany
- 8.2.2. France
- 8.2.3. Italy
- 8.2.4. United Kingdom
- 8.2.5. Russia
- 8.2.6. Netherlands
- 8.2.7. Spain
- 8.2.8. Turkey
- 8.2.9. Poland
- 8.3. South America
- 8.3.1. Brazil
- 8.3.2. Argentina
- 8.4. Asia-Pacific
- 8.4.1. India
- 8.4.2. China
- 8.4.3. Japan
- 8.4.4. Australia
- 8.4.5. Vietnam
- 8.4.6. South Korea
- 8.4.7. Indonesia
- 8.4.8. Philippines
- 8.5. Middle East & Africa
- 8.5.1. Saudi Arabia
- 8.5.2. UAE
- 8.5.3. South Africa
9. Market Mapping, 2022
- 9.1. By Component
- 9.2. By Frequency Band
- 9.3. By Application
- 9.4. By End-user
- 9.5. By Region
10. Macro Environment and Industry Structure
- 10.1. Supply Demand Analysis
- 10.2. Import Export Analysis
- 10.3. Value Chain Analysis
- 10.4. PESTEL Analysis
- 10.4.1. Political Factors
- 10.4.2. Economic System
- 10.4.3. Social Implications
- 10.4.4. Technological Advancements
- 10.4.5. Environmental Impacts
- 10.4.6. Legal Compliances and Regulatory Policies (Statutory Bodies Included)
- 10.5. Porter's Five Forces Analysis
- 10.5.1. Supplier Power
- 10.5.2. Buyer Power
- 10.5.3. Substitution Threat
- 10.5.4. Threat from New Entrant
- 10.5.5. Competitive Rivalry
11. Market Dynamics
- 11.1. Growth Drivers
- 11.2. Growth Inhibitors (Challenges and Restraints)
12. Key Players Landscape
- 12.1. Competition Matrix of Top Five Market Leaders
- 12.2. Market Revenue Analysis of Top Five Market Leaders (in %, 2022)
- 12.3. Mergers and Acquisitions/Joint Ventures (If Applicable)
- 12.4. SWOT Analysis (For Five Market Players)
- 12.5. Patent Analysis (If Applicable)
13. Pricing Analysis
14. Case Studies
15. Key Players Outlook
- 15.1. SES S.A
- 15.1.1. Company Details
- 15.1.2. Key Management Personnel
- 15.1.3. Products & Services
- 15.1.4. Financials (As reported)
- 15.1.5. Key Market Focus & Geographical Presence
- 15.1.6. Recent Developments
- 15.2. Intelsat US LLC
- 15.3. EUTELSAT COMMUNICATIONS SA
- 15.4. Inmarsat Global Limited
- 15.5. Iridium Communications Inc.
- 15.6. Viasat Inc.
- 15.7. China Satellite Communications Co. Ltd.
- 15.8. Telesat Corporation
- 15.9. Hispasat, SA.
- 15.10. Orbcomm LLC