|
|
市場調査レポート
商品コード
1322269
アルコール飲料の世界市場の評価:タイプ別、アルコール度数別、包装別、カテゴリ別、流通チャネル別、地域別、機会、予測(2016年~2030年)Alcoholic Beverages Market Assessment, By Type, By Alcohol Content, By Packaging, By Category, By Distribution Channel, By Region, Opportunities, and Forecast, 2016-2030F |
||||||
|
|
|||||||
カスタマイズ可能
|
|||||||


| アルコール飲料の世界市場の評価:タイプ別、アルコール度数別、包装別、カテゴリ別、流通チャネル別、地域別、機会、予測(2016年~2030年) |
|
出版日: 2023年08月03日
発行: Markets & Data
ページ情報: 英文 125 Pages
納期: 3~5営業日
|

- 全表示
- 概要
- 図表
- 目次
世界のアルコール飲料の市場規模は、2022年の1兆7,100億米ドルから2030年までに2兆3,400億米ドルに達し、2023年~2030年の予測期間にCAGRで4.01%の成長が予測されています。市場拡大の主な要因の1つは、多忙な生活やストレスの多い仕事のスケジュールによってもたらされる緊張や不安を和らげるためのアルコール飲料に対する需要の増加と、女性たちの消費動向の拡大です。また、世界各地でカフェ、パブ、クラブ、バー、ホテル、レストランが拡大し、アルコール飲料の消費が増加していることも、市場に明るい見通しをもたらしています。さらに、プレミアムでアルコール度数の低いRTDアルコール飲料に対する一般消費者の需要が世界中で高まっています。このことが市場成長を加速させ、人々の社交や週末の集まりの動向を高めています。
加えて、ハイパーマーケット、スーパーマーケット、専門店、コンビニエンスストア、オンラインストアなど、さまざまな流通チャネルを通じてアルコール飲料が広く入手できるようになったことも、産業経営者に有利な拡大可能性をもたらしています。市場は、若い世代によるフレーバー付きアルコール飲料への需要の向上によって好影響を受けています。これとは別に、消化管の健康維持に役立つビールの人気の向上により、市場は拡大しています。
さらに、中国やインドなどの新興国における職人技を駆使した蒸留酒の需要の急増により、市場成長が見込まれています。さらに、競争力のある価格で付加価値の高いハードセルツァー製品に対する需要の増加を活用する機会が市場にもたらされています。しかし、産業の拡大は、ノンアルコール飲料への選好の高まりによって妨げられています。健康志向の消費者に対応するため、主要企業は現在、アルコール度数の低いコーディアルやアルコール飲料の導入に注力しています。2021年8月、もっともヘルシーな低アルコールビールの1つであるHola Beer with Lime(アルコール度数0.5%)が、Loah Beer Co.によって低アルコール・ノンアルコールカテゴリに導入されました。アルコール度数0.5%を目標に、酵母、ホップ、麦芽はすべてアルコールビールと同じものを使用し、英国市場で現在販売されている低アルコールビールのうち、もっとも低カロリーで低糖質です。
プレミアム/スーパープレミアムアルコール飲料の人気の高まり
今日、世界の消費者の選好はより洗練され、ユニークで優れたアルコール飲料をいつも探しているため、最高級のアルコール飲料に対する市場需要が高まっています。米国蒸留酒協会のデータによると、2021年までにプレミアムウイスキーの9リットルケースが2,170万本、プレミアムウォッカの9リットルケースが2,110万本消費されました。また、スーパープレミアムウイスキーは前年比14.1%増、ウォッカは同13.9%増でした。
健康志向の高まりを受け、機能性プレミアムアルコール飲料が開発されました。アルコールはさまざまな天然成分や外来の成分が含まれることで、より優れた機能性を発揮する傾向があり、幅広い消費者を惹きつけています。例えば、英国のプレミアムジンブランドであるWhitley Neillは、2022年3月にジンの新商品としてOriental Spiced Ginを発売しました。このジンには、グレインオブパラダイス、コリアンダー、ジンジャー、チリ、クミン、サフラン、唐辛子など、さまざまな植物やスパイスが含まれています。したがって、予測期間を通じて、プレミアム/スーパープレミアムアルコール飲料の人気の高まりが市場需要を促進すると予想されます。
当レポートでは、世界のアルコール飲料市場について調査分析し、市場規模と予測、市場力学、主要企業の情勢と見通しなどを提供しています。
目次
第1章 調査手法
第2章 プロジェクトの範囲と定義
第3章 世界の酒類市場に対するCOVID-19の影響
第4章 エグゼクティブサマリー
第5章 顧客の声
- 人口統計(年齢/コホート分析 - 団塊世代とX世代、ミレニアル世代、Z世代、性別、所得 - 低、中、高、地域、国籍など)
- 市場の認知度と製品情報
- ブランドの認知度とロイヤルティ
- 購入決定において考慮される要素
- 購入目的(個人使用、贈答品)
- 購入頻度
- 購入媒体
- 製品/ブランドの吸収におけるブランドアンバサダーまたはインフルエンサーマーケティングの役割
第6章 世界のアルコール飲料市場の見通し(2016年~2030年)
- 市場規模と予測
- 金額
- 数量
- タイプ別
- ビール
- ワイン
- スピリッツ
- サイダー、フレーバー付きアルコール飲料(FAB)
- その他
- アルコール度数別
- 高
- 中
- 低
- 包装別
- アルミ缶
- パウチ包装
- ガラスボトル
- ペットボトル
- その他
- カテゴリ別
- 大衆向け
- プレミアム
- 流通チャネル別
- コンビニエンスストア
- 店内
- 酒屋
- 食料品店
- インターネット小売
- スーパーマーケット
- その他
- 地域別
- 北米
- 欧州
- 南米
- アジア太平洋
- 中東・アフリカ
第7章 世界のアルコール飲料市場の見通し:地域別(2016年~2030年)
- 北米
- タイプ別
- アルコール度数別
- 包装別
- カテゴリ別
- 流通チャネル別
- 米国
- カナダ
- メキシコ
- 欧州
- ドイツ
- フランス
- イタリア
- 英国
- ロシア
- オランダ
- スペイン
- トルコ
- ポーランド
- 南米
- ブラジル
- アルゼンチン
- アジア太平洋
- インド
- 中国
- 日本
- オーストラリア
- ベトナム
- 韓国
- インドネシア
- フィリピン
- 中東・アフリカ
- アラブ首長国連邦
- 南アフリカ
- その他
第8章 市場マッピング(2022年)
- タイプ別
- アルコール度数別
- 包装別
- カテゴリ別
- 流通チャネル別
- 地域別
第9章 マクロ環境と産業構造
- 需給分析
- 輸出入の分析
- バリューチェーン分析
- PESTEL分析
- ポーターのファイブフォース分析
第10章 市場力学
- 成長促進要因
- 成長抑制要因(課題、抑制要因)
第11章 主要企業情勢
- マーケットリーダー上位5社の競合マトリクス
- マーケットリーダー上位5社市場の収益分析(2022年)
- 合併と買収/合弁事業(該当する場合)
- SWOT分析(市場参入企業5社向け)
- 特許分析(該当する場合)
第12章 価格分析
第13章 ケーススタディ
第14章 主要企業の見通し
- Anheuser-Busch InBev SA/NV
- Bacardi Limited
- Heineken NV
- Constellation Brands, Inc.
- Diageo plc
- Carlsberg A/S
- Molson Coors Beverage Company
- Pernod Ricard SA
- Olvi plc
- Suntory Group
第15章 戦略的推奨事項
第16章 当社について・免責事項
List of Tables
- Table 1. Pricing Analysis of Products from Key Players
- Table 2. Competition Matrix of Top 5 Market Leaders
- Table 3. Mergers & Acquisitions/ Joint Ventures (If Applicable)
- Table 4. About Us - Regions and Countries Where We Have Executed Client Projects
List of Figures
- Figure 1. Global Alcoholic Beverages Market, By Value, In USD Trillion, 2016-2030F
- Figure 2. Global Alcoholic Beverages Market, By Volume, In Units Thousand, 2016-2030F
- Figure 3. Global Alcoholic Beverages Market Share, By Type, In USD Trillion, 2016-2030F
- Figure 4. Global Alcoholic Beverages Market Share, By Alcohol Content, In USD Trillion, 2016-2030F
- Figure 5. Global Alcoholic Beverages Market Share, By Packaging, In USD Trillion, 2016-2030F
- Figure 6. Global Alcoholic Beverages Market Share, By Category, In USD Trillion, 2016-2030F
- Figure 7. Global Alcoholic Beverages Market Share, By Distribution Channel, In USD Trillion, 2016-2030F
- Figure 8. Global Alcoholic Beverages Market Share, By Region, In USD Trillion, 2016-2030F
- Figure 9. North America Alcoholic Beverages Market, By Value, In USD Billion, 2016-2030F
- Figure 10. North America Alcoholic Beverages Market, By Volume, In Units Thousand, 2016-2030F
- Figure 11. North America Alcoholic Beverages Market Share, By Type, In USD Billion, 2016-2030F
- Figure 12. North America Alcoholic Beverages Market Share, By Alcohol Content, In USD Billion, 2016-2030F
- Figure 13. North America Alcoholic Beverages Market Share, By Packaging, In USD Billion, 2016-2030F
- Figure 14. North America Alcoholic Beverages Market Share, By Category, In USD Billion, 2016-2030F
- Figure 15. North America Alcoholic Beverages Market Share, By Distribution Channel, In USD Billion, 2016-2030F
- Figure 16. North America Alcoholic Beverages Market Share, By Country, In USD Billion, 2016-2030F
- Figure 17. United States Alcoholic Beverages Market, By Value, In USD Billion, 2016-2030F
- Figure 18. United States Alcoholic Beverages Market, By Volume, In Units Thousand, 2016-2030F
- Figure 19. United States Alcoholic Beverages Market Share, By Type, In USD Billion, 2016-2030F
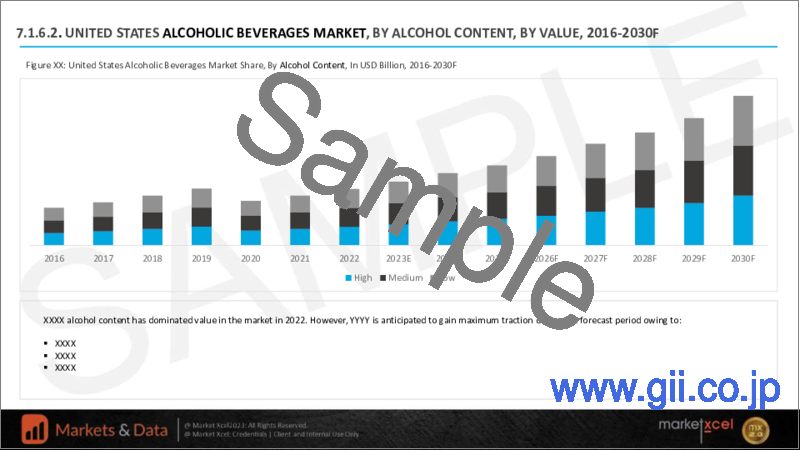
- Figure 20. United States Alcoholic Beverages Market Share, By Alcohol Content, In USD Billion, 2016-2030F
- Figure 21. United States Alcoholic Beverages Market Share, By Packaging, In USD Billion, 2016-2030F
- Figure 22. United States Alcoholic Beverages Market Share, By Category, In USD Billion, 2016-2030F
- Figure 23. United States Alcoholic Beverages Market Share, By Distribution Channel, In USD Billion, 2016-2030F
- Figure 24. Canada Alcoholic Beverages Market, By Value, In USD Billion, 2016-2030F
- Figure 25. Canada Alcoholic Beverages Market, By Volume, In Units Thousand, 2016-2030F
- Figure 26. Canada Alcoholic Beverages Market Share, By Type, In USD Billion, 2016-2030F
- Figure 27. Canada Alcoholic Beverages Market Share, By Alcohol Content, In USD Billion, 2016-2030F
- Figure 28. Canada Alcoholic Beverages Market Share, By Packaging, In USD Billion, 2016-2030F
- Figure 29. Canada Alcoholic Beverages Market Share, By Category, In USD Billion, 2016-2030F
- Figure 30. Canada Alcoholic Beverages Market Share, By Distribution Channel, In USD Billion, 2016-2030F
- Figure 31. Mexico Alcoholic Beverages Market, By Value, In USD Billion, 2016-2030F
- Figure 32. Mexico Alcoholic Beverages Market, By Volume, In Units Thousand, 2016-2030F
- Figure 33. Mexico Alcoholic Beverages Market Share, By Type, In USD Billion, 2016-2030F
- Figure 34. Mexico Alcoholic Beverages Market Share, By Alcohol Content, In USD Billion, 2016-2030F
- Figure 35. Mexico Alcoholic Beverages Market Share, By Packaging, In USD Billion, 2016-2030F
- Figure 36. Mexico Alcoholic Beverages Market Share, By Category, In USD Billion, 2016-2030F
- Figure 37. Mexico Alcoholic Beverages Market Share, By Distribution Channel, In USD Billion, 2016-2030F
- Figure 38. Europe Alcoholic Beverages Market, By Value, In USD Billion, 2016-2030F
- Figure 39. Europe Alcoholic Beverages Market, By Volume, In Units Thousand, 2016-2030F
- Figure 40. Europe Alcoholic Beverages Market Share, By Type, In USD Billion, 2016-2030F
- Figure 41. Europe Alcoholic Beverages Market Share, By Alcohol Content, In USD Billion, 2016-2030F
- Figure 42. Europe Alcoholic Beverages Market Share, By Packaging, In USD Billion, 2016-2030F
- Figure 43. Europe Alcoholic Beverages Market Share, By Category, In USD Billion, 2016-2030F
- Figure 44. Europe Alcoholic Beverages Market Share, By Distribution Channel, In USD Billion, 2016-2030F
- Figure 45. Europe Alcoholic Beverages Market Share, By Country, In USD Billion, 2016-2030F
- Figure 46. Germany Alcoholic Beverages Market, By Value, In USD Billion, 2016-2030F
- Figure 47. Germany Alcoholic Beverages Market, By Volume, In Units Thousand, 2016-2030F
- Figure 48. Germany Alcoholic Beverages Market Share, By Type, In USD Billion, 2016-2030F
- Figure 49. Germany Alcoholic Beverages Market Share, By Alcohol Content, In USD Billion, 2016-2030F
- Figure 50. Germany Alcoholic Beverages Market Share, By Packaging, In USD Billion, 2016-2030F
- Figure 51. Germany Alcoholic Beverages Market Share, By Category, In USD Billion, 2016-2030F
- Figure 52. Germany Alcoholic Beverages Market Share, By Distribution Channel, In USD Billion, 2016-2030F
- Figure 53. France Alcoholic Beverages Market, By Value, In USD Billion, 2016-2030F
- Figure 54. France Alcoholic Beverages Market, By Volume, In Units Thousand, 2016-2030F
- Figure 55. France Alcoholic Beverages Market Share, By Type, In USD Billion, 2016-2030F
- Figure 56. France Alcoholic Beverages Market Share, By Alcohol Content, In USD Billion, 2016-2030F
- Figure 57. France Alcoholic Beverages Market Share, By Packaging, In USD Billion, 2016-2030F
- Figure 58. France Alcoholic Beverages Market Share, By Category, In USD Billion, 2016-2030F
- Figure 59. France Alcoholic Beverages Market Share, By Distribution Channel, In USD Billion, 2016-2030F
- Figure 60. Italy Alcoholic Beverages Market, By Value, In USD Billion, 2016-2030F
- Figure 61. Italy Alcoholic Beverages Market, By Volume, In Units Thousand, 2016-2030F
- Figure 62. Italy Alcoholic Beverages Market Share, By Type, In USD Billion, 2016-2030F
- Figure 63. Italy Alcoholic Beverages Market Share, By Alcohol Content, In USD Billion, 2016-2030F
- Figure 64. Italy Alcoholic Beverages Market Share, By Packaging, In USD Billion, 2016-2030F
- Figure 65. Italy Alcoholic Beverages Market Share, By Category, In USD Billion, 2016-2030F
- Figure 66. Italy Alcoholic Beverages Market Share, By Distribution Channel, In USD Billion, 2016-2030F
- Figure 67. United Kingdom Alcoholic Beverages Market, By Value, In USD Billion, 2016-2030F
- Figure 68. United Kingdom Alcoholic Beverages Market, By Volume, In Units Thousand, 2016-2030F
- Figure 69. United Kingdom Alcoholic Beverages Market Share, By Type, In USD Billion, 2016-2030F
- Figure 70. United Kingdom Alcoholic Beverages Market Share, By Alcohol Content, In USD Billion, 2016-2030F
- Figure 71. United Kingdom Alcoholic Beverages Market Share, By Packaging, In USD Billion, 2016-2030F
- Figure 72. United Kingdom Alcoholic Beverages Market Share, By Category, In USD Billion, 2016-2030F
- Figure 73. United Kingdom Alcoholic Beverages Market Share, By Distribution Channel, In USD Billion, 2016-2030F
- Figure 74. Russia Alcoholic Beverages Market, By Value, In USD Billion, 2016-2030F
- Figure 75. Russia Alcoholic Beverages Market, By Volume, In Units Thousand, 2016-2030F
- Figure 76. Russia Alcoholic Beverages Market Share, By Type, In USD Billion, 2016-2030F
- Figure 77. Russia Alcoholic Beverages Market Share, By Alcohol Content, In USD Billion, 2016-2030F
- Figure 78. Russia Alcoholic Beverages Market Share, By Packaging, In USD Billion, 2016-2030F
- Figure 79. Russia Alcoholic Beverages Market Share, By Category, In USD Billion, 2016-2030F
- Figure 80. Russia Alcoholic Beverages Market Share, By Distribution Channel, In USD Billion, 2016-2030F
- Figure 81. Netherlands Alcoholic Beverages Market, By Value, In USD Billion, 2016-2030F
- Figure 82. Netherlands Alcoholic Beverages Market, By Volume, In Units Thousand, 2016-2030F
- Figure 83. Netherlands Alcoholic Beverages Market Share, By Type, In USD Billion, 2016-2030F
- Figure 84. Netherlands Alcoholic Beverages Market Share, By Alcohol Content, In USD Billion, 2016-2030F
- Figure 85. Netherlands Alcoholic Beverages Market Share, By Packaging, In USD Billion, 2016-2030F
- Figure 86. Netherlands Alcoholic Beverages Market Share, By Category, In USD Billion, 2016-2030F
- Figure 87. Netherlands Alcoholic Beverages Market Share, By Distribution Channel, In USD Billion, 2016-2030F
- Figure 88. Spain Alcoholic Beverages Market, By Value, In USD Billion, 2016-2030F
- Figure 89. Spain Alcoholic Beverages Market, By Volume, In Units Thousand, 2016-2030F
- Figure 90. Spain Alcoholic Beverages Market Share, By Type, In USD Billion, 2016-2030F
- Figure 91. Spain Alcoholic Beverages Market Share, By Alcohol Content, In USD Billion, 2016-2030F
- Figure 92. Spain Alcoholic Beverages Market Share, By Packaging, In USD Billion, 2016-2030F
- Figure 93. Spain Alcoholic Beverages Market Share, By Category, In USD Billion, 2016-2030F
- Figure 94. Spain Alcoholic Beverages Market Share, By Distribution Channel, In USD Billion, 2016-2030F
- Figure 95. Turkey Alcoholic Beverages Market, By Value, In USD Billion, 2016-2030F
- Figure 96. Turkey Alcoholic Beverages Market, By Volume, In Units Thousand, 2016-2030F
- Figure 97. Turkey Alcoholic Beverages Market Share, By Type, In USD Billion, 2016-2030F
- Figure 98. Turkey Alcoholic Beverages Market Share, By Alcohol Content, In USD Billion, 2016-2030F
- Figure 99. Turkey Alcoholic Beverages Market Share, By Packaging, In USD Billion, 2016-2030F
- Figure 100. Turkey Alcoholic Beverages Market Share, By Category, In USD Billion, 2016-2030F
- Figure 101. Turkey Alcoholic Beverages Market Share, By Distribution Channel, In USD Billion, 2016-2030F
- Figure 102. Poland Alcoholic Beverages Market, By Value, In USD Billion, 2016-2030F
- Figure 103. Poland Alcoholic Beverages Market, By Volume, In Units Thousand, 2016-2030F
- Figure 104. Poland Alcoholic Beverages Market Share, By Type, In USD Billion, 2016-2030F
- Figure 105. Poland Alcoholic Beverages Market Share, By Alcohol Content, In USD Billion, 2016-2030F
- Figure 106. Poland Alcoholic Beverages Market Share, By Packaging, In USD Billion, 2016-2030F
- Figure 107. Poland Alcoholic Beverages Market Share, By Category, In USD Billion, 2016-2030F
- Figure 108. Poland Alcoholic Beverages Market Share, By Distribution Channel, In USD Billion, 2016-2030F
- Figure 109. South America Alcoholic Beverages Market, By Value, In USD Billion, 2016-2030F
- Figure 110. South America Alcoholic Beverages Market, By Volume, In Units Thousand, 2016-2030F
- Figure 111. South America Alcoholic Beverages Market Share, By Type, In USD Billion, 2016-2030F
- Figure 112. South America Alcoholic Beverages Market Share, By Alcohol Content, In USD Billion, 2016-2030F
- Figure 113. South America Alcoholic Beverages Market Share, By Packaging, In USD Billion, 2016-2030F
- Figure 114. South America Alcoholic Beverages Market Share, By Category, In USD Billion, 2016-2030F
- Figure 115. South America Alcoholic Beverages Market Share, By Distribution Channel, In USD Billion, 2016-2030F
- Figure 116. South America Alcoholic Beverages Market Share, By Country, In USD Billion, 2016-2030F
- Figure 117. Brazil Alcoholic Beverages Market, By Value, In USD Billion, 2016-2030F
- Figure 118. Brazil Alcoholic Beverages Market, By Volume, In Units Thousand, 2016-2030F
- Figure 119. Brazil Alcoholic Beverages Market Share, By Type, In USD Billion, 2016-2030F
- Figure 120. Brazil Alcoholic Beverages Market Share, By Alcohol Content, In USD Billion, 2016-2030F
- Figure 121. Brazil Alcoholic Beverages Market Share, By Packaging, In USD Billion, 2016-2030F
- Figure 122. Brazil Alcoholic Beverages Market Share, By Category, In USD Billion, 2016-2030F
- Figure 123. Brazil Alcoholic Beverages Market Share, By Distribution Channel, In USD Billion, 2016-2030F
- Figure 124. Argentina Alcoholic Beverages Market, By Value, In USD Billion, 2016-2030F
- Figure 125. Argentina Alcoholic Beverages Market, By Volume, In Units Thousand, 2016-2030F
- Figure 126. Argentina Alcoholic Beverages Market Share, By Type, In USD Billion, 2016-2030F
- Figure 127. Argentina Alcoholic Beverages Market Share, By Alcohol Content, In USD Billion, 2016-2030F
- Figure 128. Argentina Alcoholic Beverages Market Share, By Packaging, In USD Billion, 2016-2030F
- Figure 129. Argentina Alcoholic Beverages Market Share, By Category, In USD Billion, 2016-2030F
- Figure 130. Argentina Alcoholic Beverages Market Share, By Distribution Channel, In USD Billion, 2016-2030F
- Figure 131. Asia-Pacific Alcoholic Beverages Market, By Value, In USD Billion, 2016-2030F
- Figure 132. Asia-Pacific Alcoholic Beverages Market, By Volume, In Units Thousand, 2016-2030F
- Figure 133. Asia-Pacific Alcoholic Beverages Market Share, By Type, In USD Billion, 2016-2030F
- Figure 134. Asia-Pacific Alcoholic Beverages Market Share, By Alcohol Content, In USD Billion, 2016-2030F
- Figure 135. Asia-Pacific Alcoholic Beverages Market Share, By Packaging, In USD Billion, 2016-2030F
- Figure 136. Asia-Pacific Alcoholic Beverages Market Share, By Category, In USD Billion, 2016-2030F
- Figure 137. Asia- Pacific Cream Market Share, By Distribution Channel, In USD Billion, 2016-2030F
- Figure 138. Asia-Pacific Alcoholic Beverages Market Share, By Country, In USD Billion, 2016-2030F
- Figure 139. India Alcoholic Beverages Market, By Value, In USD Billion, 2016-2030F
- Figure 140. India Alcoholic Beverages Market, By Volume, In Units Thousand, 2016-2030F
- Figure 141. India Alcoholic Beverages Market Share, By Type, In USD Billion, 2016-2030F
- Figure 142. India Alcoholic Beverages Market Share, By Alcohol Content, In USD Billion, 2016-2030F
- Figure 143. India Alcoholic Beverages Market Share, By Packaging, In USD Billion, 2016-2030F
- Figure 144. India Alcoholic Beverages Market Share, By Category, In USD Billion, 2016-2030F
- Figure 145. India Alcoholic Beverages Market Share, By Distribution Channel, In USD Billion, 2016-2030F
- Figure 146. China Alcoholic Beverages Market, By Value, In USD Billion, 2016-2030F
- Figure 147. China Alcoholic Beverages Market, By Volume, In Units Thousand, 2016-2030F
- Figure 148. China Alcoholic Beverages Market Share, By Type, In USD Billion, 2016-2030F
- Figure 149. China Alcoholic Beverages Market Share, By Alcohol Content, In USD Billion, 2016-2030F
- Figure 150. China Alcoholic Beverages Market Share, By Packaging, In USD Billion, 2016-2030F
- Figure 151. China Alcoholic Beverages Market Share, By Category, In USD Billion, 2016-2030F
- Figure 152. China Alcoholic Beverages Market Share, By Distribution Channel, In USD Billion, 2016-2030F
- Figure 153. Japan Alcoholic Beverages Market, By Value, In USD Billion, 2016-2030F
- Figure 154. Japan Alcoholic Beverages Market, By Volume, In Units Thousand, 2016-2030F
- Figure 155. Japan Alcoholic Beverages Market Share, By Type, In USD Billion, 2016-2030F
- Figure 156. Japan Alcoholic Beverages Market Share, By Alcohol Content, In USD Billion, 2016-2030F
- Figure 157. Japan Alcoholic Beverages Market Share, By Packaging, In USD Billion, 2016-2030F
- Figure 158. Japan Alcoholic Beverages Market Share, By Category, In USD Billion, 2016-2030F
- Figure 159. Japan Alcoholic Beverages Market Share, By Distribution Channel, In USD Billion, 2016-2030F
- Figure 160. Australia Alcoholic Beverages Market, By Value, In USD Billion, 2016-2030F
- Figure 161. Australia Alcoholic Beverages Market, By Volume, In Units Thousand, 2016-2030F
- Figure 162. Australia Alcoholic Beverages Market Share, By Type, In USD Billion, 2016-2030F
- Figure 163. Australia Alcoholic Beverages Market Share, By Alcohol Content, In USD Billion, 2016-2030F
- Figure 164. Australia Alcoholic Beverages Market Share, By Packaging, In USD Billion, 2016-2030F
- Figure 165. Australia Alcoholic Beverages Market Share, By Category, In USD Billion, 2016-2030F
- Figure 166. Australia Alcoholic Beverages Market Share, By Distribution Channel, In USD Billion, 2016-2030F
- Figure 167. Vietnam Alcoholic Beverages Market, By Value, In USD Billion, 2016-2030F
- Figure 168. Vietnam Alcoholic Beverages Market, By Volume, In Units Thousand, 2016-2030F
- Figure 169. Vietnam Alcoholic Beverages Market Share, By Type, In USD Billion, 2016-2030F
- Figure 170. Vietnam Alcoholic Beverages Market Share, By Alcohol Content, In USD Billion, 2016-2030F
- Figure 171. Vietnam Alcoholic Beverages Market Share, By Packaging, In USD Billion, 2016-2030F
- Figure 172. Vietnam Alcoholic Beverages Market Share, By Category, In USD Billion, 2016-2030F
- Figure 173. Vietnam Alcoholic Beverages Market Share, By Distribution Channel, In USD Billion, 2016-2030F
- Figure 174. South Korea Alcoholic Beverages Market, By Value, In USD Billion, 2016-2030F
- Figure 175. South Korea Alcoholic Beverages Market, By Volume, In Units Thousand, 2016-2030F
- Figure 176. South Korea Alcoholic Beverages Market Share, By Type, In USD Billion, 2016-2030F
- Figure 177. South Korea Alcoholic Beverages Market Share, By Alcohol Content, In USD Billion, 2016-2030F
- Figure 178. South Korea Alcoholic Beverages Market Share, By Packaging, In USD Billion, 2016-2030F
- Figure 179. South Korea Alcoholic Beverages Market Share, By Category, In USD Billion, 2016-2030F
- Figure 180. South Korea Alcoholic Beverages Market Share, By Distribution Channel, In USD Billion, 2016-2030F
- Figure 181. Indonesia Alcoholic Beverages Market, By Value, In USD Billion, 2016-2030F
- Figure 182. Indonesia Alcoholic Beverages Market, By Volume, In Units Thousand, 2016-2030F
- Figure 183. Indonesia Alcoholic Beverages Market Share, By Type, In USD Billion, 2016-2030F
- Figure 184. Indonesia Alcoholic Beverages Market Share, By Alcohol Content, In USD Billion, 2016-2030F
- Figure 185. Indonesia Alcoholic Beverages Market Share, By Packaging, In USD Billion, 2016-2030F
- Figure 186. Indonesia Alcoholic Beverages Market Share, By Category, In USD Billion, 2016-2030F
- Figure 187. Indonesia Alcoholic Beverages Market Share, By Distribution Channel, In USD Billion, 2016-2030F
- Figure 188. Philippines Alcoholic Beverages Market, By Value, In USD Billion, 2016-2030F
- Figure 189. Philippines Alcoholic Beverages Market, By Volume, In Units Thousand, 2016-2030F
- Figure 190. Philippines Alcoholic Beverages Market Share, By Type, In USD Billion, 2016-2030F
- Figure 191. Philippines Alcoholic Beverages Market Share, By Alcohol Content, In USD Billion, 2016-2030F
- Figure 192. Philippines Alcoholic Beverages Market Share, By Packaging, In USD Billion, 2016-2030F
- Figure 193. Philippines Alcoholic Beverages Market Share, By Category, In USD Billion, 2016-2030F
- Figure 194. Philippines Alcoholic Beverages Market Share, By Distribution Channel, In USD Billion, 2016-2030F
- Figure 195. Middle East & Africa Alcoholic Beverages Market, By Value, In USD Billion, 2016-2030F
- Figure 196. Middle East & Africa Alcoholic Beverages Market, By Volume, In Units Thousand, 2016-2030F
- Figure 197. Middle East & Africa Alcoholic Beverages Market Share, By Type, In USD Billion, 2016-2030F
- Figure 198. Middle East & Africa Alcoholic Beverages Market Share, By Type, In Units Thousand, 2016-2030F
- Figure 199. Middle East & Africa Alcoholic Beverages Market Share, By Alcohol Content, In USD Billion, 2016-2030F
- Figure 200. Middle East & Africa Alcoholic Beverages Market Share, By Packaging, In USD Billion, 2016-2030F
- Figure 201. Middle East & Africa Alcoholic Beverages Market Share, By Category, In USD Billion, 2016-2030F
- Figure 202. Middle East & Africa Alcoholic Beverages Market Share, By Distribution Channel, In USD Billion, 2016-2030F
- Figure 203. Middle East & Africa Alcoholic Beverages Market Share, By Country, In USD Billion, 2016-2030F
- Figure 204. Saudi Arabia Alcoholic Beverages Market, By Value, In USD Billion, 2016-2030F
- Figure 205. Saudi Arabia Alcoholic Beverages Market, By Volume, In Units Thousand, 2016-2030F
- Figure 206. Saudi Arabia Alcoholic Beverages Market Share, By Type, In USD Billion, 2016-2030F
- Figure 207. Saudi Arabia Alcoholic Beverages Market Share, By Alcohol Content, In USD Billion, 2016-2030F
- Figure 208. Saudi Arabia Alcoholic Beverages Market Share, By Packaging, In USD Billion, 2016-2030F
- Figure 209. Saudi Arabia Alcoholic Beverages Market Share, By Category, In USD Billion, 2016-2030F
- Figure 210. Saudi Arabia Alcoholic Beverages Market Share, By Distribution Channel, In USD Billion, 2016-2030F
- Figure 211. UAE Alcoholic Beverages Market, By Value, In USD Billion, 2016-2030F
- Figure 212. UAE Alcoholic Beverages Market, By Volume, In Units Thousand, 2016-2030F
- Figure 213. UAE Alcoholic Beverages Market Share, By Type, In USD Billion, 2016-2030F
- Figure 214. UAE Alcoholic Beverages Market Share, By Alcohol Content, In USD Billion, 2016-2030F
- Figure 215. UAE Alcoholic Beverages Market Share, By Packaging, In USD Billion, 2016-2030F
- Figure 216. UAE Alcoholic Beverages Market Share, By Category, In USD Billion, 2016-2030F
- Figure 217. UAE Alcoholic Beverages Market Share, By Distribution Channel, In USD Billion, 2016-2030F
- Figure 218. South Africa Alcoholic Beverages Market, By Value, In USD Billion, 2016-2030F
- Figure 219. South Africa Alcoholic Beverages Market, By Volume, In Units Thousand, 2016-2030F
- Figure 220. South Africa Alcoholic Beverages Market Share, By Type, In USD Billion, 2016-2030F
- Figure 221. South Africa Alcoholic Beverages Market Share, By Alcohol Content, In USD Billion, 2016-2030F
- Figure 222. South Africa Alcoholic Beverages Market Share, By Packaging, In USD Billion, 2016-2030F
- Figure 223. South Africa Alcoholic Beverages Market Share, By Category, In USD Billion, 2016-2030F
- Figure 224. South Africa Alcoholic Beverages Market Share, By Distribution Channel, In USD Billion, 2016-2030F
- Figure 225. By Type Map-Market Size (USD Billion) & Growth Rate (%), 2022
- Figure 226. By Alcohol Content Map-Market Size (USD Billion) & Growth Rate (%), 2022
- Figure 227. By Packaging Map-Market Size (USD Billion) & Growth Rate (%), 2022
- Figure 228. By Category Map-Market Size (USD Billion) & Growth Rate (%), 2022
- Figure 229. By Distribution Channel Map-Market Size (USD Billion) & Growth Rate (%), 2022
- Figure 230. By Region Map-Market Size (USD Billion) & Growth Rate (%), 2022
Global Alcoholic Beverages Market size was estimated at USD 1.71 trillion in 2022 and is projected to reach USD 2.34 trillion by 2030, growing at a CAGR of 4.01% for the forecast period between 2023 to 2030. One of the main drivers of the market's expansion is the increased demand for alcoholic beverages to ease the tension and anxiety brought on by busy lives and stressful job schedules coupled with growing consumption trends among women. Additionally, a positive market outlook is being provided by the rising consumption of alcoholic beverages as a result of the expansion of cafes, pubs, clubs, bars, hotels, and restaurants around the world. Additionally, there is a growing demand among the general public worldwide for premium, low ABV (alcohol by volume) ready-to-drink (RTD) alcoholic beverages. This is accelerating the market's growth and the rising trend of socializing and weekend gatherings among people.
In addition, the widespread accessibility of alcoholic beverages through various distribution channels, including hypermarkets, supermarkets, specialty, convenience, and online stores, provides industry operators with lucrative expansion potential. The market is being positively impacted by the younger generation's rising demand for flavored alcoholic beverages. Apart from this, the market is expanding because of the growing popularity of beer, which helps people keep a healthy digestive tract.
Furthermore, the alcoholic beverages market is anticipated to grow due to the surging demand for artisanal spirits in emerging economies like China and India. Additionally, there is an opportunity for the market to capitalize on the increasing demand for value-added hard seltzer products at competitive prices. However, the industry expansion is hindered by the rising preference for non-alcoholic beverages. To cater to health-conscious consumers, major players are now focusing on introducing cordials and alcoholic beverages with lower alcohol content. In August 2021, Hola Beer with Lime (0.5% ABV), one of the healthiest low-alcohol beers, was introduced to the low and no-alcohol category by Loah Beer Co. Aiming, especially at a 0.5% ABV, the new Hola Beer with Lime is brewed with all the same yeast, hops, and malts as alcoholic beer. It also has one of the lowest calorie and sugar contents of any low-alcohol beer currently available in the UK market.
Growing Popularity of Premium and Super-Premium Alcoholic Beverages
Global consumers today have more refined tastes and are constantly searching for unique and excellent alcoholic beverages resulting in greater market demand for alcoholic beverages of the highest caliber. In 2021 , 21.7 million 9-liter cases of premium whisky and 21.1 million 9-liter cases of premium vodka were consumed, as per the data by the Distilled Spirits Council of the United States. Additionally, Super-premium whisky and vodka both experienced year-over-year growth rates of 14.1% and 13.9%, respectively.
Functional premium alcoholic beverages have been developed as a result of the increase in health consciousness. Alcohol tends to have better functional qualities when various natural and exotic components are included, which attracts a wider range of consumers. For instance, the premium gin brand Whitley Neill in the United Kingdom introduced Oriental Spiced Gin as a new gin variety in March 2022. This gin contains a variety of botanicals and spices, including grains of paradise, coriander, ginger, chilli, cumin, saffron, and chilli. As a result, market demand is anticipated to be driven by the growing popularity of premium and super-premium alcoholic beverages throughout the forecast period.
Changing Lifestyles
People in emerging economies are experimenting with new forms of entertainment like nightclubs and pub hopping due to the growing urban population and increased disposable incomes. Additionally, sales of alcoholic beverages are driven by young individuals with wealthy families, substantial social media influence, and simple access to alcohol. Urban areas have more alcoholic beverage usage because of stressful employment and the idea that alcohol calms the mind, drives the demand for these beverages. Manufacturers of alcoholic beverages are often adding new flavours to their products. Customers are intrigued to test these products, which are appropriate for the alcoholic beverage business, especially millennials. To take benefit from the growing millennial population, in October 2022, three limited-edition unique experimental brews were created by Carlsberg Breweries A/S to mark the company's 175th anniversary.
Government Regulations/Initiatives
Governments typically require alcoholic beverage producers, distributors, and retailers to obtain licenses and permits to operate legally. These licenses may be specific to different types of alcoholic beverages, such as beer, wine, or spirits. The application process and requirements for obtaining licenses vary, including factors such as age restrictions, background checks, and adherence to specific regulations. Governments set standards for the production, quality, and safety of alcoholic beverages. The labelling requirements often include details such as alcohol content, ingredients, allergen information, health warnings, and origin. Age restrictions are enforced for the purchase and consumption of alcoholic beverages. The legal drinking age varies globally, aiming to protect public health and prevent underage drinking. Alcoholic beverages are subject to taxation and excise duties imposed by governments. The rates and structures of these taxes vary across countries and can significantly impact pricing, profitability, and consumer demand. Governments use taxation as a means to generate revenue and regulate alcohol consumption.
North America Expected to be the Fastest-Growing Market
This region leads the alcoholic beverage sector because a large majority of the population in North America is under the age of 25. Over the course of the forecast period, the market for alcoholic beverages is anticipated to grow due to the increased demand for premium alcoholic beverages. Due to rising disposable income, it is projected that the North American alcohol market will expand significantly. In the upcoming years, developing nations are anticipated to dominate the region's alcoholic beverage market. Due to customer perceptions of craft spirits as premium quality and the national notion of mindful drinking, craft beer and craft spirits are the segments with the strongest growth rates.
Wine consumption in North America has also been steadily increasing. The region has seen a rise in wine appreciation and wine culture, with consumers exploring a wide variety of wines from different regions and grape varieties. This trend has been supported by wine tourism, wine clubs, and a growing interest in wine education. According to the Wine Institute, a total of 822 million gallons of wine were consumed in the United States in 2022.
Impact of COVID-19
People's drinking patterns have substantially changed since the COVID-19 pandemic, shifting from pubs and restaurants to their homes. Alcohol is a common component of people's social lives, which COVID-19 has drastically affected. Overall, a few people did not change their drinking habits, but among those who did, their consumption increased by a larger percentage. According to early figures on government tax receipts, alcohol sales in Germany, the United Kingdom, and the United States rose by 3% to 5% in 2020 compared to 2019. This industry was badly impacted by the sharp decline in alcohol sales in bars and restaurants, while off-premises sales, such as those made in retail and online businesses, saw tremendous growth. For instance, online sales rose up to 234% in the United States.
Key Players Landscape and Outlook
The market is extremely competitive, and large competitors hold sizable market shares. Diageo, Anheuser-Busch InBev, Heineken Holding NV, Bacardi Limited, and Constellation Brands are some of the industry's biggest participants. The players in the market for alcoholic beverages employ a variety of business strategies to boost sales. These strategies include joint ventures, product innovations, and mergers and acquisitions. For instance, in March 2023, Pernod Ricard USA announced buying a majority stake in a flavored American Whiskey brand Skrewball. In the same month in 2023, Diageo completed its acquisition of a Philippines' dark rum- Don Papa Rum.
Table of Contents
1. Research Methodology
2. Project Scope & Definitions
3. Impact of COVID-19 on Global Alcoholic Beverages Market
4. Executive Summary
5. Voice of Customer
- 5.1. Demographics (Age/Cohort Analysis - Baby Boomers and Gen X, Millennials, Gen Z; Gender; Income - Low, Mid and High; Geography; Nationality; etc.)
- 5.2. Market Awareness and Product Information
- 5.3. Brand Awareness and Loyalty
- 5.4. Factors Considered in Purchase Decision
- 5.4.1. Brand Name
- 5.4.2. Pack Size
- 5.4.3. Price
- 5.4.4. Customisation Options
- 5.4.5. Packaging Type
- 5.4.6. Promotional Offers & Discounts
- 5.5. Purpose of Purchase (Personal Use, Gifting)
- 5.6. Frequency of Purchase
- 5.7. Medium of Purchase
- 5.8. Role of Brand Ambassador or Influencer Marketing on Product/Brand Absorption
6. Global Alcoholic Beverages Market Outlook, 2016-2030F
- 6.1. Market Size & Forecast
- 6.1.1. By Value
- 6.1.2. By Volume
- 6.2. By Type
- 6.2.1. Beer
- 6.2.2. Wine
- 6.2.3. Spirits
- 6.2.4. Ciders and Flavoured Alcoholic Beverages (FABs)
- 6.2.5. Others
- 6.3. By Alcohol Content
- 6.3.1. High
- 6.3.2. Medium
- 6.3.3. Low
- 6.4. By Packaging
- 6.4.1. Aluminium Cans/Tins
- 6.4.2. Pouch Packaging
- 6.4.3. Glass Bottles
- 6.4.4. Plastic Bottles
- 6.4.5. Others
- 6.5. By Category
- 6.5.1. Mass
- 6.5.2. Premium
- 6.6. By Distribution Channel
- 6.6.1. Convenience Stores
- 6.6.2. On Premises
- 6.6.3. Liquor Stores
- 6.6.4. Grocery Shops
- 6.6.5. Internet Retailing
- 6.6.6. Supermarkets
- 6.6.7. Others
- 6.7. By Region
- 6.7.1. North America
- 6.7.2. Europe
- 6.7.3. South America
- 6.7.4. Asia-Pacific
- 6.7.5. Middle East and Africa
- 6.8. By Company Market Share (%), 2022
7. Global Alcoholic Beverages Market Outlook, By Region, 2016-2030F
- 7.1. North America*
- 7.1.1. By Type
- 7.1.1.1. Beer
- 7.1.1.2. Wine
- 7.1.1.3. Spirits
- 7.1.1.4. Ciders and Flavoured Alcoholic Beverages (FABs)
- 7.1.1.5. Others
- 7.1.2. By Alcohol Content
- 7.1.2.1. High
- 7.1.2.2. Medium
- 7.1.2.3. Low
- 7.1.3. By Packaging
- 7.1.3.1. Aluminium Cans/Tins
- 7.1.3.2. Pouch Packaging
- 7.1.3.3. Glass Bottles
- 7.1.3.4. Plastic Bottles
- 7.1.3.5. Others
- 7.1.4. By Category
- 7.1.4.1. Mass
- 7.1.4.2. Premium
- 7.1.5. By Distribution Channel
- 7.1.5.1. Convenience Stores
- 7.1.5.2. On Premises
- 7.1.5.3. Liquor Stores
- 7.1.5.4. Grocery Shops
- 7.1.5.5. Internet Retailing
- 7.1.5.6. Supermarkets
- 7.1.5.7. Others
- 7.1.6. United States*
- 7.1.6.1. By Type
- 7.1.6.1.1. Beer
- 7.1.6.1.2. Wine
- 7.1.6.1.3. Spirits
- 7.1.6.1.4. Ciders and Flavoured Alcoholic Beverages (FABs)
- 7.1.6.1.5. Others
- 7.1.6.2. By Alcohol Content
- 7.1.6.3. High
- 7.1.6.4. Medium
- 7.1.6.5. Low
- 7.1.6.6. By Packaging
- 7.1.6.6.1. Aluminium Cans/Tins
- 7.1.6.6.2. Pouch Packaging
- 7.1.6.6.3. Glass Bottles
- 7.1.6.6.4. Plastic Bottles
- 7.1.6.6.5. Others
- 7.1.6.7. By Category
- 7.1.6.7.1. Mass
- 7.1.6.7.2. Premium
- 7.1.6.8. By Distribution Channel
- 7.1.6.8.1. Convenience Stores
- 7.1.6.8.2. On Premises
- 7.1.6.8.3. Liquor Stores
- 7.1.6.8.4. Grocery Shops
- 7.1.6.8.5. Internet Retailing
- 7.1.6.8.6. Supermarkets
- 7.1.6.8.7. Others
- 7.1.7. Canada
- 7.1.8. Mexico
- 7.1.1. By Type
All segments will be provided for all regions and countries covered
- 7.2. Europe
- 7.2.1. Germany
- 7.2.2. France
- 7.2.3. Italy
- 7.2.4. United Kingdom
- 7.2.5. Russia
- 7.2.6. Netherlands
- 7.2.7. Spain
- 7.2.8. Turkey
- 7.2.9. Poland
- 7.3. South America
- 7.3.1. Brazil
- 7.3.2. Argentina
- 7.4. Asia-Pacific
- 7.4.1. India
- 7.4.2. China
- 7.4.3. Japan
- 7.4.4. Australia
- 7.4.5. Vietnam
- 7.4.6. South Korea
- 7.4.7. Indonesia
- 7.4.8. Philippines
- 7.5. Middle East & Africa
- 7.5.1. UAE
- 7.5.2. South Africa
- 7.5.3. Others
8. Market Mapping, 2022
- 8.1. By Type
- 8.2. By Alcohol Content
- 8.3. By Packaging
- 8.4. By Category
- 8.5. By Distribution Channel
- 8.6. By Region
9. Macro Environment and Industry Structure
- 9.1. Supply Demand Analysis
- 9.2. Import Export Analysis
- 9.3. Value Chain Analysis
- 9.4. PESTEL Analysis
- 9.4.1. Political Factors
- 9.4.2. Economic System
- 9.4.3. Social Implications
- 9.4.4. Technological Advancements
- 9.4.5. Environmental Impacts
- 9.4.6. Legal Compliances and Regulatory Policies (Statutory Bodies Included)
- 9.5. Porter's Five Forces Analysis
- 9.5.1. Supplier Power
- 9.5.2. Buyer Power
- 9.5.3. Substitution Threat
- 9.5.4. Threat from New Entrant
- 9.5.5. Competitive Rivalry
10. Market Dynamics
- 10.1. Growth Drivers
- 10.2. Growth Inhibitors (Challenges and Restraints)
11. Key Players Landscape
- 11.1. Competition Matrix of Top Five Market Leaders
- 11.2. Market Revenue Analysis of Top Five Market Leaders (in %, 2022)
- 11.3. Mergers and Acquisitions/Joint Ventures (If Applicable)
- 11.4. SWOT Analysis (For Five Market Players)
- 11.5. Patent Analysis (If Applicable)
12. Pricing Analysis
13. Case Studies
14. Key Players Outlook
- 14.1. Anheuser-Busch InBev SA/NV
- 14.1.1. Company Details
- 14.1.2. Key Management Personnel
- 14.1.3. Products & Services
- 14.1.4. Financials (As reported)
- 14.1.5. Key Market Focus & Geographical Presence
- 14.1.6. Recent Developments
- 14.2. Bacardi Limited
- 14.3. Heineken NV
- 14.4. Constellation Brands, Inc.
- 14.5. Diageo plc
- 14.6. Carlsberg A/S
- 14.7. Molson Coors Beverage Company
- 14.8. Pernod Ricard SA
- 14.9. Olvi plc
- 14.10. Suntory Group
