|
|
市場調査レポート
商品コード
1593159
ネットワーク事業者の設備投資見通し (2024年第4四半期版):通信事業者は横ばいだが、生成AI主導データセンターのハイプが2024年の通信設備投資を6,000億米ドル超に押し上げ、2028年にはウェブスケーラーが市場をリードする見通しNetwork Operator Capex Forecast - 4Q24 Edition: Telco Flatlines but GenAI-driven Data Center Hype Drives Comms Capex above $600B in 2024, Webscale will Lead Market by 2028 |
||||||
|
|||||||
|
|||||||


| ネットワーク事業者の設備投資見通し (2024年第4四半期版):通信事業者は横ばいだが、生成AI主導データセンターのハイプが2024年の通信設備投資を6,000億米ドル超に押し上げ、2028年にはウェブスケーラーが市場をリードする見通し |
|
出版日: 2024年11月15日
発行: MTN Consulting, LLC
ページ情報: 英文
納期: 即納可能
|

全表示
- 概要
- 目次
当レポートでは、通信事業者、ウェブスケーラー、CNNO (キャリアニュートラルネットワーク事業者) の3セグメントの事業者グループを含むネットワーク事業者市場の最新予測を提供しています。当レポートでは、175社以上の事業者を四半期ごとにカバーし、2024年第3四半期末までの市場実態を反映しています。予測には、全セグメントの収益、設備投資、従業員数の合計と、各セグメントごとの追加指標が含まれています。
2024年における3つの事業者グループによる収益規模は4兆4,800億米ドル (2023年:4兆2,700億米ドル) であり、また、設備投資額は6,120億米ドル (2023年:5,480億米ドル) 、従業員数は886万人 (2023年:881万人) と予測されています。
ビジュアル
レポートハイライト:
ベンダーアドレサブル市場:技術ベンダーは、GPUサーバーチップから光ファイバースプライスエンクロージャー、無線アンテナ、ネットワーク構築、クラウドソフトウェアに至るまで、本予測で追跡している3つの事業者セグメントそれぞれにさまざまな製品とサービスを販売しています。このような製品は、GPUサーバーチップ、光ファイバー接続用筐体、無線アンテナ、ネットワーク構築、クラウドソフトウェアなど、あらゆる種類のものが含まれます。
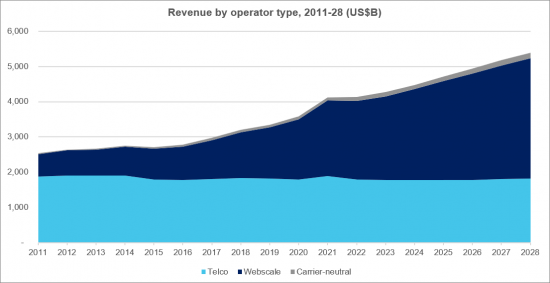
2011年の3セグメントによる設備投資総額は3,360億米ドルで、その90%が通信事業者でした。2028年には、3セグメントの設備投資総額は6,380億米ドルに達し、そのうち通信事業者が占める割合は44%にとどまると予測されています。CNNOの設備投資額は2011年にはわずか60億米ドルでしたが、2028年には約540億米ドルに達すると予測されています。2011年、ウェブスケールの設備投資額は290億米ドルで、通信事業者市場の8%に相当しました。2023年には1,930億米ドル (全体の35%) に達し、現在はAI/生成AIの需要が新たな上昇サイクルによってウェブスケールが活況であり、2028年には初めて通信事業者を上回り、全体の48%にあたる3,030億米ドルに達すると予測されています。
言及された企業
|
|
目次
主なセクションは次のとおりです:
- 1.レポートハイライト
- 2.サマリー
- 3.ネットワーク事業者の合計
- 4.通信事業者
- 5.通信事業者- 地域別分割
- 6.ウェブスケール
- 7.CNNO
- 8.大手通信事業者の支出見通し
- 9.当社について
「合計」タブの数値のリストは次のとおりです:
- セグメント別設備投資予測:2024年第4四半期と2023年12月予測の差 (%)
- セグメント別設備投資予測:2024年第4四半期と2023年12月予測の差 (金額)
- 全事業者の収益成長率:新旧予測
- 通信事業者の収益成長率:新旧予測の比較
- 資本集約度:通信事業者:新旧予測
- 資本集約度:ウェブスケーラー:新旧予測
- 資本集約度:CNNO:新旧予測
- 事業者タイプ別収益
- 事業者タイプ別設備投資額
- 事業者タイプ別設備投資額
- 事業者タイプ別資本集約度
- 事業者タイプ別従業員数
- 事業者タイプ別の従業員当たりの収益
- ネットワーク事業者の収益 (タイプ別) 、世界のGDPに対する割合 (%)
- ネットワーク事業者従業員数 、世界人口の割合
- 通信事業者の収益と加入者あたりの設備投資額
- 支出額上位50社の事業者、2024年第2四半期の設備投資額
- 長期資本集約度に基づく上位50事業者 (2019年第3四半期~2024年第2四半期の平均)
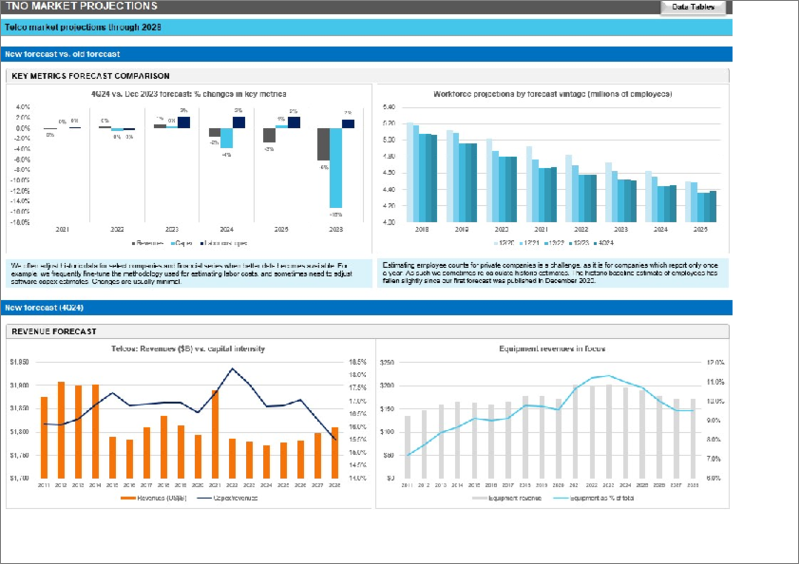
This forecast presents our latest projections for the network operator market, spanning telecommunications operators (telcos), webscalers, and carrier-neutral network operators (CNNOs). The forecast is based on our quarterly coverage of over 175 operators, and reflects market realities through the end of 3Q24. Our forecast includes revenues, capex and employee totals for all segments, and additional metrics for each individual segment. In 2024, we expect the three operator groups to account for $4.48 trillion (T) in revenues (2023: $4.27T), $612 billion (B) in capex (2023: $548B), and 8.86 million (M) employees (2023: 8.81M). This report provides 2011-23 actuals and projections through 2028, and includes projections from the most recent full forecast (12/23) for reference.
VISUALS
Below are the key highlights of the report:
Vendor addressable market: Tech vendors sell various products and services to each of the three operator segments tracked in this forecast - everything from GPU server chips to fiber optic splice enclosures to radio antennas to network construction to cloud software. Their addressable market is directly related to capex, which captures most external technology purchases including a large portion of software & services expenses. In 2011, the starting point of our coverage, total three segment capex was $336 billion, 90% of which was telco. By 2028, three segment capex will reach $638 billion, and telco will account for only 44% of the total. In the intervening years, an important segment of third-party neutral operators of network capacity and space has evolved; CNNO capex was just $6B in 2011 but will hit about $54B by 2028. But the real story of the market is webscale: capex spend by webscalers has surged multiple times as these tech companies innovate, scale and capture more of the world's digital value. In 2011, webscale capex was $29B, or 8% of the comms operator market. In 2023, it reached $193B (35% of total), and AI/GenAI demand is currently fueling it through another up cycle, which will push webscale to about $303B by 2028, or 48% of total (and more than telco for the first time).
Telco
This report includes region- and country-level projections for the telecommunications network operator (TNO, or telco) market. These projections are based upon MTN Consulting's quarterly coverage of 140 telcos across the globe, spanning 1Q11 through 2Q24. For 2024, we expect global telco revenues of $1,772 billion (flat versus 2023), capex of $297B (down 5% YoY), and employees of 4.457 million (down 1.2% YoY). Labor costs per employee in 2024 will be about $60.8K, up from $58.7K in 2023.
Webscale
This report includes projections for the growth and development of the webscale network operator (WNO, or webscale) market. The projections are based on our quarterly coverage of 21 webscalers, spanning 1Q11-2Q24, and they break out China from the rest of the globe. For 2024, we expect global webscale revenues of $2,584 billion, up 9% YoY, $311B in R&D spending (+6% YoY), $267 billion in capex (+39% YoY), and 4.284 million employees (+2.4% YoY). Our forecast for webscale capex has significantly increased since the last update in late 2023. However, the unusual spike in capex underway in 2024 will be followed by two years of decline.
Carrier-neutral
This report also includes projections for the growth and development of the carrier-neutral network operator (CNNO) market. The CNNO market is the smallest of three operator segments tracked by MTN Consulting, but CNNOs play a crucial, complementary role in the communications sector and own and operate a large portion of the world's cell towers, data centers, and fiber networks. Our CNNO projections are based upon quarterly tracking of 47 CNNOs across the globe. Our CNNO tracking is focused on publicly traded companies but we also attempt to capture the significant private equity-led activity in this sector. In 2024, we expect CNNO revenues to total about $125B (+4% YoY), capex of $48B (+16% YoY), and about 120K employees (flat YoY). CNNOs' asset base includes over 1,500 data centers, 3.3 million cell towers, and 1.1 million fiber route miles.
Companies mentioned:
|
|
Table of Contents
Key sections include:
- 1. Report Highlights
- 2. Summary
- 3. Network Operator Totals
- 4. Telco
- 5. Telco - Regional Splits
- 6. Webscale
- 7. Carrier-neutral (CNNO)
- 8. Spending outlook for top operators
- 9. About
This report has a large number of figures on each of the main result tabs: totals, telco, telco - regional splits, webscale, and carrier-neutral (CNNO). For a full list of figures please contact us.
Here is a list of figures on the "Totals" tab:
- Capex forecast by segment: 4Q24 v. Dec 2023 forecasts, % difference
- Capex forecast by segment: 4Q24 v. Dec 2023 forecasts, $B difference
- Revenue growth rates, all operators: New vs. old forecast
- Revenue growth rates, Telcos: New vs. old forecast
- Capital intensity, Telcos: New vs. old forecast
- Capital intensity, Webscalers: New vs. old forecast
- Capital intensity, Carrier-neutral operators: New vs. old forecast
- Revenue by operator type, 2011-28 (US$B)
- Capex by operator type, 2011-28 (US$B)
- Capex by operator type, 2011-28: % of total
- Capital intensity by operator type, 2011-28
- Employees by operator type (M)
- Revenues/employee by operator type (US$K)
- Network operator revenues by type, % global GDP
- Network operator employees (M), and % global population
- Telco revenues and capex per sub, 2011-22
- Top 50 spending operators, annualized 2Q24 capex ($B)
- Top 50 operators based on long-term capital intensity (3Q19-2Q24 avg)
