デフォルト表紙
市場調査レポート
商品コード
1440534

尿素:世界市場シェア分析、業界動向と統計、成長予測(2024~2030年)

Global Urea - Market Share Analysis, Industry Trends & Statistics, Growth Forecasts (2024 - 2030)

出版日: | 発行: Mordor Intelligence | ページ情報: 英文 80 Pages | 納期: 2~3営業日

● お客様のご希望に応じて、既存データの加工や未掲載情報(例:国別セグメント)の追加などの対応が可能です。  詳細はお問い合わせください。

価格
価格表記: USDを日本円(税抜)に換算
本日の銀行送金レート: 1USD=155.86円
尿素:世界市場シェア分析、業界動向と統計、成長予測(2024~2030年)
出版日: 2024年02月15日
発行: Mordor Intelligence
ページ情報: 英文 80 Pages
納期: 2~3営業日
ご注意事項 :
本レポートは最新情報反映のため適宜更新し、内容構成変更を行う場合があります。ご検討の際はお問い合わせください。
  • 全表示
  • 概要
  • 目次
概要

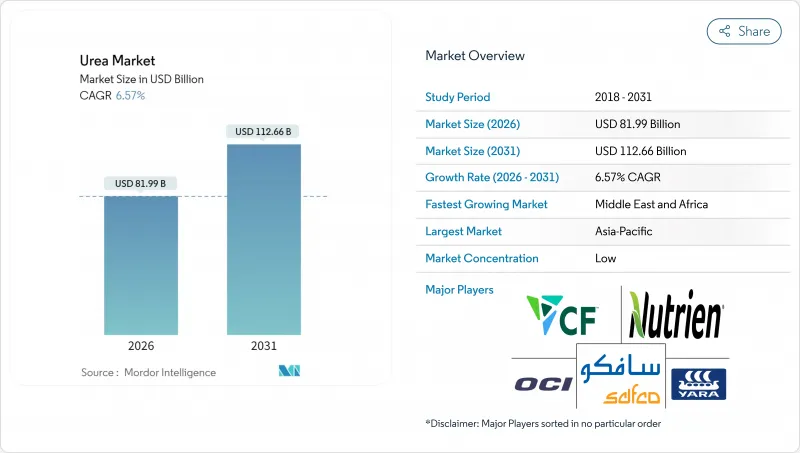
世界の尿素市場規模は、2024年に720億7,000万米ドルと推定され、2030年までに1,067億2,000万米ドルに達すると予測されており、予測期間(2024年から2030年)中に6.76%のCAGRで成長します。

世界の尿素-市場

主なハイライト

  • タイプ別最大- ストレート:窒素は作物の成長にとって収量を最も制限する栄養素であり、農家はその使用法に高度に適応しているため、従来の尿素は世界中で最も消費されている肥料です。
  • コーティングタイプ別最大- ポリマーコーティング:ポリマーコーティングされた肥料は、より長期間にわたって栄養素を放出し、土壌中の肥料の浸出損失を減らします。また、申請率も低下します。
  • 作物の種類別最大- 畑作物: 畑作物は世界中で広く栽培されており、世界の多くの地域で主食となっています。ほとんどの農業国では、それらが面積当たり最大のシェアを占めています。

尿素市場動向

畑作物は作物タイプ別の最大のセグメントです。

  • 畑作物は、平均して、他の作物タイプよりも多くの窒素を必要とします。畑作物の栽培は世界の情勢を支配しており、全農地の95.0%以上を占めています。米、小麦、トウモロコシは世界で最も重要な畑作物であり、総農地の約38.0%を占めています。畑作物は世界の尿素市場で大半を占めており、市場価値の約86.1%を占め、2021年には約392億7,000万米ドルに達します。畑作物の市場はアジア太平洋地域が独占しています。
  • 園芸作物は尿素肥料の市場総額の約10.7%を占め、2021年には約49億6,000万米ドルに達しました。世界中で果物と野菜の需要が、特にパンデミック後は増加しています。アジア太平洋地域は、主にこの地域で園芸作物が広範囲に栽培されているため、園芸作物用の尿素肥料市場を独占しています。
  • 北米は芝生および観賞用作物の尿素肥料市場を独占しています。芝生と観賞用作物は市場総額の約60.9%を占め、2021年には約7億8,640万米ドルに達しました。多数のゴルフコース、スポーツクラブ、私有芝生エリアの存在が、この地域のシェア優位性に貢献しています。たとえば、芝草は米国の約1,500万ヘクタールの土地を覆っており、これにはすべてのスタジアム、芝生、公園が含まれます。
  • 畑作物と園芸作物に関しては、アジア太平洋地域は農地が豊富に利用できるため、より速いスピードで成長すると予想されています。芝生と観賞用の部分は北米と欧州の地域で成長しています。

アジア太平洋は地域別で最大のセグメントです。

  • 世界の尿素肥料市場は2021年に455億2,000万米ドルと評価され、消費量は1億1,460万トンを記録しました。
  • この地域の尿素市場は最大のシェアを占め、2021年には市場の63%を占めます。予測期間中に5.25%のCAGRで推移すると推定されています。人口増加に伴い地域的に農業が発展し、消費量が増加し市場を牽引しています。
  • 国別では、中国とインドが2021年の市場の53.8%と19.5%を占めました。消費の伸びは主に直接施用肥料としての尿素の需要によって牽引されており、これらの国の尿素総消費量の90%以上を占めています。したがって、これらの地域の尿素市場は、予測期間中に大幅に成長すると予想されます。
  • 北米は世界の尿素市場全体の8.8%を占めました。 2021年の尿素消費量は890万トンで、2017年の840万トンから増加しました。耕作面積の減少にもかかわらず、尿素消費量は2017年の4,660万ヘクタールから4,570万ヘクタールに増加しました。この傾向は、利用可能な土地面積で作物の収量と生産性を高めるために肥料の使用量が増加したために観察されました。
  • 前述の要因と、増加する人口を養うための生産性向上の必要性に基づいて、尿素の需要は増加すると予想され、それによって予測期間中に市場が大幅に押し上げられます。

尿素産業の概要

世界の尿素市場は細分化されており、上位5社が18.90%を占めています。この市場の主要企業は、CF Industries Holdings Inc、EuroChem Group、IFFCO、Nutrien Limited、Yara(アルファベット順)です。

その他の特典

  • エクセル形式の市場予測(ME)シート
  • 3か月のアナリストサポート

目次

第1章 エグゼクティブサマリーと主要な調査結果

第2章 レポートの提供

第3章 イントロダクション

  • 調査の前提条件と市場の定義
  • 調査範囲
  • 調査手法

第4章 主要な業界動向

  • 主要な作物の作付面積
  • 平均栄養素適用率
  • 規制の枠組み
  • バリューチェーンと流通チャネルの分析

第5章 市場セグメンテーション

  • 特殊タイプ
    • CRF
      • ポリマーコーティング
      • ポリマー硫黄コーティング
      • その他
    • SRF
  • 作物タイプ
    • 畑の作物
    • 園芸作物
    • 芝生と観賞用
  • 形態
    • 従来型
    • 特殊
  • 地域
    • アジア太平洋
      • オーストラリア
      • バングラデシュ
      • 中国
      • インド
      • インドネシア
      • 日本
      • パキスタン
      • フィリピン
      • タイ
      • ベトナム
      • その他アジア太平洋地域
    • 欧州
      • フランス
      • ドイツ
      • イタリア
      • オランダ
      • ロシア
      • スペイン
      • ウクライナ
      • 英国
      • その他欧州
    • 中東とアフリカ
      • ナイジェリア
      • サウジアラビア
      • 南アフリカ
      • トルコ
      • その他中東とアフリカ
    • 北米
      • カナダ
      • メキシコ
      • 米国
      • 北米のその他の地域
    • 南米
      • アルゼンチン
      • ブラジル
      • その他南米

第6章 競合情勢

  • 主要な戦略的動き
  • 市場シェア分析
  • 会社の情勢
  • 企業プロファイル
    • CF Industries Holdings Inc
    • Coromandel International
    • EuroChem Group
    • IFFCO
    • Koch Fertilizer LLC
    • Nutrien Limited
    • OCI NV
    • SABIC
    • URALCHEM JSC
    • Yara

第7章 CEOへの主戦略的な質問

第8章 付録

  • 世界の概要
    • 概要
    • ポーターのファイブ・フォース・フレームワーク
    • 世界バリューチェーン分析
    • 市場力学(DRO)
  • 出典と参考文献
  • 表と図のリスト
  • 主な洞察
  • データパック
  • 用語集
目次
Product Code: 92586

The Global Urea Market size is estimated at USD 72.07 billion in 2024, and is expected to reach USD 106.72 billion by 2030, growing at a CAGR of 6.76% during the forecast period (2024-2030).

Global Urea - Market

Key Highlights

  • Largest By Type - Straight : Conventional urea is the most consumed fertilizer globally, as nitrogen is the most yield-limiting nutrient for crop growth, and farmers are highly adapted to its usage.
  • Largest by Coating Type - Polymer Coated : The polymer-coated fertilizers release the nutrients for a longer duration and decrease the leaching losses of fertilizers in the soil. They also reduce the application rate.
  • Largest By Crop Type - Field Crops : Field crops are widely cultivated worldwide and are a staple food in many parts of the world. They account for a maximum share by area in most agricultural countries.

Urea Market Trends

Field Crops is the largest segment by Crop Type.

  • Field crops, on average, require more nitrogen than other crop types. Field crop cultivation dominates the global agricultural landscape, accounting for more than 95.0% of all agricultural land. Rice, wheat, and corn are the world's most important field crops, accounting for about 38.0% of total agricultural land. Field crops dominate the global urea market, accounting for about 86.1% of the market value, amounting to around USD 39.27 billion in 2021. The Asia-Pacific region dominates the market for field crops.
  • Horticultural crops accounted for about 10.7% of the total market value of urea fertilizers, amounting to around USD 4.96 billion in 2021. There is an increasing demand for fruits and vegetables around the world, particularly after the pandemic. The Asia-Pacific region dominates the urea fertilizer market for horticultural crops, primarily due to the extensive cultivation of horticultural crops in the region.
  • North America dominates the urea fertilizer market in turf and ornamental crops. Turf and ornamental crops accounted for about 60.9% of the total market value, amounting to around USD 786.4 million in 2021. The presence of a large number of golf courses, sports clubs, and private lawn areas contributes to the region's dominance by share. Turf grass, for example, covers about 15.0 million hectares of land in the United States, which includes all stadiums, lawns, and parks.
  • In terms of field and horticultural crops, the Asia-Pacific region is anticipated to grow at a faster rate due to the large availability of agricultural land. The turf and the ornamental segment is growing in the North American and European regions.

Asia-Pacific is the largest segment by Region.

  • The global urea fertilizers market was valued at USD 45.52 billion in 2021, recording a volume consumption of 114.6 million metric tons.
  • The urea market in the region occupies the largest share, accounting for 63% of the market in 2021. It is estimated to register a CAGR of 5.25% during the forecast period. With the increase in population, developments in the agriculture industries are taking place regionally, resulting in an increase in consumption, thereby driving the market.
  • By country, China and India accounted for 53.8% and 19.5% of the market in 2021. Consumption growth is mainly driven by the demand for urea as a direct application fertilizer, accounting for more than 90% of the total urea consumption in these countries. Hence, the urea market in these regions is anticipated to grow significantly during the forecast period.
  • North America accounted for 8.8% of the total global urea market. The consumption of urea in 2021 was 8.9 million metric tons, which increased from 8.4 million metric tons in 2017. Despite the decrease in the area under cultivation, there was an increase in the consumption of urea from 46.6 million hectares in 2017 to 45.7 million hectares in 2021. This trend was observed due to the higher usage of fertilizers to increase the yield and productivity of the crop in the available land area.
  • Based on the aforementioned factors and the need for enhanced productivity to feed the increasing population, the demand for urea is expected to increase, thereby boosting the market significantly during the forecast period.

Urea Industry Overview

The Global Urea Market is fragmented, with the top five companies occupying 18.90%. The major players in this market are CF Industries Holdings Inc, EuroChem Group, IFFCO, Nutrien Limited and Yara (sorted alphabetically).

Additional Benefits:

  • The market estimate (ME) sheet in Excel format
  • 3 months of analyst support

TABLE OF CONTENTS

1 EXECUTIVE SUMMARY & KEY FINDINGS

2 REPORT OFFERS

3 INTRODUCTION

  • 3.1 Study Assumptions & Market Definition
  • 3.2 Scope of the Study
  • 3.3 Research Methodology

4 KEY INDUSTRY TRENDS

  • 4.1 Acreage Of Major Crop Types
  • 4.2 Average Nutrient Application Rates
  • 4.3 Regulatory Framework
  • 4.4 Value Chain & Distribution Channel Analysis

5 MARKET SEGMENTATION

  • 5.1 Speciality Type
    • 5.1.1 CRF
      • 5.1.1.1 Polymer Coated
      • 5.1.1.2 Polymer-Sulfur Coated
      • 5.1.1.3 Others
    • 5.1.2 SRF
  • 5.2 Crop Type
    • 5.2.1 Field Crops
    • 5.2.2 Horticultural Crops
    • 5.2.3 Turf & Ornamental
  • 5.3 Form
    • 5.3.1 Conventional
    • 5.3.2 Speciality
  • 5.4 Region
    • 5.4.1 Asia-Pacific
      • 5.4.1.1 Australia
      • 5.4.1.2 Bangladesh
      • 5.4.1.3 China
      • 5.4.1.4 India
      • 5.4.1.5 Indonesia
      • 5.4.1.6 Japan
      • 5.4.1.7 Pakistan
      • 5.4.1.8 Philippines
      • 5.4.1.9 Thailand
      • 5.4.1.10 Vietnam
      • 5.4.1.11 Rest Of Asia-Pacific
    • 5.4.2 Europe
      • 5.4.2.1 France
      • 5.4.2.2 Germany
      • 5.4.2.3 Italy
      • 5.4.2.4 Netherlands
      • 5.4.2.5 Russia
      • 5.4.2.6 Spain
      • 5.4.2.7 Ukraine
      • 5.4.2.8 United Kingdom
      • 5.4.2.9 Rest Of Europe
    • 5.4.3 Middle East & Africa
      • 5.4.3.1 Nigeria
      • 5.4.3.2 Saudi Arabia
      • 5.4.3.3 South Africa
      • 5.4.3.4 Turkey
      • 5.4.3.5 Rest Of Middle East & Africa
    • 5.4.4 North America
      • 5.4.4.1 Canada
      • 5.4.4.2 Mexico
      • 5.4.4.3 United States
      • 5.4.4.4 Rest Of North America
    • 5.4.5 South America
      • 5.4.5.1 Argentina
      • 5.4.5.2 Brazil
      • 5.4.5.3 Rest Of South America

6 COMPETITIVE LANDSCAPE

  • 6.1 Key Strategic Moves
  • 6.2 Market Share Analysis
  • 6.3 Company Landscape
  • 6.4 Company Profiles
    • 6.4.1 CF Industries Holdings Inc
    • 6.4.2 Coromandel International
    • 6.4.3 EuroChem Group
    • 6.4.4 IFFCO
    • 6.4.5 Koch Fertilizer LLC
    • 6.4.6 Nutrien Limited
    • 6.4.7 OCI NV
    • 6.4.8 SABIC
    • 6.4.9 URALCHEM JSC
    • 6.4.10 Yara

7 KEY STRATEGIC QUESTIONS FOR FERTILIZER CEOS

8 APPENDIX

  • 8.1 Global Overview
    • 8.1.1 Overview
    • 8.1.2 Porter's Five Forces Framework
    • 8.1.3 Global Value Chain Analysis
    • 8.1.4 Market Dynamics (DROs)
  • 8.2 Sources & References
  • 8.3 List of Tables & Figures
  • 8.4 Primary Insights
  • 8.5 Data Pack
  • 8.6 Glossary of Terms