
|
市場調査レポート
商品コード
1693515
インドの尿素:市場シェア分析、産業動向・統計、成長予測(2025年~2030年)India Urea - Market Share Analysis, Industry Trends & Statistics, Growth Forecasts (2025 - 2030) |
||||||
カスタマイズ可能
適宜更新あり
|
|||||||
| インドの尿素:市場シェア分析、産業動向・統計、成長予測(2025年~2030年) |
|
出版日: 2025年03月18日
発行: Mordor Intelligence
ページ情報: 英文 166 Pages
納期: 2~3営業日
|

全表示
- 概要
- 目次
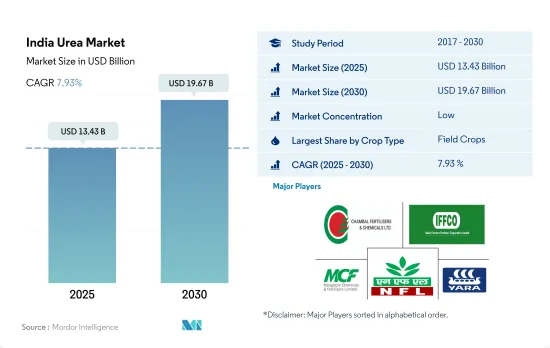
インドの尿素市場規模は2025年に134億3,000万米ドルと推定され、2030年には196億7,000万米ドルに達すると予測され、予測期間中(2025~2030年)のCAGRは7.93%で成長する見込みです。
あらゆる作物種で尿素の消費量が増加し、高効率肥料への需要が高まっていることが、尿素肥料市場を押し上げると予想されます。
- インドでは、畑作作物のみが尿素肥料市場全体の約89.3%の金額シェアを占め、低コストで国内で広く入手可能なため、2022年には従来の尿素肥料の約89.7%が消費されました。しかし、畑作では、その効率の高さから特殊尿素肥料を採用する傾向が強まっています。このため、その市場価値は2023年から2030年の間にCAGR 7.8%を記録すると予測されています。
- 園芸作物は尿素肥料市場全体の約10.2%を占め、2022年の市場規模は12億米ドルでした。インドは世界第2位の果物・野菜生産国で、バナナ、マンゴー、レモン、パパイヤ、オクラが第1位です。果物・野菜に対する需要の高まりと栽培面積の拡大が相まって、市場の成長を牽引すると予想されています。
- 過去数十年来、窒素施用量の増加と窒素利用効率の低下が見られます。インドでは2050年までに肥料消費量が倍増すると推定されており、肥料の利用効率を高めることが急務となっています。放出制御肥料は、特に園芸作物において、肥料の使用効率を改善し、肥料汚染を減少させることができます。こうした要因から、今後数年間はあらゆる作物分野で放出制御肥料の成長が促進されると予想されます。
- 花卉栽培は近年成長している産業の一つです。例えば、2020-21年に同国は1万5,600トン、総額780万米ドルの花卉製品を輸出しました。国内外での花卉需要の高まりにより、芝・観賞用作物の市場価値は2023年から2030年にかけてCAGR 7.1%で増加すると予想されます。
インドの尿素市場動向
マンガン欠乏症は欧州諸国でよく見られる問題で、pHが6を超える砂質土壌や有機質土壌で最も頻繁に発生します。
- 同国における畑作物の栽培面積は、2017~2022年の間に3.5%増加しました。国内外での消費者需要の高まりによる同国での穀物、豆類、油糧種子の栽培拡大が、栽培面積増加の主な原動力となっています。
- 作物の種類別では、米、小麦、大豆の栽培面積が最も大きく、2022年には4,700万ha、3,110万ha、1,230万haを占める。コメはインドで最も重要な食用作物であり、作付面積の約4分の1を占め、インド人口の約半数に食糧を供給しています。西ベンガル州、ウッタル・プラデシュ州、アンドラ・プラデシュ州、パンジャブ州、タミル・ナードゥ州を中心に、ほぼ全土で栽培されています。
- それに伴い、同国のコメ消費量は2016年の9,580万トンから2022年には1億700万トンに増加しており、これは同国における同作物に対する需要の高まりを示すものです。この動向は、2023年から2030年にかけての肥料需要をさらに押し上げると予想されます。同様に、国内の小麦栽培は2017年の9,850万トンから2020年には1億760万トンに増加しました。パンジャブ州、西ベンガル州、ハリヤナ州、ラジャスタン州で主に栽培されています。小麦はインドで2番目に重要な穀物作物であり、同国の食料・栄養安全保障において重要な役割を果たしています。そのため、同国では穀物の栽培が盛んであり、国内外の需要の高まりと相まって、2023年から2030年にかけてインドの肥料市場を牽引すると予想されています。
一次栄養素の中で、窒素は畑作で最も施用される栄養素です。
- 2022年の一次栄養素の平均施用量は125.1kg/haでした。特筆すべきは窒素で、平均施用量は223.5 kg/haでトップでした。一次養分としての重要性を考えると、窒素は国内で広く栽培されているコメのような高収量作物を支える上で極めて重要な役割を果たしています。しかし、養分、特に窒素の欠乏が全国の稲の生産性を妨げています。バイオ肥料と有機肥料の現状報告書で強調されているように、インドの土壌の健全性は懸念材料です。それによると、化学肥料への依存度が高まっており、検査した土壌の97.0%、83.0%、71.0%がそれぞれ窒素、リン、カリウムの不足を示しています。
- 主要作物では、小麦、コメ、トウモロコシが2022年の養分施用量のトップで、それぞれ平均231kg/ha、156kg/ha、149kg/haでした。小麦とコメは国内でも世界的にも主食であるが、複数の養分不足による課題に直面しています。窒素、リン、カリウムのほかに、これらの作物は最適な生育のために硫黄、ホウ素、鉄、亜鉛などの微量栄養素も必要とします。効果的な養分管理は作物生産を高めるために極めて重要であり、それによって市場の成長に拍車をかけています。
- 畑作物、特に穀物や穀類は、一次栄養素、特に窒素肥料を貪欲に必要とします。インドではこれらの作物が広く栽培されているため、土壌の養分は急速に枯渇しつつあります。その結果、農家はそのギャップを埋めるためにますます肥料に頼るようになっており、この動向が2023年から2030年にかけて市場を牽引すると予測されています。
インド尿素産業の概要
インドの尿素市場は細分化されており、上位5社で12.09%を占めています。この市場の主要企業は以下の通り。 Chambal Fertilizers & Chemicals Ltd, Indian Farmers Fertiliser Cooperative Limited, Mangalore Chemicals & Fertilizers Ltd., National Fertilizers Ltd and Yara International ASA(アルファベット順)
その他の特典
- エクセル形式の市場予測(ME)シート
- 3ヶ月のアナリストサポート
目次
第1章 エグゼクティブサマリーと主な調査結果
第2章 レポートのオファー
第3章 イントロダクション
- 調査の前提条件と市場定義
- 調査範囲
- 調査手法
第4章 主要産業動向
- 主要作物の作付面積
- 畑作物
- 園芸作物
- 平均養分施用率
- 主要養分
- 畑作物
- 園芸作物
- 主要養分
- 灌漑設備のある農地
- 規制の枠組み
- バリューチェーンと流通チャネル分析
第5章 市場セグメンテーション
- スペシャリティタイプ
- CRF
- ポリマーコート
- ポリマー硫黄コーティング
- その他
- 液体肥料
- SRF
- 水溶性
- CRF
- 作物タイプ
- 畑作物
- 園芸作物
- 芝・観賞用
- 形態
- 従来
- 特殊作物
第6章 競争情勢
- 主要な戦略的動き
- 市場シェア分析
- 企業情勢
- 企業プロファイル
- Chambal Fertilizers & Chemicals Ltd
- Coromandel International Ltd.
- Gujarat Narmada Valley Fertilizers & Chemicals Ltd
- Indian Farmers Fertiliser Cooperative Limited
- Mangalore Chemicals & Fertilizers Ltd.
- National Fertilizers Ltd
- Yara International ASA
- Zuari Agro Chemicals Ltd
第7章 CEOへの主な戦略的質問
第8章 付録
- 世界概要
- 概要
- ファイブフォース分析フレームワーク
- 世界のバリューチェーン分析
- 市場力学(DROs)
- 情報源と参考文献
- 図表一覧
- 主要洞察
- データパック
- 用語集
The India Urea Market size is estimated at 13.43 billion USD in 2025, and is expected to reach 19.67 billion USD by 2030, growing at a CAGR of 7.93% during the forecast period (2025-2030).
The rising consumption of urea in all crop types and increasing demand for highly efficient fertilizers are expected to boost the urea fertilizer market
- In India, field crops alone account for about 89.3% value share of the total urea fertilizer market and consumed about 89.7% of conventional urea fertilizers in 2022 due to their low cost and widespread availability in the country. However, in field crops, there is an increasing trend in adopting specialty urea fertilizers due to their efficiency. Due to this, its market value is projected to register a CAGR of 7.8% between 2023 and 2030.
- Horticulture crops account for about 10.2% of the total urea fertilizer market, which was valued at USD 1.2 billion in 2022. India is the world's second-largest producer of fruits and vegetables, and the country ranks first in banana, mango, lemon, papaya, and okra. The rising demand for fruits and vegetables, coupled with the expansion of cultivation area, is anticipated to drive the growth of the market.
- Since the last few decades, there has been an increase in nitrogen application rates and a decrease in nitrogen use efficiency. It is estimated that fertilizer consumption in India may double by 2050, and there is an urgent need to improve the country's fertilizer use efficiency. The controlled-release fertilizers can improve fertilizer use efficiency and decrease fertilizer pollution, particularly in horticultural crops. These factors are anticipated to fuel the growth of control-release fertilizers in all crop segments in the coming years.
- The floriculture has been one of the growing industries in recent years. For instance, in 2020-21, the country exported 15.6 thousand metric tons of floriculture products for a total value of USD 7.8 million. The rising domestic and international demand for flowers is expected to increase the market value of turf and ornamental crops at 7.1% CAGR from 2023 to 2030.
India Urea Market Trends
Manganese deficiency is a common problem in European countries, which most frequently affects sandy and organic soils with a pH above 6
- The area under field crop cultivation in the country increased by 3.5% during 2017-2022. The increased cultivation of cereals, pulses, and oilseeds in the country due to the rising consumer demand domestically and internationally is the major driving factor for the rising acreage.
- By crop type, rice, wheat, and soybean occupied the largest area under cultivation in the country, accounting for 47 million ha, 31.1 million ha, and 12.3 million ha in 2022. Rice is the most important food crop of India, covering about one-fourth of the total cropped area and providing food to about half of the Indian population. It is cultivated in almost all the states of the country, mainly in West Bengal, Uttar Pradesh, Andhra Pradesh, Punjab, and Tamil Nadu.
- Accordingly, rice consumption in the country increased from 95.8 million tons in 2016 to 107 million tons in 2022, which shows the rising demand for the crop in the country. This trend is further anticipated to drive the demand for fertilizers during 2023-2030. Similarly, wheat cultivation in the country increased from 98.5 million tons in 2017 to 107.6 million tons in 2020. It is cultivated majorly in Punjab, West Bengal, Haryana, and Rajasthan. Wheat is the second most important cereal crop in India and plays a vital role in the food and nutritional security of the country. Therefore, the intense cereal cultivation in the country, coupled with rising domestic and international demand, is anticipated to drive the Indian fertilizer market during 2023-2030.
Among the primary nutrients, nitrogen is the most-applied nutrient in field crops.
- In 2022, the average application rate for primary nutrients stood at 125.1 kg/ha. Notably, nitrogen topped the list with an average application rate of 223.5 kg/ha. Given its significance as a primary nutrient, nitrogen plays a pivotal role in supporting high-yield crops like rice, which is extensively cultivated in the country. However, nutrient deficiencies, particularly in nitrogen, are hampering rice productivity nationwide. The soil health in India, as highlighted in the State of Biofertilizers and Organic Fertilizers report, is a cause for concern. It reveals a rising reliance on chemical fertilizers, with 97.0%, 83.0%, and 71.0% of tested soils showing deficiencies in nitrogen, phosphorous, and potassium, respectively.
- Among the major crops, wheat, rice, and corn/maize led the pack in nutrient application rates in 2022, averaging 231, 156, and 149 kg/ha, respectively. Wheat and rice, being staple foods both domestically and globally, face challenges due to multiple nutrient deficiencies. Apart from nitrogen, phosphorous, and potassium, these crops also require micronutrients like sulfur, boron, iron, and zinc for optimal growth. Effective nutrient management is crucial for boosting crop production, thereby fueling market growth.
- Field crops, especially grains and cereals, have a voracious appetite for primary nutrients, particularly nitrogen fertilizers. Given the extensive cultivation of these crops in India, the soil's nutrient content is rapidly depleting. Consequently, farmers are increasingly relying on fertilizers to bridge the gap, a trend projected to drive the market from 2023 to 2030.
India Urea Industry Overview
The India Urea Market is fragmented, with the top five companies occupying 12.09%. The major players in this market are Chambal Fertilizers & Chemicals Ltd, Indian Farmers Fertiliser Cooperative Limited, Mangalore Chemicals & Fertilizers Ltd., National Fertilizers Ltd and Yara International ASA (sorted alphabetically).
Additional Benefits:
- The market estimate (ME) sheet in Excel format
- 3 months of analyst support
TABLE OF CONTENTS
1 EXECUTIVE SUMMARY & KEY FINDINGS
2 REPORT OFFERS
3 INTRODUCTION
- 3.1 Study Assumptions & Market Definition
- 3.2 Scope of the Study
- 3.3 Research Methodology
4 KEY INDUSTRY TRENDS
- 4.1 Acreage Of Major Crop Types
- 4.1.1 Field Crops
- 4.1.2 Horticultural Crops
- 4.2 Average Nutrient Application Rates
- 4.2.1 Primary Nutrients
- 4.2.1.1 Field Crops
- 4.2.1.2 Horticultural Crops
- 4.2.1 Primary Nutrients
- 4.3 Agricultural Land Equipped For Irrigation
- 4.4 Regulatory Framework
- 4.5 Value Chain & Distribution Channel Analysis
5 MARKET SEGMENTATION (includes market size in Value in USD and Volume, Forecasts up to 2030 and analysis of growth prospects)
- 5.1 Speciality Type
- 5.1.1 CRF
- 5.1.1.1 Polymer Coated
- 5.1.1.2 Polymer-Sulfur Coated
- 5.1.1.3 Others
- 5.1.2 Liquid Fertilizer
- 5.1.3 SRF
- 5.1.4 Water Soluble
- 5.1.1 CRF
- 5.2 Crop Type
- 5.2.1 Field Crops
- 5.2.2 Horticultural Crops
- 5.2.3 Turf & Ornamental
- 5.3 Form
- 5.3.1 Conventional
- 5.3.2 Speciality
6 COMPETITIVE LANDSCAPE
- 6.1 Key Strategic Moves
- 6.2 Market Share Analysis
- 6.3 Company Landscape
- 6.4 Company Profiles
- 6.4.1 Chambal Fertilizers & Chemicals Ltd
- 6.4.2 Coromandel International Ltd.
- 6.4.3 Gujarat Narmada Valley Fertilizers & Chemicals Ltd
- 6.4.4 Indian Farmers Fertiliser Cooperative Limited
- 6.4.5 Mangalore Chemicals & Fertilizers Ltd.
- 6.4.6 National Fertilizers Ltd
- 6.4.7 Yara International ASA
- 6.4.8 Zuari Agro Chemicals Ltd
7 KEY STRATEGIC QUESTIONS FOR FERTILIZER CEOS
8 APPENDIX
- 8.1 Global Overview
- 8.1.1 Overview
- 8.1.2 Porter's Five Forces Framework
- 8.1.3 Global Value Chain Analysis
- 8.1.4 Market Dynamics (DROs)
- 8.2 Sources & References
- 8.3 List of Tables & Figures
- 8.4 Primary Insights
- 8.5 Data Pack
- 8.6 Glossary of Terms
