
|
市場調査レポート
商品コード
1911711
尿素:市場シェア分析、業界動向と統計、成長予測(2026年~2031年)Urea - Market Share Analysis, Industry Trends & Statistics, Growth Forecasts (2026 - 2031) |
||||||
カスタマイズ可能
適宜更新あり
|
|||||||
| 尿素:市場シェア分析、業界動向と統計、成長予測(2026年~2031年) |
|
出版日: 2026年01月12日
発行: Mordor Intelligence
ページ情報: 英文 120 Pages
納期: 2~3営業日
|

概要
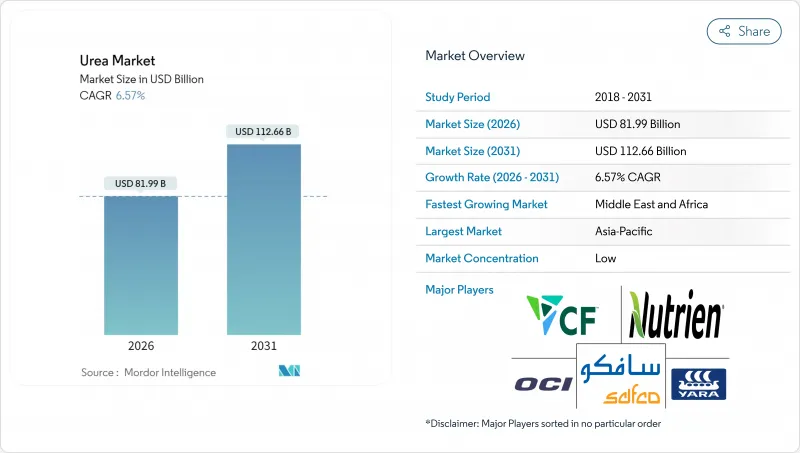
尿素市場は2025年に769億5,000万米ドルと評価され、2026年の819億9,000万米ドルから2031年までに1,126億6,000万米ドルに達すると予測されています。
予測期間(2026-2031年)におけるCAGRは6.57%と見込まれます。
穀物作付面積の急速な拡大と初の商業規模グリーン水素プロジェクトが生産経済性を再構築しつつ、需要は上昇傾向を維持しております。長期天然ガス契約を結ぶ生産者は価格高騰時の利益率を保護できますが、分散型港湾プラントや再生可能エネルギー利用アンモニア製造設備が地域別コスト曲線の再構築を始めています。並行して、政府による流出規制の強化により、平均販売価格の高い被覆・安定化製品への需要が誘導されています。これらの相乗効果により、原料調達における戦略的ヘッジ、物流資産との深い統合、高効率肥料配合の研究開発加速が促進されています。
世界の尿素市場の動向と展望
世界の穀物作付け面積の拡大
世界の穀物作付面積の拡大に伴い、2030年までに28%の生産増加を目指す農家による窒素需要は堅調に増加しています。インド、中国、アフリカ一部地域における高収量小麦・米・トウモロコシプログラムでは、GPS誘導散布機に対応した粒状尿素が大量に消費されています。インドにおけるナノ尿素の導入事例は、施肥量の最適化により栄養供給量を減らすことなく環境負荷を低減できることを示しています。サハラ以南アフリカにおける政府の投入資材補助金は、施肥率をさらに押し上げるとともに、窒素放出を遅延させる被覆製品を小規模農家へ普及させています。ブラジルの「国家肥料計画」は、大豆およびトウモロコシ作付面積の拡大を支援しつつ、輸入依存度を抑制するための国内生産能力を後押ししています。有利な商品価格は作付面積の増加を持続させ、尿素市場の長期的な消費基盤を強化しています。
肥料における窒素の重要性
世界的に、トウモロコシ、ナタネ、綿花、ソルガム、米、小麦、大豆などの作物は必須栄養素の主要な消費者です。2024年、これらの主要作物は栄養要求量が異なり、主要栄養素の平均施用量は120.97kg/haから255.75kg/haの範囲です。これらの栄養素は、植物の代謝プロセスや細胞・膜・クロロフィルなどの必須組織の発達を支える上で極めて重要です。窒素は依然として最も広く施用される栄養素であり、平均施用量は224.6kg/haです。特に南米やアジア太平洋地域において畑作物の栽培面積が拡大を続ける中、栄養不足に直面する欧州や北米などの地域では、その効率性から尿素特殊肥料の採用がますます進んでいます。
天然ガス価格の変動が生産コストを押し上げる
原料費は工場渡し尿素価格の最大80%を占めます。2022年に欧州の指標ガス価格がMWh当たり300ユーロ(324米ドル)を突破した際、複数のプラントは赤字運営を避け操業停止を選択しました。サウジアラビアのSABICなど上流部門を統合した生産者は、自社ガス供給により収益性を維持しています。他企業はヘッジプログラムを導入していますが、スポット価格の急騰がヘッジ範囲を超えると依然として資金流出に直面します。この変動性は、安定したガス供給地域への移行を加速させ、モジュラープラント向けアンモニア輸入の採用を促進し、電力料金の低下に伴い再生可能水素への関心を再燃させています。
セグメント分析
水溶性尿素肥料は特殊尿素肥料市場において主要セグメントとして台頭し、2025年には40.35%の市場シェアを占める見込みです。窒素を豊富に含み水溶性に優れた尿素は、植物根部の窒素吸収を大幅に促進し、成長を促します。このセグメントの優位性は、主に世界の干ばつ、熱波、水不足の深刻化といった気候変動の影響により、土壌中の窒素利用可能性が低下していることに起因します。農家は、窒素の流出や揮発、それに伴う環境汚染や地下水汚染のリスクを軽減しつつ、安定した窒素供給を保証する水溶性尿素肥料をますます好んで採用しています。制御放出型尿素は、2026年から2031年の予測期間においてCAGR7.28%と最も急速に成長するセグメントです。これは、窒素損失の削減と持続可能性基準への適合を図るため、農家や農業関連企業が効率向上資材の導入を拡大しているためです。ポリマー被覆およびポリマー硫黄被覆製剤は、栄養素の徐放性を高め、浸出や揮発を最小限に抑えながら、施用頻度の削減による労働効率の向上を実現します。この成長は、栄養管理に関する規制要件や、穀物、油糧種子、特殊作物における徐放性肥料の使用増加によってさらに促進されています。生産性の向上と環境負荷の低減を目指す生産者の需要により、徐放性尿素の需要は年々加速しています。
本尿素市場レポートでは、業界を以下のセグメントに分類しております:特殊タイプ別(徐放性尿素肥料、液体肥料、徐放性粒状尿素、水溶性尿素)、作物タイプ別(畑作物、園芸作物、芝生・観賞植物)、形態別(従来型・特殊型)、地域別(アジア太平洋、欧州、中東・アフリカ、北米、南米)。市場規模は金額(米ドル)および数量(メトリックトン)で提供されています。
地域別分析
アジア太平洋地域は、中国とインドにおける穀物栽培の集約化を背景に、2025年の収益の44.92%を占めました。ベトナム、インドネシア、フィリピンでは耕作面積の拡大と機械化施肥設備の導入が進み、さらなる成長を支えています。中国では、肥料削減義務化によりナノ尿素や被覆製品の使用が促進され、総栄養素トン数は安定しているもの、ヘクタール当たりの支出が増加しています。インドでは、補助金改革によりバランスの取れた栄養管理が推進され、汎用粒状肥料よりも高付加価値の配合肥料への需要が高まっています。さらに、ASEAN水素ロードマップにより、低炭素アンモニア輸入に向けた準備が進められており、将来のグリーン尿素生産を支える可能性があります。
中東およびアフリカは、予測CAGRが9.17%と最も急成長している地域です。この成長は、輸出競争力を高める低コストのガスに支えられた、サウジアラビア、アラブ首長国連邦、ナイジェリアにおける生産能力の拡大によって推進されています。また、現地の農業補助金プログラムも内陸部の需要を押し上げています。ナイジェリアのダンゴート・コンプレックスは、国内市場と西アフリカ市場の両方にサービスを提供しており、海外からの輸入への依存度を低減しています。湾岸協力会議(GCC)加盟国は、グリーンアンモニア生産のための太陽光発電による電解装置を模索しており、欧州やアジアの炭素意識の高いバイヤーを惹きつける立場を確立しようとしています。しかし、サハラ以南のアフリカの一部地域では、インフラの格差や政情不安が課題となっていますが、ドナーが支援する農業普及プログラムが、肥料の採用を引き続き支援しています。
北米と欧州は、成熟した、しかし着実な成長軌道を示しています。北米では、シェールガスにより、肥料工場はコスト面で上位25%の生産者であり続け、ラテンアメリカへの輸出の流れを維持しています。欧州では、栄養素の上限に関するより厳格な農業政策により、粒状コーティング製品の採用が進んでいます。ドイツとベルギーの輸入ターミナルは、調達先の選択肢を拡大しており、ガス価格が高騰する期間には、北アフリカや中東からのアンモニアの輸入が、現地生産の減少を補っています。
その他の特典:
- エクセル形式の市場予測(ME)シート
- アナリストによる3ヶ月間のサポート
よくあるご質問
目次
第1章 イントロダクション
- 調査の前提条件と市場の定義
- 調査範囲
- 調査手法
第2章 レポート提供
第3章 エグゼクティブサマリー主要な調査結果
第4章 主要産業動向
- 主要作物類の作付面積
- 畑作作物
- 園芸作物
- 平均施肥量
- 微量栄養素
- 畑作作物
- 園芸作物
- 微量栄養素
- 主要栄養素
- 畑作作物
- 園芸作物
- 灌漑設備を備えた農地
- 規制の枠組み
- バリューチェーン及び流通チャネル分析
- 市場促進要因
- 穀物作物の栽培拡大
- 肥料における窒素の主要栄養素としての依存度
- 尿素の他の窒素肥料に対するコスト優位性
- 精密農業における粒状尿素の選好性が高まる
- 再生可能水素ベースのグリーン尿素の生産能力増強
- 港湾沿いのモジュラー式尿素プラントによる物流コスト削減
- 市場抑制要因
- 天然ガス価格の変動による生産コストの上昇
- 窒素使用に関する流出規制および温室効果ガス規制の強化
- 硝酸アンモニウムおよびUANによる代替品の脅威
- 地政学的な貿易ルートの混乱
第5章 市場規模と成長予測(金額と数量)
- 専門分野タイプ
- CRF
- ポリマーコーティング
- ポリマー・硫黄コーティング
- その他
- 液体肥料
- SRF
- 水溶性
- CRF
- 作物タイプ
- 畑作作物
- 園芸作物
- 芝生・観賞用植物
- フォーム
- 従来型
- 特殊
- 地域
- アジア太平洋地域
- オーストラリア
- バングラデシュ
- 中国
- インド
- インドネシア
- 日本
- パキスタン
- フィリピン
- タイ
- ベトナム
- その他アジア太平洋地域
- 欧州
- フランス
- ドイツ
- イタリア
- オランダ
- ロシア
- スペイン
- ウクライナ
- 英国
- その他欧州地域
- 中東・アフリカ
- ナイジェリア
- サウジアラビア
- 南アフリカ
- トルコ
- その他中東・アフリカ
- 北米
- カナダ
- メキシコ
- 米国
- その他北米地域
- 南米
- アルゼンチン
- ブラジル
- その他南米
- アジア太平洋地域
第6章 競合情勢
- 主要な戦略的動きs
- 市場シェア分析
- 企業概要
- 企業プロファイル.
- CF Industries Holdings, Inc.
- Coromandel International Ltd.
- EuroChem Group
- Indian Farmers Fertiliser Cooperative Limited
- Koch Industries Inc.
- Nutrien Ltd.
- OCI NV
- SABIC Agri-Nutrients Co.
- Yara International ASA
- Qatar Fertiliser Company(QAFCO)
- PT Pupuk Kalimantan Timur
- Rashtriya Chemicals and Fertilizers Limited
- Acron Group(Acron PJSC)
- BASF SE
- URALCHEM Holding P.L.C.
- The Mosaic Company

