
|
市場調査レポート
商品コード
1433807
フレキシブルガラス:市場シェア分析、産業動向、成長予測(2024年~2029年)Flexible Glass - Market Share Analysis, Industry Trends & Statistics, Growth Forecasts (2024 - 2029) |
||||||
カスタマイズ可能
適宜更新あり
|
|||||||
| フレキシブルガラス:市場シェア分析、産業動向、成長予測(2024年~2029年) |
|
出版日: 2024年02月15日
発行: Mordor Intelligence
ページ情報: 英文 120 Pages
納期: 2~3営業日
|

全表示
- 概要
- 目次
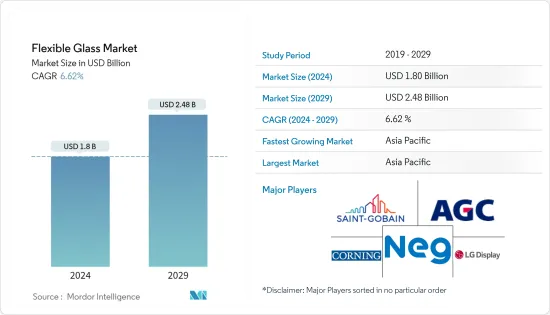
フレキシブルガラス市場規模は2024年に18億米ドルと推定され、2029年には24億8,000万米ドルに達すると予測され、予測期間中(2024-2029年)のCAGRは6.62%で成長する見込みです。
COVID-19パンデミックはフレキシブルガラス市場にマイナスの影響を与えました。しかし、軽量、薄型、堅牢、ポータブルエレクトロニクスの製造など、様々な用途での消費増加により、2021年には市場は大幅に回復しました。
主なハイライト
- 電気・電子産業や消費財産業からのフレキシブルガラス需要の増加と原材料コストの低下が、予測期間中の市場を牽引すると予想されます。
- 生産の複雑さ、環境問題、シリカガスによる健康問題は、中期的な市場成長の妨げになると思われます。
- ソーラーパネル、自動車、防衛分野でのフレキシブルガラスの使用増加は、メーカーに幅広い機会を提供すると予想されます。
- アジア太平洋地域は最大の市場であり、中国、インド、日本などの国での消費増加により、予測期間中に最も急成長する市場になると予想されます。
フレキシブルガラス市場の動向
ソーラーパネル需要の増加
- ガラスは、低コスト、軽量、耐熱性、耐水性、耐傷性などの長所により使用されています。主なエンドユーザー産業には、電気・電子、自動車、オプトエレクトロニクスなどがあります。
- ソーラーパネルの製造は、フレキシブルガラスにとって2番目に大きな用途分野です。日本や中国のような新興経済諸国からの需要は、米国やフランスのような先進国からの需要よりもはるかに高いです。
- ソーラーエネルギー産業では、設計の柔軟性を高め、超薄型ガラスを提供するために、軽量で傷の付かない材料への需要が高まっており、これがフレキシブルガラス市場の成長の主な要因となっています。
- 加えて、ソーラーパネルの成長を後押しする要因の一つとして、二酸化炭素排出量を削減するための再生可能エネルギーへの投資が世界的に増加していることが挙げられます。
- 米国農務省(USDA)の2023年度予算では、地方電力向け融資65億米ドルに加え、地方の電力事業者の再生可能エネルギーへの転換を支援するために3億米ドルが割り当てられています。
- 2022年12月、カリフォルニア州公益事業委員会は、2023年4月に施行され、最終的に輸出された太陽光エネルギーを小売価格より約75%安い価格で償還する新しいネットメータリング規制を承認しました。従来の考えとは対照的に、決まった料金はなく、経過措置期間も設けられています。
- 米国国立再生可能エネルギー研究所(NREL)によると、16州で太陽光発電による発電量が5%を超え、カリフォルニア州が27.3%でトップでした。米国も2022年に17.0ギガワット(GWac)(20.2GWdc)のPV(太陽光発電)を設置し、累積PV設置量は110.1GWac(140.6GWdc)で今年を終えました。
- フランス政府は、「フランス2030国家投資計画」の一環として、再生可能エネルギーを推進する取り組みに10億ユーロ(~11億3,000万米ドル)を投資します。最終目標は、2050年までに再生可能エネルギーを10倍、最大100GW導入することです。総設備容量のうち40GWは洋上風力発電プロジェクトによるものです。
- 以上のような要因により、フレキシブルガラスの需要は予測期間を通じて増加すると予想されます。
アジア太平洋が市場を独占
- 中国、韓国、日本などの国々でソーラーパネルや太陽電池製造の需要が増加していることから、予測期間中、アジア太平洋地域がフレキシブルガラス市場を独占すると予想されます。
- 世界は2025年まで、ソーラーパネル生産の主要な構成要素の供給をほぼ完全に中国に依存することになります。
- 中国国家エネルギー局が1月下旬に発表した情報によると、中国の2022年の設置量は87ギガワット(GW)で、前年比59%増でした。
- 国立再生可能エネルギー研究所(NREL)によると、中国は2022年に87GWの太陽光発電を設置し、前年比59%増となった。さらに、インドでは2022年の最初の9ヵ月間にPV設置量が51%増加しました。
- インドでは、大規模な系統連系太陽光発電プロジェクトを支援するため、2024年3月までに40GWを目標容量とする「ソーラーパークと超巨大太陽光発電プロジェクトの開発」計画が実施されています。2022年1月から10月までに、さまざまなソーラーパークで832MWの太陽光発電プロジェクトが開始される予定です。
- 日本は近年、再生可能エネルギーによる電力生産を大幅に増加させ、再生可能エネルギー設備容量でトップクラスの国となっています。日本政府は、新たな戦略的エネルギー計画の下、再生可能エネルギーの割合を2030年までに38%に引き上げるという目標を掲げました。さらに、2050年までに完全なカーボンニュートラルを目指しています。
- 従って、上記の要因と政府の支援は、予測期間中のアジア太平洋地域におけるフレキシブルガラス市場の需要増加に寄与しています。
その他の特典:
- エクセル形式の市場予測(ME)シート
- 3ヶ月間のアナリストサポート
目次
第1章 イントロダクション
- 調査の成果
- 調査の前提
- 調査範囲
第2章 調査手法
第3章 エグゼクティブサマリー
第4章 市場力学
- 促進要因
- 電気・電子産業および消費財産業からの需要増加
- 原材料コストの低下
- その他の促進要因
- 抑制要因
- 製造の複雑さ
- シリカヒュームによる環境への懸念と健康問題
- その他の阻害要因
- バリューチェーン/サプライチェーン分析
- ポーターのファイブフォース分析
- 供給企業の交渉力
- 消費者の交渉力
- 新規参入業者の脅威
- 代替品の脅威
- 競合の程度
第5章 市場セグメンテーション(金額ベース市場規模)
- アプリケーション
- ディスプレイ
- ソーラーパネル
- PV電池
- その他
- エンドユーザー産業
- 電気・電子
- 自動車
- 医療
- ウェアラブルデバイス
- その他
- 地域
- アジア太平洋
- 中国
- インド
- 日本
- 韓国
- その他アジア太平洋地域
- 北米
- 米国
- カナダ
- メキシコ
- 欧州
- ドイツ
- 英国
- フランス
- イタリア
- その他欧州
- 南米
- ブラジル
- アルゼンチン
- その他南米
- 中東・アフリカ
- サウジアラビア
- 南アフリカ
- その他中東・アフリカ
- アジア太平洋
第6章 競合情勢
- M&A、合弁事業、提携、協定
- 市場シェア分析(%)**/ランキング分析
- 主要企業の戦略
- 企業プロファイル
- Abrisa Technologies
- AGC Inc.
- Corning Incorporated
- DuPont
- Kent Displays, Inc.
- KYOCERA Corporation
- LG DISPLAY CO., LTD
- Murata Manufacturing Co., Ltd
- Nippon Electric Glass Co. Ltd
- Saint-Gobain
- SCHOTT AG
- UNIVERSAL DISPLAY
第7章 市場機会と今後の動向
The Flexible Glass Market size is estimated at USD 1.8 billion in 2024, and is expected to reach USD 2.48 billion by 2029, growing at a CAGR of 6.62% during the forecast period (2024-2029).
The COVID-19 pandemic negatively impacted the flexible glass market. However, the market recovered significantly in 2021, owing to rising consumption from various applications such as producing lightweight, thin, robust, and portable electronics.
Key Highlights
- Increasing demand for flexible glass from electrical and electronics and consumer goods industries and lower cost of raw materials is expected to drive the market during the forecast period.
- High production complexity, environmental concerns, and health issues due to silica fumes will likely hinder market growth over the medium term.
- Increasing usage of flexible glass in solar panels, automotive, and defense sectors is expected to provide wide opportunities for manufacturers.
- Asia-Pacific represents the largest market and is expected to be the fastest-growing market over the forecast period, owing to the increasing consumption from countries such as China, India, and Japan.
Flexible Glass Market Trends
Increasing Demand for Solar Panels
- Glass is used owing to its advantages, such as low cost, less weight, heat, water resistance, scratch-resistant, etc. Some major end-user industries include electrical and electronics, automotive, Opto-electronics, etc.
- Manufacturing of solar panels is the second-largest application segment for flexible glass. The demand from thriving economies like Japan and China is much higher than that from developed countries like the United States and France.
- Growing demand for lightweight and scratch-free materials in the solar energy industry to provide increased design flexibility and ultra-slim glass is primarily responsible for the growth of the flexible glass market.
- In addition, one of the boosting factors for these solar panels is the increasing investment in a renewable energy source to reduce carbon emissions worldwide.
- In addition to USD 6.5 billion for loans for rural power, the 2023 budget of the US Department of Agriculture (USDA) allocated USD 300 million to help rural electricity providers switch to renewable energy sources.
- In December 2022, the California Public Utilities Commission approved new net metering regulations that will go into effect in April 2023 and eventually reimburse exported solar energy at prices approximately 75% less than retail. In contrast to the prior idea, there are no set fees and a transitional period.
- According to National Renewable Energy Laboratory (NREL), 16 states generated more than 5% of their electricity from solar, with California leading the way at 27.3%. The United States also installed 17.0 gigawatts of alternating current (GWac) (20.2 GWdc) of PV (photovoltaic) in 2022, ending the year with 110.1 GWac (140.6 GWdc) of cumulative PV installations.
- The French government will invest EUR 1 billion (~USD 1.13 billion) in initiatives to advance renewable energy as part of the France 2030 National Investment Plan. The ultimate goal is to install ten times as much renewable energy by 2050, or up to 100 GW. 40 GW of total installed capacity will come from offshore wind projects.
- All the factors above are anticipated to increase the demand for flexible glass through the forecast period.
Asia-Pacific to Dominate the Market
- Asia-Pacific is expected to dominate the flexible glass market during the forecast period due to the increasing demand for solar panels and voltaic cell manufacturing in countries such as China, South Korea, and Japan.
- The world will almost completely rely on China to supply key building blocks for solar panel production through 2025.
- According to information released by the National Energy Administration of China in late January, China installed 87 gigawatts (GW) in 2022, up 59% year over year (y/y).
- According to National Renewable Energy Laboratory (NREL), China installed 87 GW of solar in 2022, a 59% increase from the previous year. Furthermore, PV installations in India increased by 51% during the first nine months of 2022
- In India, a "Development of Solar Parks and Ultra Mega Solar Power Projects" plan is being implemented with a goal capacity of 40 GW by March 2024 to support big-scale grid-connected solar power projects. Solar projects capacity of 832 MW will be commissioned in various Solar Parks from January to October 2022.
- Japan substantially increased its electricity production from renewable energy sources in recent years, making it one of the top nations in installed renewable energy capacity. The Japanese government raised its objective for the proportion of renewable energy to 38% by 2030 under the new Strategic Energy Plan. Additionally, by 2050, the nation wants to be completely carbon neutral.
- Therefore, the abovementioned factors and government support contribute to the increasing demand for the flexible glass market in Asia-Pacific during the forecast period.
Flexible Glass Industry Overview
The flexible glass market is consolidated in nature. The major players (not in any particular order) include Saint-Gobain, AGC Inc., Corning Incorporated, LG DISPLAY CO., LTD., and Nippon Electric Glass Co. Ltd, among others.
Additional Benefits:
- The market estimate (ME) sheet in Excel format
- 3 months of analyst support
TABLE OF CONTENTS
1 INTRODUCTION
- 1.1 Study Deliverables
- 1.2 Study Assumptions
- 1.3 Scope of the Study
2 RESEARCH METHODOLOGY
3 EXECUTIVE SUMMARY
4 MARKET DYNAMICS
- 4.1 Drivers
- 4.1.1 Increasing Demand From Electrical and Electronics and Consumer Goods Industries
- 4.1.2 Lower Cost of Raw Material
- 4.1.3 Other Drivers
- 4.2 Restraints
- 4.2.1 High Production Complexity
- 4.2.2 Environmental Concerns and Health Issues due to Silica Fumes
- 4.2.3 Other Restraints
- 4.3 Value Chain / Supply Chain Analysis
- 4.4 Porter's Five Forces Analysis
- 4.4.1 Bargaining Power of Suppliers
- 4.4.2 Bargaining Power of Consumers
- 4.4.3 Threat of New Entrants
- 4.4.4 Threat of Substitute Products and Services
- 4.4.5 Degree of Competition
5 MARKET SEGMENTATION (Market Size in Value)
- 5.1 Application
- 5.1.1 Display
- 5.1.2 Solar Panel
- 5.1.3 Photovoltaic Cell
- 5.1.4 Other Applications
- 5.2 End-user Industry
- 5.2.1 Electrical and Electronics
- 5.2.2 Automotive
- 5.2.3 Medical
- 5.2.4 Wearable Devices
- 5.2.5 Other End-user Industries
- 5.3 Geography
- 5.3.1 Asia-Pacific
- 5.3.1.1 China
- 5.3.1.2 India
- 5.3.1.3 Japan
- 5.3.1.4 South Korea
- 5.3.1.5 Rest of Asia-Pacific
- 5.3.2 North America
- 5.3.2.1 United States
- 5.3.2.2 Canada
- 5.3.2.3 Mexico
- 5.3.3 Europe
- 5.3.3.1 Germany
- 5.3.3.2 United Kingdom
- 5.3.3.3 France
- 5.3.3.4 Italy
- 5.3.3.5 Rest of Europe
- 5.3.4 South America
- 5.3.4.1 Brazil
- 5.3.4.2 Argentina
- 5.3.4.3 Rest of South America
- 5.3.5 Middle East & Africa
- 5.3.5.1 Saudi Arabia
- 5.3.5.2 South Africa
- 5.3.5.3 Rest of Middle East & Africa
- 5.3.1 Asia-Pacific
6 COMPETITIVE LANDSCAPE
- 6.1 Mergers and Acquisitions, Joint Ventures, Colaborations and Agreements
- 6.2 Market Share Analysis (%)**/Ranking Analysis
- 6.3 Strategies Adopted by Leading Players
- 6.4 Company Profiles
- 6.4.1 Abrisa Technologies
- 6.4.2 AGC Inc.
- 6.4.3 Corning Incorporated
- 6.4.4 DuPont
- 6.4.5 Kent Displays, Inc.
- 6.4.6 KYOCERA Corporation
- 6.4.7 LG DISPLAY CO., LTD
- 6.4.8 Murata Manufacturing Co., Ltd
- 6.4.9 Nippon Electric Glass Co. Ltd
- 6.4.10 Saint-Gobain
- 6.4.11 SCHOTT AG
- 6.4.12 UNIVERSAL DISPLAY
7 MARKET OPPORTUNITIES AND FUTURE TRENDS
- 7.1 Increasing Usage in Solar panels, Automotive, and Defense Sector
- 7.2 Other Opportunities

