
|
市場調査レポート
商品コード
1940883
アフリカのポリエチレンテレフタレート(PET):市場シェア分析、業界動向と統計、成長予測(2026年~2031年)Africa Polyethylene Terephthalate (PET) - Market Share Analysis, Industry Trends & Statistics, Growth Forecasts (2026 - 2031) |
||||||
カスタマイズ可能
適宜更新あり
|
|||||||
| アフリカのポリエチレンテレフタレート(PET):市場シェア分析、業界動向と統計、成長予測(2026年~2031年) |
|
出版日: 2026年02月09日
発行: Mordor Intelligence
ページ情報: 英文 100 Pages
納期: 2~3営業日
|

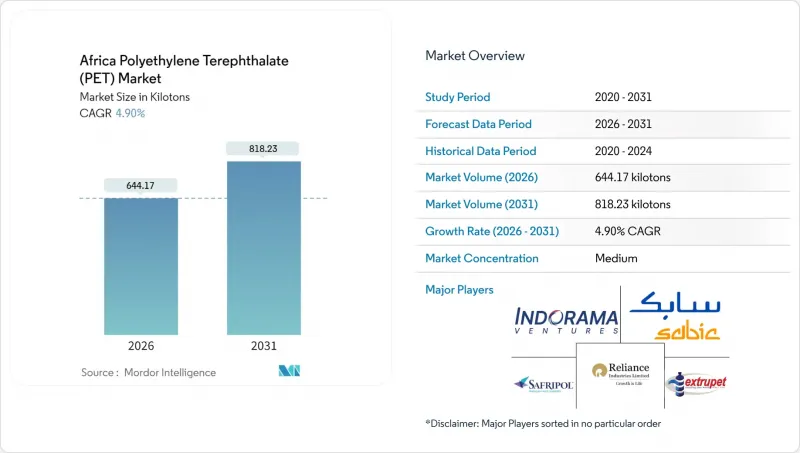
概要
アフリカのポリエチレンテレフタレート(PET)市場規模は、2026年に644.17キロトンと推定されております。
これは2025年の614.08キロトンから成長し、2031年には818.23キロトンに達すると予測されております。2026年から2031年にかけてはCAGR4.9%で成長する見込みです。
持続的な中産階級の成長、アフリカ大陸自由貿易圏(AfCFTA)における関税調和、現地ボトリング能力の拡大が需要を牽引する主要因です。ブランド所有者は、透明性、強度対重量比、既存充填ラインでの親和性からPETを好んで採用しており、生産者責任規制の強化に伴い再生グレードの需要も拡大しています。多国籍消費財メーカー(FMCG)は現地生産拠点の構築を継続し、供給バランスを輸入依存から地域樹脂プラント中心へと転換しています。公共セクター融資は循環型経済目標に沿い、大規模なブルーローンやグリーンボンドを統合的な回収・リサイクルインフラへ誘導しています。しかしながら、原油連動原料価格の変動やバイオベース代替品への消費者関心は戦略的不確実性を生み、機敏な調達戦略と製品革新が求められています。
アフリカにおけるポリエチレンテレフタレート(PET)市場の動向と洞察
地域で拡大する中産階級による飲料消費の増加
都市部における急速な所得増加が、炭酸飲料、ボトル入り飲料水、機能性飲料の需要を牽引しています。コカ・コーラHBCはナイジェリアにおける生産能力増強に10億米ドルを投じ、コカ・コーラ・ビバレッジズ・アフリカは2024年にナミビアに5,000万米ドルのボトリングラインを開設しました。生産量の増加はプリフォームやキャップの大型オフテイク契約につながり、バージン樹脂の安定した需要を確保します。消費拡大に伴い未整備の廃棄物処理システムに負荷がかかり、ラゴスやアクラなどの都市では生産者負担金によるデポジット返還制度の試験導入が進んでいます。飲料メーカーはキャップ成形、ストレッチブロー成形、充填ラインの集約化により輸送コスト削減とリードタイム短縮を図っています。充填量の増加により単位当たりの包装コストが圧縮され、PETはガラスやアルミに対する価格競争力を維持しています。
政府が定める再生材含有包装の目標
ケニアの2024年拡大生産者責任(EPR)規制では、輸入品1点につき150ケニアシリングの課徴金を課し、ブランド登録を義務付けることで、再生材使用に明確なインセンティブを設けています。南アフリカのEPR枠組み(2021年施行)では、回収・処理量の年次報告が求められます。ナイジェリアの規制当局も同様の規則を策定中であり、インフラ整備が整い次第、最低再生材含有率の段階的導入を予定しています。ペプシコ・サブサハラアフリカは現在、飲料ライン全体で20%の再生ポリエステル(rPET)含有を目標としており、地域的な調達契約の基盤を確立しています。より高いrPET比率を認証した企業は、新興のエコラベル制度のもとで店頭での可視性向上という利点を得られます。ただし、効果的な施行には、非公式収集業者の正規化と、洗浄・固相重縮合(SSP)ユニットの食品グレード基準へのアップグレードが不可欠です。
バイオベース/堆肥化可能代替品への消費者シフトの加速
バイオベース包装を採用した世界の食品・飲料新製品は、2019年から2024年にかけて年間60%増加しました。欧州連合(EU)の規制では特定の生分解性ポリマーをリサイクル可能と認定しており、アフリカの政策立案者が模倣する可能性のある規制上の先例となっています。各ブランドは堆肥化可能なコーヒーカプセルや澱粉ベースのポットを試験導入しており、ニッチ分野におけるPET使用量に圧力をかけています。再生PETは通常、バージン素材より1トンあたり150米ドル高く取引されるため、長期的なコスト均衡が達成できれば、バイオベースソリューションの試験導入意欲が高まります。ただし、原料の物流、特殊押出設備、産業用堆肥化施設の不足により、アフリカにおけるバイオポリマー供給の拡大は依然として複雑な課題です。
セグメント分析
2025年、バージンPETはアフリカにおけるポリエチレンテレフタレート(PET)市場シェアの82.78%を占めました。これは、コンバーターがその安定した固有粘度と幅広い食品グレード認証を重視しているためです。このセグメントは、成熟した輸入ルート、原材料の関税優遇措置、豊富なプリフォーム変換能力の恩恵を受けています。ボトルからボトルへの再生PET(rPET)は、高品質フレークの製造に特殊な高温洗浄ラインとSSPラインが必要であり、現在これを稼働している工場がごく少数であるため、供給制約が続いています。
再生PETは、EPR規制と飲料大手による自主的誓約(経営陣報酬を循環型包装の達成目標に連動させる)を原動力に、2031年までCAGR7.85%で拡大しています。国際金融公社(IFC)の融資が新たな洗浄ラインとSSPのボトルネック解消を支援する一方、鎖延長添加剤により透明性を損なわずに固有粘度を回復することが可能となりました。こうした投資が拡大する中、アフリカにおける再生グレードのポリエチレンテレフタレート(PET)市場規模は、2020年代末までに二桁のシェアを獲得する可能性があります。ただし、ベール供給・規制整合性・信用市場が整い、大規模な再生PET(rPET)統合のリスクが低減されるまでは、バージン樹脂が主流であり続けるでしょう。
アフリカ・ポリエチレンテレフタレート(PET)市場レポートは、原料タイプ別(バージンPET、再生PET)、エンドユーザー産業別(自動車、建築・建設、電気・電子、産業・機械、包装、その他エンドユーザー産業)、地域別(ナイジェリア、南アフリカ、その他のアフリカ諸国)に分類されています。市場予測は数量(トン)および金額(米ドル)で提供されます。
その他の特典:
- エクセル形式の市場予測(ME)シート
- アナリストによる3ヶ月間のサポート
よくあるご質問
目次
第1章 イントロダクション
- 調査の前提条件と市場の定義
- 調査範囲
第2章 調査手法
第3章 エグゼクティブサマリー
第4章 市場情勢
- 市場概要
- 市場促進要因
- 同地域における中産階級の拡大に伴う飲料消費量の増加
- 再生材含有包装に関する政府目標
- 多国籍消費財メーカーによる現地ボトリング能力の拡大
- アフリカ大陸自由貿易圏(AfCFTA)による関税調整がPET輸入コストを低減
- 新興DFI/IFCによるPETリサイクルインフラ向け融資
- 市場抑制要因
- 原油価格連動の原料価格の変動性
- バイオベース/堆肥化可能な代替品への消費者シフトの増加
- 再生ポリエチレン(rPET)原料向け小規模回収ネットワーク
- バリューチェーン分析
- ポーターのファイブフォース
- 新規参入業者の脅威
- 供給企業の交渉力
- 買い手の交渉力
- 代替品の脅威
- 競争企業間の敵対関係
- 輸入・輸出動向
- 価格動向
- 形態の動向
- リサイクル概要
- 規制の枠組み
- 最終用途セクター動向
- 航空宇宙(航空宇宙部品生産収益)
- 自動車(自動車生産台数)
- 建築・建設(新築床面積)
- 電気・電子機器(電気・電子機器生産収益)
- 包装(プラスチック包装量)
第5章 市場規模と成長予測(金額と数量)
- 原料タイプ別
- バージンPET
- 再生PET(rPET)
- エンドユーザー業界別
- 自動車
- 建築・建設
- 電気・電子機器
- 産業・機械
- 包装
- その他のエンドユーザー産業
- 地域別
- ナイジェリア
- 南アフリカ
- その他アフリカ
第6章 競合情勢
- 市場集中度
- 戦略的動向
- 市場シェア(%)**/順位分析
- 企業プロファイル
- Alpek S.A.B. de C.V.
- ALPLA
- Extrupet(Pty)Ltd.
- Far Eastern New Century Co., Ltd.
- Indorama Ventures Public Company Limited.
- Mohinani Group
- Mpact Group Limited
- PETCO
- Reliance Industries Limited
- SABIC
- Safripol Pty Ltd
- Sumilon Eco Pet Sarl
