
|
市場調査レポート
商品コード
1693801
南米のデータセンター:市場シェア分析、産業動向、成長予測(2025年~2030年)South America Data Center - Market Share Analysis, Industry Trends & Statistics, Growth Forecasts (2025 - 2030) |
||||||
カスタマイズ可能
適宜更新あり
|
|||||||
| 南米のデータセンター:市場シェア分析、産業動向、成長予測(2025年~2030年) |
|
出版日: 2025年03月18日
発行: Mordor Intelligence
ページ情報: 英文 203 Pages
納期: 2~3営業日
|

全表示
- 概要
- 目次
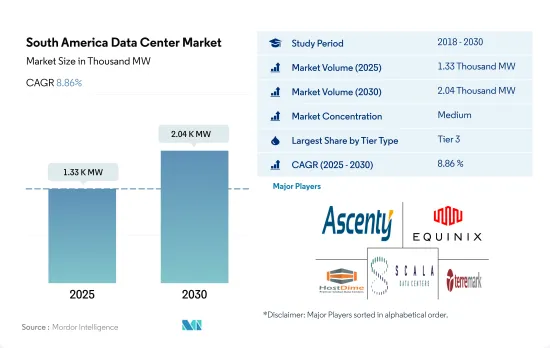
南米のデータセンター市場規模は、2025年に1,330MWと推定され、2030年には2,040MWに達し、CAGR 8.86%で成長すると予測されます。
また、2025年のコロケーション収益は50億910万米ドル、2030年には85億2,470万米ドルに達すると予測され、予測期間(2025~2030年)のCAGRは11.22%です。
2023年の市場シェアはTier 3データセンターが大半を占めるが、予測期間ではTier 4が急成長
- 南米市場では現在、Tier 3セグメントがその特長の大きな優位性から大半のシェアを占めています。このティアタイプは冗長性が高く、電源と冷却に複数の経路を持っています。これらのデータセンターの稼働率は約99.982%で、ダウンタイムは年間1.6時間です。エッジ接続やクラウド接続の採用が進むにつれ、ティア3セグメントの成長はさらに拡大すると予想されます。
- ブラジルは、この地域で最も多くのティア3データセンターを擁しています。2022年には、ブラジルの58のデータセンターがTier 3認証を取得しています。2022年には、サンパウロが77.9%、リオデジャネイロが27.2%と、国内で最も多くのTier 3データセンターをホストしています。その他のホットスポット(セアラ、カスカベル、クリチバ、リベイラオ・プレットなど)のシェアは14.8%でした。ティア3セグメントは、2023年の649MWから2029年には987.67MWに成長し、CAGRは7.25%と予測されます。
- Tier 4セグメントは、予測期間中に20.94%という最高のCAGRで推移すると予想されます。ブラジルのような様々な先進諸国は、すべてのコンポーネントについて完全な耐障害性と冗長性を持つTier 4認証の採用に注力しています。これが、開発地域でもTier 4タイプを採用する主要理由です。同市場の主要企業は、予測期間中に17施設を持つScala Data Centers(366 MW)や1施設を持つODATA(24 MW)などの施設を拡大する見込みです。
- ティア1&2セグメントは、GDP成長率が低く費用負担の大きい低開発国の発展途上国で大きな成長が見込まれます。これらの国には、ボリビア、パラグアイ、スリナム、エクアドルなどが含まれ、Tier 3とTier 4施設を購入する余裕のない中小企業が大半を占めています。
ブラジルが主要シェアを占め、調査期間中も優位が続く見込み
- 南米のデータセンター市場では、ブラジルとチリが最大のシェアを占めています。ブラジル政府は、Regime Especial de Tributacao do Programa Nacional de Banda Larga(REPNBL)プログラムを通じてインセンティブを提供しており、これにはインフラ購入に対するインセンティブも含まれています。ブラジルは、Ascenty、Scala Data Centers、ODATAなどのコロケーションプロバイダや、GlobeNet Telecom、Ava Telecom、Embratelなどの通信事業者からの投資により、2021年の値から投資の絶対額が40%増加しました。ブラジルの重要な金融都市であるサンパウロは、データセンターの主要拠点となっています。リオデジャネイロやフォルタレザといった他の都市も、ブラジルの主要な投資拠点となっています。
- チリは競合エネルギー価格を持っているが、これは主に、今後数年間で自然再生可能エネルギー発電の可能性を活用する計画によるものです。エネルギーコストは5年前の3分の1にまで下がり、その主要因は、現在総発電量の46%を占める再生可能エネルギーです。チリは伝統的にこの地域で最も優れた通信インフラを有しており、完全に冗長化されたファイバー・バックボーンを確保するため、2つの大規模なファイバープロジェクトが進行中です。これには、深南部とGtdの南北3,500kmの海底ケーブルを結ぶ国営のFibra Optica Austral(FOA)海底ケーブルが含まれます。2022年には、Scala Data Centers、ODATA、Ascenty(Digital Realty)、EdgeConneXなどのコロケーション事業者が、チリのデータセンター市場への主要な投資家となりました。
- アルゼンチンでは、ブエノスアイレスが主要投資先で、同市の特定されたサードパーティ施設が既存の電力容量の90%以上に寄与しています。既存のデータセンターのほとんどは、限られた面積に建設された小規模な施設です。国際再生可能エネルギー機関(IRENA)によると、アルゼンチンでは2020年に再生可能エネルギーが電力容量全体の約33%に貢献し、2025年までに再生可能エネルギーによる発電を20%にすることを目指しています。同国は今後、最大のデータセンターハブの1つになることを目指しています。
南米のデータセンター市場の動向
さまざまな企業によるインターネットやスマートフォン技術の高い導入率と、地域全体でのデジタル利用の拡大が市場需要を牽引
- 2020年、モバイル技術とサービスはラテンアメリカGDPの7.1%を占め、その貢献は3,400億米ドル以上の経済付加価値に達しました。また、モバイルエコシステムは160万人以上の雇用(直接・間接)を支えています。2025年までに、ラテンアメリカモバイルエコシステムの経済貢献は300億米ドル以上に拡大すると予想され、これは同地域の国々がモバイルサービスの利用拡大によってもたらされる生産性と効率の改善からますます恩恵を受けるようになるためです。
- ブラジルではデジタル利用が急速に拡大しています。さまざまな企業によるインターネットやスマートフォンの普及が、消費者の行動に影響を与えています。国内ではスマートフォンを購入できる人が増え、スマートフォン利用者の増加につながりました。2020年5月、南米でダウンロードされたショッピングアプリの大半はブラジルで開発されたもので、このカテゴリーでは約4,400万ダウンロードと突出しています。
- チリではeコマースが順調に拡大しています。チリの有料ユーザー1人当たりの平均年間売上は、2020年に913米ドルに達しました。チリの買い物客による国境を越えたeコマース購入は69%に達しています。その結果、膨大な量のデータが作成され、全国のデータセンターの需要が高まっています。南米では、新しいネットワークの継続的な展開、デバイス・エコシステムの拡大、消費者と企業向けの新しいアプリケーションの開発により、5Gへの移行が急速に進んでいます。
同地域では、銀行、ビジネス、通信サービスにおけるインターネットへの依存度が高まっており、FTTH加入者の増加が市場成長を牽引しています。
- 南米とカリブ海諸国では、固定ブロードバンドインターネットにアクセスできる人口は全体の50%以下で、光ファイバーによるインターネットアクセスはわずか9.9%に過ぎないです。多くの農村部では、高価なネットワーク機器のため、ネットワークカバレッジが不完全です。チリは、他の国々が固定ブロードバンドで追随するための基準を打ち立てた。チリのデータダウンロード速度はラテンアメリカ最速です。平均219Mbpsのチリは、この地域最大の経済大国ブラジルを大きく引き離しており、ブラジルのインターネットダウンロード速度は平均95.95Mbpsです。
- ブラジルの人々は、COVID-19パンデミックの間、バンキング、ビジネス、通信、レジャーにおいてますますインターネットに依存するようになりました。しかし、2021年4月現在、ブラジルの固定ブロードバンド通信速度は世界49位、モバイル通信速度は世界74位です。これは、インターネットへのアクセスとブロードバンド速度が急速に伸びていることを示しており、データセンターがより高速なデータ転送、より高速なストレージレート、より低遅延の恩恵を受けることを意味しています。
- ラテンアメリカFTTH(FTTH)市場は、2022年に約1億500万世帯がファイバーに接続される見込みで、2021年末に比べ36%増、2,800万世帯が新たにファイバーに接続されることになります。ラテンアメリカファイバー普及率は現在61%近くに達しています。投資面では、2021年に固定ブロードバンド(FTTH)市場に参入するため、チリの携帯電話事業者WOMがデジタルイネーブルメントと収益管理ソフトウェア企業Aleppoと提携しました。
南米のデータセンター産業概要
南米のデータセンター市場は適度に統合されており、上位5社で50.76%を占めています。この市場の主要企業は、Ascenty(Digital Realty Trust Inc.)、Equinix Inc.、HostDime Global Corp.、Scala Data Centers、Terremark(Verizon)などです。
その他の特典
- エクセル形式の市場予測(ME)シート
- 3ヶ月間のアナリストサポート
目次
第1章 エグゼクティブサマリーと主要調査結果
第2章 レポートのオファー
第3章 イントロダクション
- 調査の前提条件と市場定義
- 調査範囲
- 調査手法
第4章 市場展望
- 耐荷重
- 床面積
- コロケーション収入
- 設置ラック数
- ラックスペース利用率
- 海底ケーブル
第5章 主要産業動向
- スマートフォンユーザー数
- スマートフォン1台当たりのデータトラフィック
- モバイルデータ速度
- ブロードバンドデータ速度
- 光ファイバー接続ネットワーク
- 規制の枠組み
- ブラジル
- チリ
- バリューチェーンと流通チャネル分析
第6章 市場セグメンテーション
- データセンターの規模
- 大規模
- 超大規模
- 中規模
- メガ規模
- 小規模
- ティアタイプ
- ティア1と2
- ティア3
- ティア4
- 吸収量
- 非利用
- 利用
- コロケーションタイプ別
- ハイパースケール
- リテール
- ホールセール
- エンドユーザー別
- BFSI
- クラウド
- eコマース
- 政府機関
- 製造業
- メディア&エンターテイメント
- テレコム
- その他
- 国名
- ブラジル
- チリ
- その他の南米
第7章 競合情勢
- 市場シェア分析
- 企業情勢
- 企業プロファイル
- Ascenty(Digital Realty Trust Inc.)
- EdgeUno Inc.
- Equinix Inc.
- GTD Grupo Teleductos SA
- HostDime Global Corp.
- Lumen Technologies Inc.
- NABIAX
- ODATA(Patria Investments Ltd)
- Quantico Data Center
- Scala Data Centers
- SONDA SA
- Terremark(Verizon)
第8章 CEOへの主要戦略的質問
第9章 付録
- 世界概要
- 概要
- ファイブフォース分析フレームワーク
- 世界のバリューチェーン分析
- 世界市場規模とDRO
- 情報源と参考文献
- 図表リスト
- 主要な洞察
- データパック
- 用語集
The South America Data Center Market size is estimated at 1.33 thousand MW in 2025, and is expected to reach 2.04 thousand MW by 2030, growing at a CAGR of 8.86%. Further, the market is expected to generate colocation revenue of USD 5,009.1 Million in 2025 and is projected to reach USD 8,524.7 Million by 2030, growing at a CAGR of 11.22% during the forecast period (2025-2030).
Tier 3 data centers accounts for majority market share in 2023, Tier-4 is the fastest growing in forecasted period
- The Tier 3 segment currently has a majority share in the South American market due to the major advantage of its features. This tier type has a high redundancy level and multiple paths for power and cooling. These data centers have an uptime of around 99.982%, translating into a downtime of 1.6 hours per year. With the increasing adoption of edge and cloud connectivity, the growth in the Tier 3 segment is expected to increase further.
- Brazil hosts the maximum number of Tier 3 data centers in the region. In 2022, 58 data centers in Brazil had Tier 3 certification. In 2022, Sao Paulo hosted the maximum number of Tier 3 data centers in the country, with a market share of 77.9% and Rio de Janeiro with 27.2%. Among other hotspots (Ceara, Cascavel, Curitiba, Ribeirao Preto, and others), the share was 14.8%. The Tier 3 segment is expected to grow from 649 MW in 2023 to 987.67 MW in 2029, at a projected CAGR of 7.25%.
- The Tier 4 segment is expected to record the highest CAGR of 20.94% during the forecast period. Various developed countries, such as Brazil, are focusing on adopting the Tier 4 certification to be completely fault-tolerant and redundant for every component. This is the major reason why even the developing regions are adopting the Tier 4 type. Major players in the market are expected to expand their facilities, which include Scala Data Centers (366 MW) with 17 facilities and ODATA (24 MW) with one facility during the forecast period.
- The Tier 1 & 2 segment is expected to showcase significant growth in developing countries, with a low GDP rate index in under-developed countries with a high expense burden. These countries include Bolivia, Paraguay, Suriname, and Ecuador, which have the majority of SMEs that cannot afford Tier 3 and 4 facilities.
Brazil holds the major share and expected to continue the dominance during the study period
- Brazil and Chile hold the largest shares in the South American data center market. The Brazilian government provides incentives through the Regime Especial de Tributacao do Programa Nacional de Banda Larga (REPNBL) program, which includes incentives for purchasing infrastructure that help improve colocation services in the country. Brazil has witnessed an absolute growth of 40% in investments from the 2021 values due to investments from colocation providers such as Ascenty, Scala Data Centers, and ODATA and telecom operators such as GlobeNet Telecom, Ava Telecom, and Embratel. Sao Paulo, Brazil's significant financial capital, serves as the primary data center hub. Other cities, such as Rio de Janeiro and Fortaleza, are major investment locations in Brazil.
- Chile has competitive energy prices, primarily fueled by plans to take advantage of its natural renewable energy generation potential over the coming years. Energy costs have dropped to one-third of what they were five years ago, mainly based on renewable energy that now makes up 46% of the total produced. Chile traditionally has some of the region's best telecommunications infrastructure, and two major fiber projects are underway to ensure it will have a fully redundant fiber backbone. These include the state-funded Fibra Optica Austral (FOA) submarine cable connecting the deep south and Gtd's 3,500 km north-south submarine cable. In 2022, colocation operators, such as Scala Data Centers, ODATA, Ascenty (Digital Realty), and EdgeConneX, were the major investors in the Chilean data center market.
- In Argentina, Buenos Aires is the major investment destination, with the identified third-party facilities in the city contributing to over 90% of the existing power capacity. Most existing data centers are smaller facilities built over a limited area. The International Renewable Energy Agency (IRENA) stated that renewable energy contributed to around 33% of the overall electricity capacity in 2020 in Argentina, and the country aims to generate 20% of the electricity via renewable sources by 2025. The country aims to be one of the largest data center hubs in the coming time period.
South America Data Center Market Trends
The high internet and smartphone technology adoption by various businesses and growing digital usage across the region drives the market demand
- In 2020, mobile technologies and services accounted for 7.1% of GDP in Latin America - a contribution that amounted to more than USD 340 billion of economic value added. The mobile ecosystem also supported more than 1.6 million jobs (directly and indirectly). By 2025, the economic contribution of the Latin American mobile ecosystem will grow by more than USD 30 billion as countries in the region increasingly benefit from the improvements in productivity and efficiency brought about by the increased take-up of mobile services.
- Digital usage is expanding rapidly in Brazil. The high internet and smartphone technology adoption by various businesses has impacted consumer behavior. More people in the country can now purchase smartphones, leading to a growing number of smartphone users. In May 2020, most shopping apps downloaded in South America were developed in Brazil, which stood out with approximately 44 million app downloads in this category.
- In Chile, e-commerce is expanding steadily. Chile's average annual revenue per paying user amounted to USD 913 in 2020. Most cross-border e-commerce purchases by Chilean shoppers stand at 69%. As a result, vast amounts of data have been created, increasing the demand for data centers nationwide. In South America, the transition to 5G is progressing rapidly, driven by the continued rollout of new networks, the expansion of the device ecosystem, and the development of new applications for consumers and enterprises.
People across the region increasingly reliant on the internet for banking, business, & telecommunication services and increasing FTTH subscribers across the region drives the market growth
- In South America and the Caribbean, less than 50% of the population has access to fixed broadband internet, and only 9.9% has fiber internet access. Many rural areas have patchy network coverage due to expensive network equipment. Chile has set the standard for other countries to follow in fixed broadband. Chile has the fastest data download speeds in Latin America. With an average rate of 219 Mbps, Chile is well ahead of the region's largest economy, Brazil, where internet download speeds average 95.95 Mbps.
- The Brazilian population became increasingly reliant on the internet for banking, business, telecommunication, and leisure during the COVID-19 pandemic. However, the country ranked 49th globally for fixed broadband speed and 74th for mobile speed as of April 2021. This shows that access to the internet and broadband speed are growing rapidly, meaning data centers will benefit from faster data transfer, higher storage rates, and lower latency.
- Latin America's fiber-to-the-home (FTTH) market was set to register approximately 105 million homes with fiber in 2022, an increase of 36%, or 28 million new premises, compared with the end of 2021. Latin America now has a fiber penetration rate of nearly 61%. In terms of investment, in 2021, to penetrate the fixed broadband (FTTH) market, Chilean mobile operator WOM teamed with digital enablement and revenue management software company Aleppo.
South America Data Center Industry Overview
The South America Data Center Market is moderately consolidated, with the top five companies occupying 50.76%. The major players in this market are Ascenty (Digital Realty Trust Inc.), Equinix Inc., HostDime Global Corp., Scala Data Centers and Terremark (Verizon) (sorted alphabetically).
Additional Benefits:
- The market estimate (ME) sheet in Excel format
- 3 months of analyst support
TABLE OF CONTENTS
1 EXECUTIVE SUMMARY & KEY FINDINGS
2 REPORT OFFERS
3 INTRODUCTION
- 3.1 Study Assumptions & Market Definition
- 3.2 Scope of the Study
- 3.3 Research Methodology
4 MARKET OUTLOOK
- 4.1 It Load Capacity
- 4.2 Raised Floor Space
- 4.3 Colocation Revenue
- 4.4 Installed Racks
- 4.5 Rack Space Utilization
- 4.6 Submarine Cable
5 Key Industry Trends
- 5.1 Smartphone Users
- 5.2 Data Traffic Per Smartphone
- 5.3 Mobile Data Speed
- 5.4 Broadband Data Speed
- 5.5 Fiber Connectivity Network
- 5.6 Regulatory Framework
- 5.6.1 Brazil
- 5.6.2 Chile
- 5.7 Value Chain & Distribution Channel Analysis
6 MARKET SEGMENTATION (INCLUDES MARKET SIZE IN VOLUME, FORECASTS UP TO 2030 AND ANALYSIS OF GROWTH PROSPECTS)
- 6.1 Data Center Size
- 6.1.1 Large
- 6.1.2 Massive
- 6.1.3 Medium
- 6.1.4 Mega
- 6.1.5 Small
- 6.2 Tier Type
- 6.2.1 Tier 1 and 2
- 6.2.2 Tier 3
- 6.2.3 Tier 4
- 6.3 Absorption
- 6.3.1 Non-Utilized
- 6.3.2 Utilized
- 6.3.2.1 By Colocation Type
- 6.3.2.1.1 Hyperscale
- 6.3.2.1.2 Retail
- 6.3.2.1.3 Wholesale
- 6.3.2.2 By End User
- 6.3.2.2.1 BFSI
- 6.3.2.2.2 Cloud
- 6.3.2.2.3 E-Commerce
- 6.3.2.2.4 Government
- 6.3.2.2.5 Manufacturing
- 6.3.2.2.6 Media & Entertainment
- 6.3.2.2.7 Telecom
- 6.3.2.2.8 Other End User
- 6.4 Country
- 6.4.1 Brazil
- 6.4.2 Chile
- 6.4.3 Rest of South America
7 COMPETITIVE LANDSCAPE
- 7.1 Market Share Analysis
- 7.2 Company Landscape
- 7.3 Company Profiles (includes Global Level Overview, Market Level Overview, Core Business Segments, Financials, Headcount, Key Information, Market Rank, Market Share, Products and Services, and Analysis of Recent Developments).
- 7.3.1 Ascenty (Digital Realty Trust Inc.)
- 7.3.2 EdgeUno Inc.
- 7.3.3 Equinix Inc.
- 7.3.4 GTD Grupo Teleductos SA
- 7.3.5 HostDime Global Corp.
- 7.3.6 Lumen Technologies Inc.
- 7.3.7 NABIAX
- 7.3.8 ODATA (Patria Investments Ltd)
- 7.3.9 Quantico Data Center
- 7.3.10 Scala Data Centers
- 7.3.11 SONDA SA
- 7.3.12 Terremark (Verizon)
- 7.4 LIST OF COMPANIES STUDIED
8 KEY STRATEGIC QUESTIONS FOR DATA CENTER CEOS
9 APPENDIX
- 9.1 Global Overview
- 9.1.1 Overview
- 9.1.2 Porter's Five Forces Framework
- 9.1.3 Global Value Chain Analysis
- 9.1.4 Global Market Size and DROs
- 9.2 Sources & References
- 9.3 List of Tables & Figures
- 9.4 Primary Insights
- 9.5 Data Pack
- 9.6 Glossary of Terms
