
米国の飼料用ミネラル:市場シェア分析、産業動向、統計、成長予測(2025年~2030年)
United States Feed Minerals - Market Share Analysis, Industry Trends & Statistics, Growth Forecasts (2025 - 2030)
- 発行日
- ページ情報
- 英文 180 Pages
- 納期
- 2~3営業日
- 商品コード
- 1693735
- カスタマイズ可能 お客様のご希望に応じて、既存データの加工や未掲載情報(例:国別セグメント)の追加などの対応が可能です。詳細はお問い合わせください。
- 適宜更新あり 本レポートは最新情報反映のため適宜更新し、内容構成変更を行う場合があります。ご検討の際はお問い合わせください。
- 翻訳ツール提供対象 PDF対応AI翻訳ツールの無料貸し出しサービスのご利用が可能です
概要
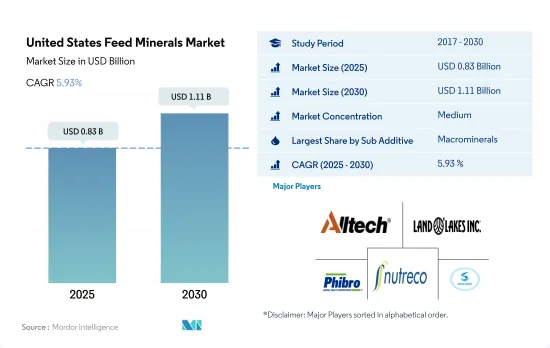
米国の飼料用ミネラル市場規模は2025年に8億3,000万米ドルと予測され、2030年には11億1,000万米ドルに達し、予測期間中(2025~2030年)のCAGRは5.93%で成長すると予測されています。
- 米国の飼料用ミネラルセグメントは、2022年に金額ベースで米国の飼料添加物市場の11.8%、北米の飼料添加物市場の8.2%を占めました。
- 2019年、市場は前年比36.2%成長したが、これは主に同期間に飼料生産量が20.5%大幅に増加したためです。人口の増加、飼料の大量消費、飼料輸出の増加などの要因が生産の伸びを牽引しました。
- 動物タイプ別では、反芻動物がミネラルの使用量において大きなシェアを占めており、2022年の米国の飼料用ミネラル市場の56.2%を占め、次いで家禽(26.4%)、豚(15.8%)となっています。
- 家禽は微量ミネラルの最も一般的なユーザーで、2022年の米国における市場金額の42.5%を占めます。肉牛は反芻動物の主要な微量ミネラルユーザーで、2022年の反芻動物微量ミネラル市場の71.6%を占めます。
- マクロミネラルは米国の飼料用ミネラル市場で最大のシェアを占め、2022年には米国の飼料用ミネラル市場の89.1%、飼料添加物市場の10.5%を占めます。
- 微量ミネラルは2022年に米国の飼料用ミネラル市場の10.9%を占め、予測期間中に4.9%のCAGRで推移すると予想されます。
- 食肉加工産業の高品質肉への需要が飼料用ミネラル消費を増加させました。そのため、2017~2022年にかけて、マクロミネラル市場は73.1%成長しました。
- ミネラル飼料市場は近年急成長しており、今後さらに増加する可能性が高いです。米国では1人当たり所得が上昇し、食肉生産量も大量に増加しているため、予測期間中にCAGR 5.9%で拡大すると予測されます。
米国の飼料用ミネラル市場動向
米国の鶏肉産業は最大の商業食品産業の一つであり、肉と卵の消費の増加が鶏肉生産を増加させています。
- 米国の鶏肉産業は、業務用食品産業における鶏卵と鶏肉の需要の増加と輸出の増加により繁栄しています。同国は世界有数の鶏卵生産・輸出国であり、2020年の鶏卵輸出総額は前年比9.3%増の35億卵、輸出額は2.4%増の1億8,900万米ドルです。
- 米国における鶏肉の消費は、良好な価格、高タンパク質食への意識の高まり、鶏肉の需要増加により改善しています。その結果、家禽鳥の頭数は2022年に前年比1,760万羽増加しました。狭いスペースと異なる環境で鶏を飼育することで、鶏肉生産は牛肉や豚肉よりも実現可能で安価になり、飼育面積が限られた畜産農業従事者が養鶏場に投資するようになりました。
- しかし、輸入に占める米国のシェアは2021年の26%から2031年には24%に減少すると予想されており、これが家禽飼料市場の成長に影響を与える可能性があります。2018~2019年にかけての豚インフルエンザと中国との貿易紛争も、畜産農業従事者が飼育増加に消極的であったため、歴史的期間中の家禽個体数が堅調に推移する一因となりました。
- このような課題にもかかわらず、食肉と卵の消費の増加と輸出の増加は、家禽人口の増加と相まって、予測期間中の米国の飼料添加物市場の成長を促進すると予想されます。
多数の養殖場と飼料工場の存在が養殖用飼料生産の増加に寄与しています。
- 米国の養殖用飼料生産量は、2017年と比較して2022年には4.1%増加しました。米国では合計6,232に上る多数の飼料工場の存在がこの増加に寄与しています。魚介類の一人当たり消費量も2018年の21.88kgから2022年には22.26kgに増加しました。
- 魚は様々な養殖飼料の中で大きなシェアを占めており、2022年には83.2%を占めます。このシェアの増加は、人間の食事における魚の利点に関する意識の高まり、国際市場における高い需要、小売部門の拡大、国内における多数の養殖場の存在に起因すると考えられます。養殖場の大半はオハイオ州にあり、最も消費されている魚はナマズです。これは、ナマズがペレット飼料を魚のポンドに変えることができるためです。
- エビは2022年の養殖飼料市場の7.5%を占め、水産物需要の高まりと高タンパク質含量のため、他の最も消費される水生動物です。しかし、同国はエビを他国に依存しているため、調査期間中の成長に影響を及ぼしています。一方、他の水生動物タイプは、COVID-19以降、二枚貝がメイン料理として人気となり、レストランからの需要が増加したため、需要が高い伸びを示しました。飼料工場の数が多く、水産養殖の飼料生産量の増加に伴って魚介類の需要が高まっていることが、予測期間中の米国の飼料添加物市場の成長を促進すると予想されます。
米国の飼料用ミネラル産業概要
米国の飼料用ミネラル市場は適度に統合されており、上位5社で42.35%を占めています。この市場の主要企業は、Alltech、Inc.、Land O'Lakes、Phibro Animal Health Corporation、SHV(Nutreco NV)and Solvay S.A.などです。
その他の特典
- エクセル形式の市場予測(ME)シート
- 3ヶ月のアナリストサポート
目次
第1章 エグゼクティブサマリーと主要調査結果
第2章 レポートのオファー
第3章 イントロダクション
- 調査の前提条件と市場定義
- 調査範囲
- 調査手法
第4章 主要産業動向
- 動物頭数
- 家禽
- 反芻動物
- 豚
- 飼料生産
- 水産養殖
- 家禽
- 反芻動物
- 養豚
- 規制の枠組み
- 米国
- バリューチェーンと流通チャネル分析
第5章 市場セグメンテーション
- サブ添加物
- マクロミネラル
- 微量ミネラル
- 動物
- 水産養殖
- サブ動物別
- 魚類
- エビ
- 魚類
- その他の養殖種
- 家禽類
- サブ動物別
- ブロイラー
- レイヤー
- その他の鳥類
- 反芻動物
- 小動物別
- 肉牛
- 乳牛
- その他の反芻動物
- 豚
- その他の動物
- 水産養殖
第6章 競争情勢
- 主要な戦略的動き
- 市場シェア分析
- 企業情勢
- 企業プロファイル
- Adisseo
- Alltech, Inc.
- Archer Daniel Midland Co.
- BASF SE
- Cargill Inc.
- Kemin Industries
- Land O'Lakes
- Phibro Animal Health Corporation
- SHV(Nutreco NV)
- Solvay S.A.
第7章 CEOへの主要戦略的質問
第8章 付録
- 世界概要
- 概要
- ファイブフォース分析フレームワーク
- 世界のバリューチェーン分析
- 世界市場規模とDRO
- 情報源と参考文献
- 図表リスト
- 主要な洞察
- データパック
- 用語集
目次
Product Code: 93769
The United States Feed Minerals Market size is estimated at 0.83 billion USD in 2025, and is expected to reach 1.11 billion USD by 2030, growing at a CAGR of 5.93% during the forecast period (2025-2030).
- The US feed mineral segment accounted for 11.8% of the US feed additives market and 8.2% of the North American feed additives market in terms of value in 2022.
- In 2019, the market grew by 36.2% compared to the previous year, mainly due to the significant increase in feed production by 20.5% in the same period. Factors such as an increase in population, high consumption of feed, and rising feed exports drove the growth of production.
- Among animal types, ruminants hold a significant share in the usage of minerals, accounting for 56.2% of the US feed mineral market in 2022, followed by poultry (26.4%) and swine (15.8%).
- Poultry is the most common user of microminerals, accounting for 42.5% of the market value in the United States in 2022. Beef cattle are the leading ruminant micromineral users, accounting for 71.6% of the ruminant micromineral market in 2022.
- Macrominerals hold the largest share of the US feed minerals market, accounting for 89.1% of the US feed minerals market and 10.5% of the US feed additive market in 2022.
- Microminerals accounted for 10.9% of the United States feed minerals market in 2022, and it is expected to register a CAGR of 4.9% during the forecast period.
- The meat processing industry's demand for high-quality meat increased feed mineral consumption. Therefore, from 2017 to 2022, the macrominerals market grew by 73.1%.
- The market for mineral feeds has grown rapidly in recent years and is likely to increase further in the coming years. Because of rising per capita income and bulk meat output in the United States, the industry is estimated to expand at a CAGR of 5.9% during the forecast period.
United States Feed Minerals Market Trends
The United States poultry industry is one of the largest commercial food industry and increased consumption of meats and eggs is increasing the poultry production
- The US poultry industry is thriving due to the increasing demand for eggs and poultry meat in the commercial food industry and growing exports. The country is one of the largest egg producers and exporters globally, with the total egg exports in 2020 increasing by 9.3% to 3.5 billion eggs from the previous year and the export value growing by 2.4% to USD 189 million.
- The consumption of poultry meat in the United States has improved due to favorable prices, a rise in awareness of a high-protein diet, and the increasing demand for poultry meat. As a result, the poultry bird's headcount increased by 17.6 million in 2022 compared to the previous year. Raising chickens in small spaces and different environments makes poultry production more feasible and less expensive than beef and pork, attracting animal farmers with limited rearing areas to invest in poultry farms.
- However, the share of the United States is expected to decrease from 26% in 2021 to 24% in 2031 in terms of imports, which can affect the growth of the poultry feed market. The swine flu and trade disputes with China between 2018 and 2019 also contributed to the steady poultry population during the historical period, as animal farmers were reluctant to increase rearing.
- Despite these challenges, the increasing consumption of meat and eggs and rising exports, combined with the growing poultry population, are expected to drive the growth of the US feed additives market during the forecast period.
Presence of a large number of fish farms and feed mills is contributing to increasing feed production for aquaculture
- The aquaculture feed production in the United States increased by 4.1% in 2022 compared to 2017. The presence of a large number of feed mills, which totaled 6,232 in the United States, contributed to this increase. The per capita consumption of seafood also increased from 21.88 kg in 2018 to 22.26 kg in 2022.
- Fish has a major share among the various aquaculture feed, accounting for 83.2% in 2022. This increasing share can be attributed to the rising awareness about the benefits of fish in the human diet, high demand in the international market, expansion of the retail sector, and the presence of a large number of fish farms in the country. The majority of fish farms are located in Ohio, and the most consumed fish is catfish. This is because catfish can convert pellet feed into fish pounds.
- Shrimp accounted for 7.5% of the aquaculture feed market in 2022, as it is the other most consumed aquatic animal due to the rise in demand for seafood and its high protein content. However, the country depends on other countries for shrimp, which has affected its growth during the study period. On the other hand, other aquatic species have witnessed high growth in demand, as the demand for bivalves from restaurants has increased after COVID-19 due to their popularity as a main cuisine. The high number of feed mills and rising demand for fish and seafood with increasing feed production of aquaculture are expected to drive the growth of the US feed additives market during the forecast period.
United States Feed Minerals Industry Overview
The United States Feed Minerals Market is moderately consolidated, with the top five companies occupying 42.35%. The major players in this market are Alltech, Inc., Land O'Lakes, Phibro Animal Health Corporation, SHV (Nutreco NV) and Solvay S.A. (sorted alphabetically).
Additional Benefits:
- The market estimate (ME) sheet in Excel format
- 3 months of analyst support
TABLE OF CONTENTS
1 EXECUTIVE SUMMARY & KEY FINDINGS
2 REPORT OFFERS
3 INTRODUCTION
- 3.1 Study Assumptions & Market Definition
- 3.2 Scope of the Study
- 3.3 Research Methodology
4 KEY INDUSTRY TRENDS
- 4.1 Animal Headcount
- 4.1.1 Poultry
- 4.1.2 Ruminants
- 4.1.3 Swine
- 4.2 Feed Production
- 4.2.1 Aquaculture
- 4.2.2 Poultry
- 4.2.3 Ruminants
- 4.2.4 Swine
- 4.3 Regulatory Framework
- 4.3.1 United States
- 4.4 Value Chain & Distribution Channel Analysis
5 MARKET SEGMENTATION (includes market size in Value in USD and Volume, Forecasts up to 2030 and analysis of growth prospects)
- 5.1 Sub Additive
- 5.1.1 Macrominerals
- 5.1.2 Microminerals
- 5.2 Animal
- 5.2.1 Aquaculture
- 5.2.1.1 By Sub Animal
- 5.2.1.1.1 Fish
- 5.2.1.1.2 Shrimp
- 5.2.1.1.3 fish
- 5.2.1.1.4 Other Aquaculture Species
- 5.2.2 Poultry
- 5.2.2.1 By Sub Animal
- 5.2.2.1.1 Broiler
- 5.2.2.1.2 Layer
- 5.2.2.1.3 Other Poultry Birds
- 5.2.3 Ruminants
- 5.2.3.1 By Sub Animal
- 5.2.3.1.1 Beef Cattle
- 5.2.3.1.2 Dairy Cattle
- 5.2.3.1.3 Other Ruminants
- 5.2.4 Swine
- 5.2.5 Other Animals
- 5.2.1 Aquaculture
6 COMPETITIVE LANDSCAPE
- 6.1 Key Strategic Moves
- 6.2 Market Share Analysis
- 6.3 Company Landscape
- 6.4 Company Profiles (includes Global Level Overview, Market Level Overview, Core Business Segments, Financials, Headcount, Key Information, Market Rank, Market Share, Products and Services, and Analysis of Recent Developments).
- 6.4.1 Adisseo
- 6.4.2 Alltech, Inc.
- 6.4.3 Archer Daniel Midland Co.
- 6.4.4 BASF SE
- 6.4.5 Cargill Inc.
- 6.4.6 Kemin Industries
- 6.4.7 Land O'Lakes
- 6.4.8 Phibro Animal Health Corporation
- 6.4.9 SHV (Nutreco NV)
- 6.4.10 Solvay S.A.
7 KEY STRATEGIC QUESTIONS FOR FEED ADDITIVE CEOS
8 APPENDIX
- 8.1 Global Overview
- 8.1.1 Overview
- 8.1.2 Porter's Five Forces Framework
- 8.1.3 Global Value Chain Analysis
- 8.1.4 Global Market Size and DROs
- 8.2 Sources & References
- 8.3 List of Tables & Figures
- 8.4 Primary Insights
- 8.5 Data Pack
- 8.6 Glossary of Terms
米国の飼料用ミネラル:市場シェア分析、産業動向、統計、成長予測(2025年~2030年)
- 発行日
- 発行
- Mordor Intelligence
- ページ情報
- 英文 180 Pages
- 納期
- 2~3営業日


