
|
市場調査レポート
商品コード
1911709
窒素肥料:市場シェア分析、業界動向と統計、成長予測(2026年~2031年)Nitrogenous Fertilizers - Market Share Analysis, Industry Trends & Statistics, Growth Forecasts (2026 - 2031) |
||||||
カスタマイズ可能
適宜更新あり
|
|||||||
| 窒素肥料:市場シェア分析、業界動向と統計、成長予測(2026年~2031年) |
|
出版日: 2026年01月12日
発行: Mordor Intelligence
ページ情報: 英文 120 Pages
納期: 2~3営業日
|

概要
窒素肥料市場の規模は、2026年には1,845億8,000万米ドルと推定されており、2025年の1,744億米ドルから成長を続けています。
2031年の予測では2,451億3,000万米ドルに達し、2026年から2031年にかけてCAGR5.84%で成長すると見込まれています。
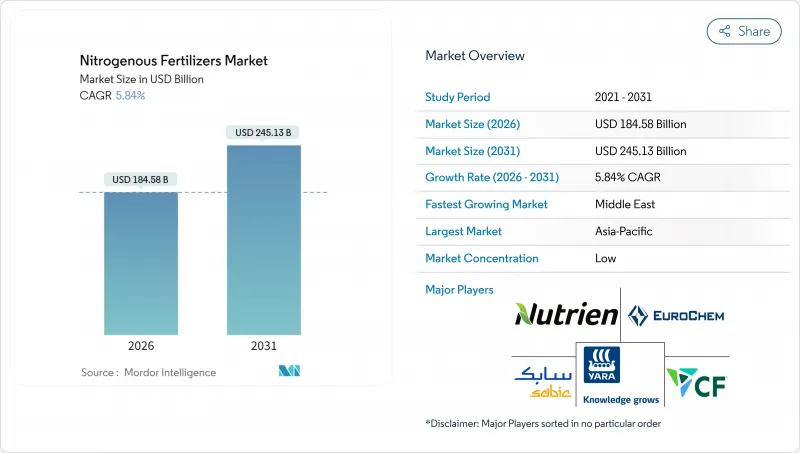
この成長は、世界の食糧需要の増加、農業技術の進歩、および栄養管理の革新に起因しています。補助金や政策措置を通じた政府の支援は、依然として重要な要素です。例えば欧州委員会は、サプライチェーンの混乱の中で肥料の入手可能性、手頃な価格、持続可能性を確保するため、2024年末まで尿素とアンモニアの関税を停止しています。地域別では、アジア太平洋地域が広範な農業活動、強力な政府支援、精密農業技術の普及拡大により市場を牽引しています。競合情勢には世界の企業と地域企業が共存し、世界の企業は生産能力拡大、原料多様化、低炭素技術の導入に注力しています。一方、地域メーカーや専門サプライヤーは、地域密着型の流通網、カスタマイズされた製品提供、農業技術プラットフォームとの連携を通じて市場シェアを拡大しています。窒素系肥料市場は、技術主導型かつ地域適応型の産業へと進化しており、バリューチェーン全体で革新と戦略的成長の大きな機会を提供しています。
世界の窒素肥料市場の動向と洞察
主食作物の需要増加
世界人口の増加に伴い食糧需要が急増し、限られた農地からより高い収量を確保する農業システムへの圧力が高まっています。2050年までに世界人口が97億人に達すると予測される中、増加する栄養需要を満たすためには食糧生産量を約70%増加させる必要があります。この需要急増は農業慣行を再構築し、気候変動の中でも作物生産量を向上させ収量を安定させるため、窒素肥料のより一層の活用を促進しています。特に発展途上地域における所得の増加に伴い、食習慣がタンパク質豊富な穀物へと移行しつつあります。これにより、より高い窒素肥料施用量を必要とする小麦や米などの作物の栽培が強化されています。気候変動の激化は安定した収穫量の必要性をさらに強調し、生産量を安定させるための肥料の戦略的利用を促進しています。多くの地域では、トウモロコシ、大豆、米を1年以内に輪作する多作システムが導入され、1ヘクタール当たりの肥料使用量が増加しています。この動向は、耕作地の拡大よりも既存農地での生産性最大化に焦点が当てられていることを反映しています。
農業投入物に対する持続的な政府支援
世界各国の政府は、農村部の安定と食料安全保障における手頃な価格の植物栄養素の重要性を認識しています。多くの国では、農家が肥料を確実に調達できるよう、直接的な投入資材補助金、運賃還付、低金利融資などの支援プログラムを拡充しています。インドは2024-25年度予算において肥料補助金を1兆7,500億ルピー(約210億米ドル)に増額し、財政制約下でも農家の継続的な調達を確保しています。ブラジルでは「Plano Safra 2024-25」計画において、肥料調達支援のため4,000億レアル(750億米ドル)の融資枠を設定しました。こうした取り組みは民間セクターに対し強い需要を示唆し、生産能力・流通インフラ・技術革新への投資を促進しています。輸入依存度の低減とサプライチェーン強化を目的として、国内アンモニア生産を推進する政府も存在します。この政策転換は、価格統制を超えた肥料供給の長期的なレジリエンス構築を目指しています。
環境規制の強化
栄養分の流出や温室効果ガス排出削減を目的とした環境政策が、世界の肥料使用形態を変容させています。生態系や水源保護のため、施用時期・施用量・製品組成に関する規制強化が各国で進められています。米国などの地域では硝酸塩の上限規制や持続可能性基準が普及しつつあり、農家は精密農業手法や高効率肥料の導入を迫られています。こうした変化が製品開発と施用技術の革新を促進し、肥料利用と環境目標の調和を図っています。規制が強化されるにつれ、窒素系肥料市場は、農学的性能を維持しつつ環境負荷を低減する先進製品の採用をますます反映していくでしょう。この移行は、生産性と環境保全のバランスを取るという、業界にとって重要な転換点を示しています。
セグメント分析
2025年時点で尿素は窒素系肥料市場シェアの43.12%を占め、その46%の窒素濃度と柔軟な施用方法が生産者に評価され、2031年までCAGR6.78%で推移すると予測されています。尿素のコスト優位性と、土壌混和・施肥灌漑双方への適応性が、大規模穀物生産システムにおける地位を支えています。生産者は省エネ触媒や排出ガス制御装置によるプラントのアップグレードを進め、競争力あるコストでの供給安定性を強化しています。CFインダストリーズのドナルドソンビル拡張計画など継続的な投資は、地域の自給率と輸出能力を高め、窒素肥料市場における尿素の主導的地位を維持しています。
特殊グレードは灌漑園芸や高付加価値換金作物で普及が進んでおり、精密な栄養供給が収益向上につながっています。硝酸アンモニウムは規制や貯蔵インフラが整備された地域で依然として重要であり、無水アンモニアは北米の畑作作物における直接注入システムに活用されています。環境規制の強化に伴い、低揮発性製品や被覆製品の需要は増加が見込まれ、多様性を加えつつも尿素の中核的役割は揺るぎません。
2025年時点で、従来型肥料は窒素系肥料市場規模の92.12%のシェアを維持し、予測期間中は5.86%のCAGRで拡大が見込まれます。これは世界の作付面積の増加と価格感応度の高さがバルク粒状製品を支持する傾向と概ね一致し、全体的な需要動向に沿ったものです。大規模な集中型プラントは規模の経済の恩恵を受け、単位コストを低く抑え、発展途上市場における競争力を確保しています。広範な販売代理店ネットワークと農家の慣れ親しんだ使用感も、広大な耕作地における従来型肥料の優位性を強化しています。
特殊肥料はより小規模なセグメントであり、養分利用効率を高め環境損失を最小化する徐放性・遅効性技術が主導しています。肥料灌漑や水耕栽培システムで使用される液体溶液は、水資源制約地域における適用柔軟性を拡大します。水溶性グレードは、精密な栄養管理を求める温室栽培向けに設計されています。高価格帯ではありますが、特に保護栽培や集約的な果樹・野菜生産において、初期コストを上回る収益が見込める分野では特殊形態の採用が進み、窒素肥料市場に漸増的な成長をもたらすことが期待されます。
窒素肥料市場レポートは、製品別(硝酸アンモニウム、無水アンモニア、その他)、形態別(従来型、特殊品)、施用方法(フェルティゲーション、葉面散布、土壌施用)、作物タイプ(畑作物、園芸作物、その他)、地域(アジア太平洋、欧州、中東・アフリカ、北米、南米)で分析されています。市場予測は金額(米ドル)と数量(メトリックトン)で提示されています。
地域別分析
アジア太平洋地域は、2025年の窒素肥料市場規模において35.42%の収益を占めており、広大な農地、高い作付密度、支援的な補助金制度を反映しています。中国の食糧安全保障への重点とインドの小規模農家における近代化は、堅調な基盤需要を保証しています。多作システムや高収量ハイブリッド品種の採用拡大に伴い、持続的な窒素投入が必要とされています。また、多くの地域プレイヤーにおいて国内生産能力が輸入依存度を抑制しています。新興東南アジア諸国では、拡大する都市部の需要に対応するため、パーム油・米・野菜栽培が強化され、漸進的な成長を遂げています。
中東地域は、豊富なガス原料とアジア・アフリカを結ぶ海運路への近接性を活かし、2031年までCAGR6.94%という最速の成長が見込まれます。ADNOC、SABIC、Fertiglobeによる青色・緑色アンモニアプラントへの大規模投資は、国内農業プロジェクトと輸出市場の両方への供給を目的としています。政府政策は輸入依存度低減のための農業多角化を推進し、窒素肥料の国内消費を促進しています。新規プラントへの炭素回収ソリューションの統合により、同地域は低排出供給者として位置づけられ、競争優位性を強化しています。
北米と欧州は成熟しつつも進化を続ける市場を維持しています。北米の生産者は輸出競争力を支えるシェールガス経済の恩恵を受ける一方、精密農業の導入が数量の漸増的な成長を持続させています。欧州では厳格な環境政策が生産量を抑制する一方、農場から食卓までの目標に沿った高効率製品やデジタルアドバイザリーサービスの需要を喚起しています。南米はブラジルのフロンティア拡大とアルゼンチンの収量回復を背景に成長を続けており、アフリカはインフラ整備、融資アクセス、普及サービスの向上により肥料普及が進み、長期的な潜在力を有しています。
その他の特典:
- エクセル形式の市場予測(ME)シート
- アナリストによる3ヶ月間のサポート
よくあるご質問
目次
第1章 イントロダクション
- 調査の前提条件と市場の定義
- 調査範囲
- 調査手法
第2章 レポート提供
第3章 エグゼクティブサマリーおよび主要な調査結果
第4章 主要な業界動向
- 主要作物類の作付面積
- 畑作作物
- 園芸作物
- 平均施肥量
- 主要栄養素
- 畑作作物
- 園芸作物
- 主要栄養素
- 灌漑設備が整備された農地
- 規制の枠組み
- バリューチェーン及び流通チャネル分析
- 市場促進要因
- 主食作物の需要増加
- 農業投入物に対する政府の持続的な支援
- アンモニア供給源の多様化
- 尿素生産能力の最適化
- グリーンアンモニアパイロットプロジェクトの加速
- 窒素利用のためのデジタルアドバイザリープラットフォームの導入
- 市場抑制要因
- 天然ガス価格の変動性
- 環境規制の強化
- 肥料貿易における物流上のボトルネック
- 生物学的窒素固定技術の代替手段の出現
第5章 市場規模と成長予測(金額と数量)
- 製品
- 硝酸アンモニウム
- 無水アンモニア
- 尿素
- その他
- 形態
- 従来型
- 特殊
- CRF
- 液体肥料
- SRF
- 水溶性
- 施肥方法
- 施肥灌漑
- 葉面散布
- 土壌
- 作物タイプ
- 畑作作物
- 園芸作物
- 芝生・観賞用植物
- 地域
- アジア太平洋地域
- オーストラリア
- バングラデシュ
- 中国
- インド
- インドネシア
- 日本
- パキスタン
- フィリピン
- タイ
- ベトナム
- その他アジア太平洋地域
- 欧州
- フランス
- ドイツ
- イタリア
- オランダ
- ロシア
- スペイン
- ウクライナ
- 英国
- その他欧州地域
- 中東
- トルコ
- サウジアラビア
- その他中東
- アフリカ
- 南アフリカ
- ナイジェリア
- その他アフリカ
- 北米
- カナダ
- メキシコ
- 米国
- その他北米地域
- 南米
- アルゼンチン
- ブラジル
- その他南米
- アジア太平洋地域
第6章 競合情勢
- 主要な戦略的動きs
- 市場シェア分析
- 企業概要
- 企業プロファイル
- Nutrien Ltd.
- Yara International ASA
- CF Industries Holdings, Inc.
- SABIC Agri-Nutrients Company(Saudi Basic Industries Corporation)
- Koch Fertilizer, LLC(Koch Industries, Inc.)
- EuroChem Group AG
- OCI N.V.
- Coromandel International Limited(Murugappa Group)
- Indian Farmers Fertiliser Co-operative Limited
- Grupa Azoty S.A.
- Petronas Chemicals Group Berhad(Petroliam Nasional Berhad)
- Abu Qir Fertilizers and Chemical Industries Company
- PT Pupuk Indonesia(Persero)

