|
|
市場調査レポート
商品コード
1623651
窒素肥料市場の評価:製品タイプ・形態・作物タイプ・適用モード・地域別の機会および予測 (2018-2032年)Nitrogenous Fertilizers Market Assessment, By Product Type, By Form, By Crop Type, By Application Mode, By Region, Opportunities and Forecast, 2018-2032F |
||||||
|
|||||||
カスタマイズ可能
|
|||||||

| 窒素肥料市場の評価:製品タイプ・形態・作物タイプ・適用モード・地域別の機会および予測 (2018-2032年) |
|
出版日: 2024年12月30日
発行: Markets & Data
ページ情報: 英文 223 Pages
納期: 3~5営業日
|

全表示
- 概要
- 図表
- 目次
世界の窒素肥料の市場規模は、2024年の700億7,000万米ドルから、予測期間中は5.69%のCAGRで推移し、2032年には1,090億9,000万米ドルの規模に成長すると予測されています。
世界の窒素肥料市場はここ数年、食糧生産と生産強化の需要の高まりから著しい成長を遂げています。主要な窒素肥料グループは、農家が強く健康で生産的な成長のために必要な窒素を土壌に供給することを可能にします。食糧安全保障の課題に対応するためには農業の生産性向上が必要であり、特に新興諸国における人口の増加によって、このニーズは今後も増大し続けると予測されています。
同市場は、肥料生産における新技術、政府からの補助金、環境への影響を最小限に抑えるという点から肥料の最適利用につながる精密農業の人気など、多くの要因の影響を受けています。加えて、土壌の健全性に関する意識の高まりが、効率的で環境に優しい肥料の使用増加につながっています。一方で、窒素の流出、温室効果ガスの排出、化学肥料の使用が環境上の課題となっており、放出制御肥料や有機窒素肥料の技術革新を促しています。
当レポートでは、世界の窒素肥料の市場を調査し、市場の定義と概要、市場規模の推移・予測、各種区分・地域/主要国別の詳細分析、産業構造、市場成長への影響因子の分析、ケーススタディ、競合情勢、主要企業のプロファイルなどをまとめています。
目次
第1章 プロジェクトの範囲と定義
第2章 調査手法
第3章 エグゼクティブサマリー
第4章 顧客の声
- 人口統計
- 市場認識と製品情報
- ブランド認知度とロイヤルティ
- 購入決定時に検討される要素
- 購入チャネル
- 購入頻度
- 既存または予定ユーザー
第5章 世界の窒素肥料市場の展望
- 市場規模の分析・予測
- 市場シェアの分析・予測
- 製品タイプ別
- 形態別
- 作物タイプ別
- 適用モード別
- 地域別
- 企業シェア分析(上位5社およびその他)
- 市場マップ分析
第6章 北米の窒素肥料市場の展望
- 市場規模の分析・予測
- 市場シェアの分析・予測
- 国別市場評価
- 米国
- カナダ
- メキシコ
第7章 欧州の窒素肥料市場の展望
- ドイツ
- フランス
- イタリア
- 英国
- ロシア
- オランダ
- スペイン
- トルコ
- ポーランド
第8章 アジア太平洋の窒素肥料市場の展望
- インド
- 中国
- 日本
- オーストラリア
- ベトナム
- 韓国
- インドネシア
- フィリピン
第9章 南米の窒素肥料市場の展望
- ブラジル
- アルゼンチン
第10章 中東・アフリカの窒素肥料市場の展望
- サウジアラビア
- UAE
- 南アフリカ
第11章 規制状況
第12章 需給分析
第13章 輸出入分析
第14章 バリューチェーン分析
第15章 ポーターのファイブフォース分析
第16章 PESTLE分析
第17章 マクロ経済指標
第18章 価格分析
第19章 利益率分析
第20章 市場力学
- 市場促進要因
- 市場の課題
第21章 市場の動向・展開
第22章 ケーススタディ
第23章 競合情勢
- 上位5社の競合マトリックス
- 企業エコシステム分析 (スタートアップ vs 中小企業 vs 大企業)
- 上位5社のSWOT分析
- 上位10社の情勢
- Yara International ASA
- EuroChem Group
- Haifa Group
- Coromandel International Limited
- Everris International B.V.
- Nutrien Ltd.
- Plant Food Company, Inc.
- COMPO EXPERT GmbH
- Biota Nutri BV
- CF Industries Holdings, Inc.
第24章 戦略的提言
第25章 当社について・免責事項
List of Tables
- Table 1. Pricing Analysis of Products from Key Players
- Table 2. Competition Matrix of Top 5 Market Leaders
- Table 3. Mergers & Acquisitions/ Joint Ventures (If Applicable)
- Table 4. About Us - Regions and Countries Where We Have Executed Client Projects
List of Figures
- Figure 1. Global Nitrogenous Fertilizers Market, By Value, In USD Billion, 2018-2032F
- Figure 2. Global Nitrogenous Fertilizers Market Share (%), By Product Type, 2018-2032F
- Figure 3. Global Nitrogenous Fertilizers Market Share (%), By Form, 2018-2032F
- Figure 4. Global Nitrogenous Fertilizers Market Share (%), By Crop Type, 2018-2032F
- Figure 5. Global Nitrogenous Fertilizers Market Share (%), By Application Mode, 2018-2032F
- Figure 6. Global Nitrogenous Fertilizers Market Share (%), By Region, 2018-2032F
- Figure 7. North America Nitrogenous Fertilizers Market, By Value, In USD Billion, 2018-2032F
- Figure 8. North America Nitrogenous Fertilizers Market Share (%), By Product Type, 2018-2032F
- Figure 9. North America Nitrogenous Fertilizers Market Share (%), By Form, 2018-2032F
- Figure 10. North America Nitrogenous Fertilizers Market Share (%), By Crop Type, 2018-2032F
- Figure 11. North America Nitrogenous Fertilizers Market Share (%), By Application Mode, 2018-2032F
- Figure 12. North America Nitrogenous Fertilizers Market Share (%), By Country, 2018-2032F
- Figure 13. United States Nitrogenous Fertilizers Market, By Value, In USD Billion, 2018-2032F
- Figure 14. United States Nitrogenous Fertilizers Market Share (%), By Product Type, 2018-2032F
- Figure 15. United States Nitrogenous Fertilizers Market Share (%), By Form, 2018-2032F
- Figure 16. United States Nitrogenous Fertilizers Market Share (%), By Crop Type, 2018-2032F
- Figure 17. United States Nitrogenous Fertilizers Market Share (%), By Application Mode, 2018-2032F
- Figure 18. Canada Nitrogenous Fertilizers Market, By Value, In USD Billion, 2018-2032F
- Figure 19. Canada Nitrogenous Fertilizers Market Share (%), By Product Type, 2018-2032F
- Figure 20. Canada Nitrogenous Fertilizers Market Share (%), By Form, 2018-2032F
- Figure 21. Canada Nitrogenous Fertilizers Market Share (%), By Crop Type, 2018-2032F
- Figure 22. Canada Nitrogenous Fertilizers Market Share (%), By Application Mode, 2018-2032F
- Figure 23. Mexico Nitrogenous Fertilizers Market, By Value, In USD Billion, 2018-2032F
- Figure 24. Mexico Nitrogenous Fertilizers Market Share (%), By Product Type, 2018-2032F
- Figure 25. Mexico Nitrogenous Fertilizers Market Share (%), By Form, 2018-2032F
- Figure 26. Mexico Nitrogenous Fertilizers Market Share (%), By Crop Type, 2018-2032F
- Figure 27. Mexico Nitrogenous Fertilizers Market Share (%), By Application Mode, 2018-2032F
- Figure 28. Europe Nitrogenous Fertilizers Market, By Value, In USD Billion, 2018-2032F
- Figure 29. Europe Nitrogenous Fertilizers Market Share (%), By Product Type, 2018-2032F
- Figure 30. Europe Nitrogenous Fertilizers Market Share (%), By Form, 2018-2032F
- Figure 31. Europe Nitrogenous Fertilizers Market Share (%), By Crop Type, 2018-2032F
- Figure 32. Europe Nitrogenous Fertilizers Market Share (%), By Application Mode, 2018-2032F
- Figure 33. Europe Nitrogenous Fertilizers Market Share (%), By Country, 2018-2032F
- Figure 34. Germany Nitrogenous Fertilizers Market, By Value, In USD Billion, 2018-2032F
- Figure 35. Germany Nitrogenous Fertilizers Market Share (%), By Product Type, 2018-2032F
- Figure 36. Germany Nitrogenous Fertilizers Market Share (%), By Form, 2018-2032F
- Figure 37. Germany Nitrogenous Fertilizers Market Share (%), By Crop Type, 2018-2032F
- Figure 38. Germany Nitrogenous Fertilizers Market Share (%), By Application Mode, 2018-2032F
- Figure 39. France Nitrogenous Fertilizers Market, By Value, In USD Billion, 2018-2032F
- Figure 40. France Nitrogenous Fertilizers Market Share (%), By Product Type, 2018-2032F
- Figure 41. France Nitrogenous Fertilizers Market Share (%), By Form, 2018-2032F
- Figure 42. France Nitrogenous Fertilizers Market Share (%), By Crop Type, 2018-2032F
- Figure 43. France Nitrogenous Fertilizers Market Share (%), By Application Mode, 2018-2032F
- Figure 44. Italy Nitrogenous Fertilizers Market, By Value, In USD Billion, 2018-2032F
- Figure 45. Italy Nitrogenous Fertilizers Market Share (%), By Product Type, 2018-2032F
- Figure 46. Italy Nitrogenous Fertilizers Market Share (%), By Form, 2018-2032F
- Figure 47. Italy Nitrogenous Fertilizers Market Share (%), By Crop Type, 2018-2032F
- Figure 48. Italy Nitrogenous Fertilizers Market Share (%), By Application Mode, 2018-2032F
- Figure 49. United Kingdom Nitrogenous Fertilizers Market, By Value, In USD Billion, 2018-2032F
- Figure 50. United Kingdom Nitrogenous Fertilizers Market Share (%), By Product Type, 2018-2032F
- Figure 51. United Kingdom Nitrogenous Fertilizers Market Share (%), By Form, 2018-2032F
- Figure 52. United Kingdom Nitrogenous Fertilizers Market Share (%), By Crop Type, 2018-2032F
- Figure 53. United Kingdom Nitrogenous Fertilizers Market Share (%), By Application Mode, 2018-2032F
- Figure 54. Russia Nitrogenous Fertilizers Market, By Value, In USD Billion, 2018-2032F
- Figure 55. Russia Nitrogenous Fertilizers Market Share (%), By Product Type, 2018-2032F
- Figure 56. Russia Nitrogenous Fertilizers Market Share (%), By Form, 2018-2032F
- Figure 57. Russia Nitrogenous Fertilizers Market Share (%), By Crop Type, 2018-2032F
- Figure 58. Russia Nitrogenous Fertilizers Market Share (%), By Application Mode, 2018-2032F
- Figure 59. Netherlands Nitrogenous Fertilizers Market, By Value, In USD Billion, 2018-2032F
- Figure 60. Netherlands Nitrogenous Fertilizers Market Share (%), By Product Type, 2018-2032F
- Figure 61. Netherlands Nitrogenous Fertilizers Market Share (%), By Form, 2018-2032F
- Figure 62. Netherlands Nitrogenous Fertilizers Market Share (%), By Crop Type, 2018-2032F
- Figure 63. Netherlands Nitrogenous Fertilizers Market Share (%), By Application Mode, 2018-2032F
- Figure 64. Spain Nitrogenous Fertilizers Market, By Value, In USD Billion, 2018-2032F
- Figure 65. Spain Nitrogenous Fertilizers Market Share (%), By Product Type, 2018-2032F
- Figure 66. Spain Nitrogenous Fertilizers Market Share (%), By Form, 2018-2032F
- Figure 67. Spain Nitrogenous Fertilizers Market Share (%), By Crop Type, 2018-2032F
- Figure 68. Spain Nitrogenous Fertilizers Market Share (%), By Application Mode, 2018-2032F
- Figure 69. Turkey Nitrogenous Fertilizers Market, By Value, In USD Billion, 2018-2032F
- Figure 70. Turkey Nitrogenous Fertilizers Market Share (%), By Product Type, 2018-2032F
- Figure 71. Turkey Nitrogenous Fertilizers Market Share (%), By Form, 2018-2032F
- Figure 72. Turkey Nitrogenous Fertilizers Market Share (%), By Crop Type, 2018-2032F
- Figure 73. Turkey Nitrogenous Fertilizers Market Share (%), By Application Mode, 2018-2032F
- Figure 74. Poland Nitrogenous Fertilizers Market, By Value, In USD Billion, 2018-2032F
- Figure 75. Poland Nitrogenous Fertilizers Market Share (%), By Product Type, 2018-2032F
- Figure 76. Poland Nitrogenous Fertilizers Market Share (%), By Form, 2018-2032F
- Figure 77. Poland Nitrogenous Fertilizers Market Share (%), By Crop Type, 2018-2032F
- Figure 78. Poland Nitrogenous Fertilizers Market Share (%), By Application Mode, 2018-2032F
- Figure 79. South America Nitrogenous Fertilizers Market, By Value, In USD Billion, 2018-2032F
- Figure 80. South America Nitrogenous Fertilizers Market Share (%), By Product Type, 2018-2032F
- Figure 81. South America Nitrogenous Fertilizers Market Share (%), By Form, 2018-2032F
- Figure 82. South America Nitrogenous Fertilizers Market Share (%), By Crop Type, 2018-2032F
- Figure 83. South America Nitrogenous Fertilizers Market Share (%), By Application Mode, 2018-2032F
- Figure 84. South America Nitrogenous Fertilizers Market Share (%), By Country, 2018-2032F
- Figure 85. Brazil Nitrogenous Fertilizers Market, By Value, In USD Billion, 2018-2032F
- Figure 86. Brazil Nitrogenous Fertilizers Market Share (%), By Product Type, 2018-2032F
- Figure 87. Brazil Nitrogenous Fertilizers Market Share (%), By Form, 2018-2032F
- Figure 88. Brazil Nitrogenous Fertilizers Market Share (%), By Crop Type, 2018-2032F
- Figure 89. Brazil Nitrogenous Fertilizers Market Share (%), By Application Mode, 2018-2032F
- Figure 90. Argentina Nitrogenous Fertilizers Market, By Value, In USD Billion, 2018-2032F
- Figure 91. Argentina Nitrogenous Fertilizers Market Share (%), By Product Type, 2018-2032F
- Figure 92. Argentina Nitrogenous Fertilizers Market Share (%), By Form, 2018-2032F
- Figure 93. Argentina Nitrogenous Fertilizers Market Share (%), By Crop Type, 2018-2032F
- Figure 94. Argentina Nitrogenous Fertilizers Market Share (%), By Application Mode, 2018-2032F
- Figure 95. Asia-Pacific Nitrogenous Fertilizers Market, By Value, In USD Billion, 2018-2032F
- Figure 96. Asia-Pacific Nitrogenous Fertilizers Market Share (%), By Product Type, 2018-2032F
- Figure 97. Asia-Pacific Nitrogenous Fertilizers Market Share (%), By Form, 2018-2032F
- Figure 98. Asia-Pacific Nitrogenous Fertilizers Market Share (%), By Crop Type, 2018-2032F
- Figure 99. Asia-Pacific Nitrogenous Fertilizers Market Share (%), By Application Mode, 2018-2032F
- Figure 100. Asia-Pacific Nitrogenous Fertilizers Market Share (%), By Country, 2018-2032F
- Figure 101. India Nitrogenous Fertilizers Market, By Value, In USD Billion, 2018-2032F
- Figure 102. India Nitrogenous Fertilizers Market Share (%), By Product Type, 2018-2032F
- Figure 103. India Nitrogenous Fertilizers Market Share (%), By Form, 2018-2032F
- Figure 104. India Nitrogenous Fertilizers Market Share (%), By Crop Type, 2018-2032F
- Figure 105. India Nitrogenous Fertilizers Market Share (%), By Application Mode, 2018-2032F
- Figure 106. China Nitrogenous Fertilizers Market, By Value, In USD Billion, 2018-2032F
- Figure 107. China Nitrogenous Fertilizers Market Share (%), By Product Type, 2018-2032F
- Figure 108. China Nitrogenous Fertilizers Market Share (%), By Form, 2018-2032F
- Figure 109. China Nitrogenous Fertilizers Market Share (%), By Crop Type, 2018-2032F
- Figure 110. China Nitrogenous Fertilizers Market Share (%), By Application Mode, 2018-2032F
- Figure 111. Japan Nitrogenous Fertilizers Market, By Value, In USD Billion, 2018-2032F
- Figure 112. Japan Nitrogenous Fertilizers Market Share (%), By Product Type, 2018-2032F
- Figure 113. Japan Nitrogenous Fertilizers Market Share (%), By Form, 2018-2032F
- Figure 114. Japan Nitrogenous Fertilizers Market Share (%), By Crop Type, 2018-2032F
- Figure 115. Japan Nitrogenous Fertilizers Market Share (%), By Application Mode, 2018-2032F
- Figure 116. Australia Nitrogenous Fertilizers Market, By Value, In USD Billion, 2018-2032F
- Figure 117. Australia Nitrogenous Fertilizers Market Share (%), By Product Type, 2018-2032F
- Figure 118. Australia Nitrogenous Fertilizers Market Share (%), By Form, 2018-2032F
- Figure 119. Australia Nitrogenous Fertilizers Market Share (%), By Crop Type, 2018-2032F
- Figure 120. Australia Nitrogenous Fertilizers Market Share (%), By Application Mode, 2018-2032F
- Figure 121. Vietnam Nitrogenous Fertilizers Market, By Value, In USD Billion, 2018-2032F
- Figure 122. Vietnam Nitrogenous Fertilizers Market Share (%), By Product Type, 2018-2032F
- Figure 123. Vietnam Nitrogenous Fertilizers Market Share (%), By Form, 2018-2032F
- Figure 124. Vietnam Nitrogenous Fertilizers Market Share (%), By Crop Type, 2018-2032F
- Figure 125. Vietnam Nitrogenous Fertilizers Market Share (%), By Application Mode, 2018-2032F
- Figure 126. South Korea Nitrogenous Fertilizers Market, By Value, In USD Billion, 2018-2032F
- Figure 127. South Korea Nitrogenous Fertilizers Market Share (%), By Product Type, 2018-2032F
- Figure 128. South Korea Nitrogenous Fertilizers Market Share (%), By Form, 2018-2032F
- Figure 129. South Korea Nitrogenous Fertilizers Market Share (%), By Crop Type, 2018-2032F
- Figure 130. South Korea Nitrogenous Fertilizers Market Share (%), By Application Mode, 2018-2032F
- Figure 131. Indonesia Nitrogenous Fertilizers Market, By Value, In USD Billion, 2018-2032F
- Figure 132. Indonesia Nitrogenous Fertilizers Market Share (%), By Product Type, 2018-2032F
- Figure 133. Indonesia Nitrogenous Fertilizers Market Share (%), By Form, 2018-2032F
- Figure 134. Indonesia Nitrogenous Fertilizers Market Share (%), By Crop Type, 2018-2032F
- Figure 135. Indonesia Nitrogenous Fertilizers Market Share (%), By Application Mode, 2018-2032F
- Figure 136. Philippines Nitrogenous Fertilizers Market, By Value, In USD Billion, 2018-2032F
- Figure 137. Philippines Nitrogenous Fertilizers Market Share (%), By Product Type, 2018-2032F
- Figure 138. Philippines Nitrogenous Fertilizers Market Share (%), By Form, 2018-2032F
- Figure 139. Philippines Nitrogenous Fertilizers Market Share (%), By Crop Type, 2018-2032F
- Figure 140. Philippines Nitrogenous Fertilizers Market Share (%), By Application Mode, 2018-2032F
- Figure 141. Middle East & Africa Nitrogenous Fertilizers Market, By Value, In USD Billion, 2018-2032F
- Figure 142. Middle East & Africa Nitrogenous Fertilizers Market Share (%), By Product Type, 2018-2032F
- Figure 143. Middle East & Africa Nitrogenous Fertilizers Market Share (%), By Form, 2018-2032F
- Figure 144. Middle East & Africa Nitrogenous Fertilizers Market Share (%), By Crop Type, 2018-2032F
- Figure 145. Middle East & Africa Nitrogenous Fertilizers Market Share (%), By Application Mode, 2018-2032F
- Figure 146. Middle East & Africa Nitrogenous Fertilizers Market Share (%), By Country, 2018-2032F
- Figure 147. Saudi Arabia Nitrogenous Fertilizers Market, By Value, In USD Billion, 2018-2032F
- Figure 148. Saudi Arabia Nitrogenous Fertilizers Market Share (%), By Product Type, 2018-2032F
- Figure 149. Saudi Arabia Nitrogenous Fertilizers Market Share (%), By Form, 2018-2032F
- Figure 150. Saudi Arabia Nitrogenous Fertilizers Market Share (%), By Crop Type, 2018-2032F
- Figure 151. Saudi Arabia Nitrogenous Fertilizers Market Share (%), By Application Mode, 2018-2032F
- Figure 152. UAE Nitrogenous Fertilizers Market, By Value, In USD Billion, 2018-2032F
- Figure 153. UAE Nitrogenous Fertilizers Market Share (%), By Product Type, 2018-2032F
- Figure 154. UAE Nitrogenous Fertilizers Market Share (%), By Form, 2018-2032F
- Figure 155. UAE Nitrogenous Fertilizers Market Share (%), By Crop Type, 2018-2032F
- Figure 156. UAE Nitrogenous Fertilizers Market Share (%), By Application Mode, 2018-2032F
- Figure 157. South Africa Nitrogenous Fertilizers Market, By Value, In USD Billion, 2018-2032F
- Figure 158. South Africa Nitrogenous Fertilizers Market Share (%), By Product Type, 2018-2032F
- Figure 159. South Africa Nitrogenous Fertilizers Market Share (%), By Form, 2018-2032F
- Figure 160. South Africa Nitrogenous Fertilizers Market Share (%), By Crop Type, 2018-2032F
- Figure 161. South Africa Nitrogenous Fertilizers Market Share (%), By Application Mode, 2018-2032F
- Figure 162. By Product Type Map-Market Size (USD Billion) & Growth Rate (%), 2024
- Figure 163. By Form Map-Market Size (USD Billion) & Growth Rate (%), 2024
- Figure 164. By Crop Type Map-Market Size (USD Billion) & Growth Rate (%), 2024
- Figure 165. By Application Mode Map-Market Size (USD Billion) & Growth Rate (%), 2024
- Figure 166. By Region Map-Market Size (USD Billion) & Growth Rate (%), 2024
Global nitrogenous fertilizers market is projected to witness a CAGR of 5.69% during the forecast period 2025-2032, growing from USD 70.07 billion in 2024 to USD 109.09 billion in 2032. The market has witnessed significant growth in the last few years, resulting from growing food production and production enhancement demands. The major nitrogen fertilizer groups enable the farmers to supply the soil with the required nitrogen for strong, healthy, and productive growth. The need for improved agricultural productivity to meet food security challenges will continue to be augmented by rising global populations, especially in developing countries.
The market is influenced by many factors, such as new technologies in fertilizer production, government subsidies, and the booming precision agriculture trend that will lead to optimal use of fertilizer in terms of minimized environmental impact. In addition, growing awareness regarding soil health leads to a higher use of efficient and eco-friendly fertilizers. However, nitrogen runoff, emission of greenhouse gases, and use of chemical fertilizers are creating a challenge on environmental grounds, inspiring innovations in controlled-release and organic nitrogenous fertilizers.
Despite factors such as changing raw materials prices and official pressures, nitrogenous fertilizers are critical to global agriculture.
In May 2024, as part of expanding its line of crop nutrition products designed to satisfy the changing demands of regional farmers, Yara Ghana Limited introduced YaraVita CropLift Bio, its newest foliar fertilizer, enhanced with essential nutrients like nitrogen, trace elements including zinc, boron, and magnesium, and secondary elements. Developed to maximize fruit quality and increase crop yields, this cutting-edge product gives farmers a flexible option that works with a variety of crops, such as rice, sorghum, millet, maize, fruits, vegetables, and tree crops like cocoa.
Sustainability Trend Catalyzes Market Expansion
The sustainability trend is one of the major drivers of the growth of the nitrogenous fertilizers market, since both consumers and governments are becoming more demanding with respect to green agricultural practices. The pollution of water bodies due to runoff from fertilizer applications, and greenhouse gas emission gets the industry under pressure to adopt more sustainable means. These things have gradually built up towards a transition into precision agriculture, as nitrogen fertilizers are applied more efficiently to achieve greater crop yields but with a minimum impact on the environment. In September 2022, according to the latest report released by the International Fertilizer Association (IFA) in collaboration with Systemiq, greenhouse gas (GHG) emissions can be reduced by 70% by 2050 through the use of mineral nitrogen fertilizer.
In addition, organic fertilizers containing nitrogen from botanical or animal sources have been gaining more popularity as farmers look toward alternative forms as a replacement for the conventional synthetic ones. Also, with governments putting in stricter regulations and incentives for greener practices, the market is further stimulated. Consumers are shifting towards food that is produced sustainably; hence, manufacturers are investing in R&D to find more effective and environmentally friendly fertilizer technologies and solutions. This trend gives a sustainable focus on long-term, responsible growth of the nitrogenous fertilizers market that is in tune with global development goals on food security.
Increased Production Capacity Influences Market Growth
Increased production capacity is vital in the growth of the nitrogenous fertilizers market and in meeting requirements for supplying nutrients to growing agricultural demand. Food requirements are rising continuously globally, especially in developing economies, enhancing the need for more efficient and cost-effective fertilizers. While production increases, companies can increase unit output, thus reducing per-unit production costs to serve the growing numbers of farmers from varying regions.
Larger production facilities have become key in increasing the contribution of advanced technologies and sustainable practices in the efficient use of nitrogen fertilizers and their reduced environmental impacts. Initiatives towards establishing new plants have increased investments for production expansion purposes, mainly in key agricultural regions, such as Asia-Pacific and North America. With better logistics and economies of scale, the access of broader markets to nitrogenous fertilizers is enhanced, thus promoting comprehensive agricultural productivity and also stimulating steady market growth.
In April 2024, Nitricity Inc. scaled up its manufacturing capacity with the beginning of its most recent field test of climate-smart nitrogen fertilizer in collaboration with Olam Food Ingredients, Elemental Excelerator, and the Madera/Chowchilla Resource Conservation District. Nitricity's innovative method for creating climate-smart nitrogen fertilizer combines air, water, and renewable electricity. Compared to conventional fertilizers like anhydrous ammonia or calcium nitrate, Nitricity's liquid calcium nitrate solution emits much fewer greenhouse gases.
Urea Holds the Dominant Market Share
The nitrogenous fertilizers market is mostly monopolized by urea as it is a highly concentrated nitrogen fertilizer that is inexpensive and can be applied in various agricultural applications. This includes horticulture, in addition to being an efficient and effective source of nitrogen for staple crops. Hence, farmers around the world prefer urea because of its rapid plant growth, as well as high yield. The widespread agriculture further supports its use. Moreover, urea is less costly to produce, thus it is accessible to both the large and smallholder farmers.
Moreover, gradual progression in urea production technologies such as controlled-release formulations, has positively contributed to the market growth by offering more eco-friendly options. Urea is expected to continue to dominate the global nitrogenous fertilizers market due to being economical and efficient despite the challenges related to nitrogen runoff and greenhouse gas emissions.
In July 2023, low carbon urea was launched by SABIC Agri-Nutrients Company (SABIC AN) and sent to Ravensdown, an agricultural cooperative in Timaru, New Zealand. The entire weight of the shipment was 2,700 tons of urea. In addition to producing urea with low-carbon ammonia, SABIC AN was the first company to obtain an independent low-carbon ammonia accreditation. TUV Rheinland, an independent testing, inspection, and certification organization, provided the certification.
Asia-Pacific Dominates the Market
Asia-Pacific commands the majority share of the nitrogenous fertilizers market owing to the extensive agricultural practices across the region along with a high demand for fertilizers for food production. The region encompasses best-known agricultural countries like China, India, and Indonesia, whereby increasing pressure on feeding the rising population drives the consumption of fertilizers. China and India rank high globally based on the high usage of nitrogenous fertilizers, especially urea, the widely used nitrogenous fertilizer worldwide. More so, modernization in agriculture, like precision agriculture, is a growing trend in the region and allows a further increase in fertilizer use efficiency.
Furthermore, government subsidies and support promote agricultural development in the region to boost fertilizer usage. The vast expanse of arable land in the region and ever-increasing development and urbanization guarantee market expansion. Sustainability and environment-efficient farming practices will continue to grow as focus areas. Asia-Pacific remains crucial for innovation and growth in the nitrogenous fertilizers sector.
In September 2024, Malaysia's National Farmers' Association (NAFAS) unveiled Peladang 25, their newest nitrogen-based controlled-release liquid fertilizer. It was developed to ensure that the nitrogen content is delivered gradually, providing plants with reliable and effective nourishment during all stages of growth. The fertilizer works well with fungicides and herbicides and is appropriate for crops like pineapple, rice, oil palm, and napier grass.
Future Market Scenario (2025 - 2032F)
The demand for eco-friendly and efficient nitrogen fertilizers will be propelled due to an increasing emphasis placed on sustainable agricultural practices. Controlled release fertilizers and organic fertilizers are expected to gain popularity.
Innovations introduced in fertilizer manufacturing and application technologies such as precision agriculture and fertigation will enhance the efficiency of nitrogen utilization and minimize environmental footprint.
Rising popularity for organic food among consumers will pave the way for organic nitrogen fertilizers, encouraging manufacturers to diversify their products.
Key Players Landscape and Outlook
The nitrogenous fertilizers market is developed by major players in terms of production and innovation, focusing on expanding production capacities, thereby developing technology. These companies usually have broad manufacturing plants, extensive networks for distribution, and significant investments in R&D for improving the efficiency and sustainability of fertilizers. Innovative product lines are being manufactured to stay ahead in the competitive environment. In June 2023, under the Nova brand name, Everris International B.V. introduced a new range of cutting-edge foliar and fertigation products in North America, with the goal of delivering high-quality water-soluble N-P-Ks and micronutrients to the crops. The varieties include Nova FLOW, Nova ELEVATE, Nova PULSE, and Nova FINISH. These products are made to be as soluble as possible and to work well with the majority of crop protectants and herbicides. Their main goal is to deliver the crop nutrients more effectively to the site of action.
The market outlook looks positive with an increasing demand for fertilizers in developed as well as emerging markets. Key players are focusing more on developing environmentally friendly products like slow-release and organic fertilizers as environmental concerns and regulatory requirements grow. Sustainability has become a priority in agriculture, directing innovation towards reducing nitrogen runoff and improving nutrient use efficiency. Changes within the market will be shaped by different technological advancements, partnerships, and increasing emphasis on higher productivity balanced with environmental responsibility and sustainable long-term growth and expansion in the market.
Table of Contents
1. Project Scope and Definitions
2. Research Methodology
3. Executive Summary
4. Voice of Customer
- 4.1. Demographics (Income - Low, Mid and High; Geography; Nationality; etc.)
- 4.2. Market Awareness and Product Information
- 4.3. Brand Awareness and Loyalty
- 4.4. Factors Considered in Purchase Decision
- 4.4.1. Nutrient Composition
- 4.4.2. Crop Compatibility
- 4.4.3. Soil Type
- 4.4.4. Cost Effectiveness
- 4.4.5. Environmental Impact
- 4.4.6. Brand Reputation
- 4.4.7. Ease Of Application
- 4.4.8. Release Mechanism
- 4.4.9. Compatibility with Irrigation Systems
- 4.4.10. Regulatory Compliance
- 4.5. Purchase Channel
- 4.6. Frequency of Purchase
- 4.7. Existing or Intended User
5. Global Nitrogenous Fertilizers Market Outlook, 2018-2032F
- 5.1. Market Size Analysis & Forecast
- 5.1.1. By Value
- 5.2. Market Share Analysis & Forecast
- 5.2.1. By Product Type
- 5.2.1.1. Ammonium Nitrate
- 5.2.1.2. Calcium Ammonium Nitrate
- 5.2.1.3. Ammonium Sulfate
- 5.2.1.4. Urea
- 5.2.1.5. Others
- 5.2.2. By Form
- 5.2.2.1. Solid
- 5.2.2.2. Liquid
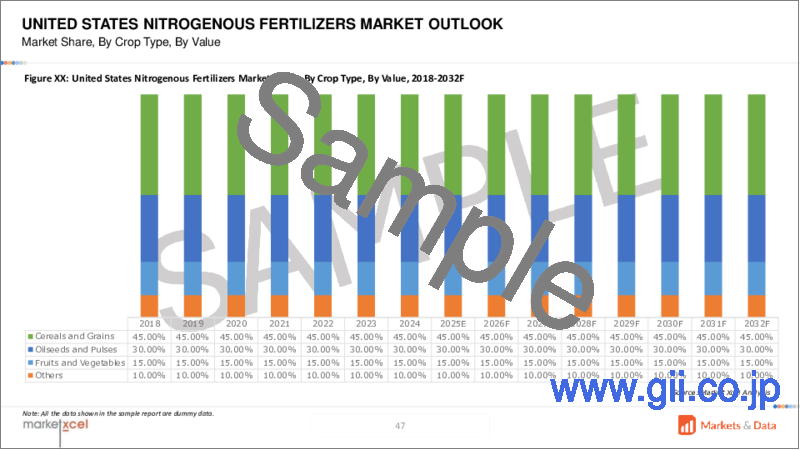
- 5.2.3. By Crop Type
- 5.2.3.1. Cereals and Grains
- 5.2.3.2. Oilseeds and Pulses
- 5.2.3.3. Fruits and Vegetables
- 5.2.3.4. Others
- 5.2.4. By Application Mode
- 5.2.4.1. Foliar
- 5.2.4.2. Fertigation
- 5.2.4.3. Others
- 5.2.5. By Region
- 5.2.5.1. North America
- 5.2.5.2. Europe
- 5.2.5.3. Asia-Pacific
- 5.2.5.4. South America
- 5.2.5.5. Middle East and Africa
- 5.2.6. By Company Market Share Analysis (Top 5 Companies and Others - By Value, 2024)
- 5.2.1. By Product Type
- 5.3. Market Map Analysis, 2024
- 5.3.1. By Product Type
- 5.3.2. By Form
- 5.3.3. By Crop Type
- 5.3.4. By Application Mode
- 5.3.5. By Region
6. North America Nitrogenous Fertilizers Market Outlook, 2018-2032F*
- 6.1. Market Size Analysis & Forecast
- 6.1.1. By Value
- 6.2. Market Share Analysis & Forecast
- 6.2.1. By Product Type
- 6.2.1.1. Ammonium Nitrate
- 6.2.1.2. Calcium Ammonium Nitrate
- 6.2.1.3. Ammonium Sulfate
- 6.2.1.4. Urea
- 6.2.1.5. Others
- 6.2.2. By Form
- 6.2.2.1. Solid
- 6.2.2.2. Liquid
- 6.2.3. By Crop Type
- 6.2.3.1. Cereals and Grains
- 6.2.3.2. Oilseeds and Pulses
- 6.2.3.3. Fruits and Vegetables
- 6.2.3.4. Others
- 6.2.4. By Application Mode
- 6.2.4.1. Foliar
- 6.2.4.2. Fertigation
- 6.2.4.3. Others
- 6.2.5. By Country Share
- 6.2.5.1. United States
- 6.2.5.2. Canada
- 6.2.5.3. Mexico
- 6.2.1. By Product Type
- 6.3. Country Market Assessment
- 6.3.1. United States Nitrogenous Fertilizers Market Outlook, 2018-2032F*
- 6.3.1.1. Market Size Analysis & Forecast
- 6.3.1.1.1. By Value
- 6.3.1.2. Market Share Analysis & Forecast
- 6.3.1.2.1. By Product Type
- 6.3.1.2.1.1. Ammonium Nitrate
- 6.3.1.2.1.2. Calcium Ammonium Nitrate
- 6.3.1.2.1.3. Ammonium Sulfate
- 6.3.1.2.1.4. Urea
- 6.3.1.2.1.5. Others
- 6.3.1.2.2. By Form
- 6.3.1.2.2.1. Solid
- 6.3.1.2.2.2. Liquid
- 6.3.1.2.3. By Crop Type
- 6.3.1.2.3.1. Cereals and Grains
- 6.3.1.2.3.2. Oilseeds and Pulses
- 6.3.1.2.3.3. Fruits and Vegetables
- 6.3.1.2.3.4. Others
- 6.3.1.2.4. By Application Mode
- 6.3.1.2.4.1. Foliar
- 6.3.1.2.4.2. Fertigation
- 6.3.1.2.4.3. Others
- 6.3.1.2.1. By Product Type
- 6.3.1.1. Market Size Analysis & Forecast
- 6.3.2. Canada
- 6.3.3. Mexico
- 6.3.1. United States Nitrogenous Fertilizers Market Outlook, 2018-2032F*
All segments will be provided for all regions and countries covered
7. Europe Nitrogenous Fertilizers Market Outlook, 2018-2032F
- 7.1. Germany
- 7.2. France
- 7.3. Italy
- 7.4. United Kingdom
- 7.5. Russia
- 7.6. Netherlands
- 7.7. Spain
- 7.8. Turkey
- 7.9. Poland
8. Asia-Pacific Nitrogenous Fertilizers Market Outlook, 2018-2032F
- 8.1. India
- 8.2. China
- 8.3. Japan
- 8.4. Australia
- 8.5. Vietnam
- 8.6. South Korea
- 8.7. Indonesia
- 8.8. Philippines
9. South America Nitrogenous Fertilizers Market Outlook, 2018-2032F
- 9.1. Brazil
- 9.2. Argentina
10. Middle East and Africa Nitrogenous Fertilizers Market Outlook, 2018-2032F
- 10.1. Saudi Arabia
- 10.2. UAE
- 10.3. South Africa
11. Regulatory Landscape
12. Demand Supply Analysis
13. Import and Export Analysis
14. Value Chain Analysis
15. Porter's Five Forces Analysis
16. PESTLE Analysis
17. Macro-economic Indicators
18. Pricing Analysis
19. Profit Margin Analysis
20. Market Dynamics
- 20.1. Market Drivers
- 20.2. Market Challenges
21. Market Trends and Developments
22. Case Studies
23. Competitive Landscape
- 23.1. Competition Matrix of Top 5 Market Leaders
- 23.2. Company Ecosystem Analysis (Startup v/s SME v/s Large-scale)
- 23.3. SWOT Analysis for Top 5 Players
- 23.4. Key Players Landscape for Top 10 Market Players
- 23.4.1. Yara International ASA
- 23.4.1.1. Company Details
- 23.4.1.2. Key Management Personnel
- 23.4.1.3. Products and Services
- 23.4.1.4. Financials (As Reported)
- 23.4.1.5. Key Market Focus and Geographical Presence
- 23.4.1.6. Recent Developments/Collaborations/Partnerships/Mergers and Acquisition
- 23.4.2. EuroChem Group
- 23.4.3. Haifa Group
- 23.4.4. Coromandel International Limited
- 23.4.5. Everris International B.V.
- 23.4.6. Nutrien Ltd.
- 23.4.7. Plant Food Company, Inc.
- 23.4.8. COMPO EXPERT GmbH
- 23.4.9. Biota Nutri BV
- 23.4.10. CF Industries Holdings, Inc.
- 23.4.1. Yara International ASA
Companies mentioned above DO NOT hold any order as per market share and can be changed as per information available during research work.
