
|
市場調査レポート
商品コード
1693389
米国のシーラント:市場シェア分析、産業動向・統計、成長予測(2025年~2030年)United States Sealants - Market Share Analysis, Industry Trends & Statistics, Growth Forecasts (2025 - 2030) |
||||||
カスタマイズ可能
適宜更新あり
|
|||||||
| 米国のシーラント:市場シェア分析、産業動向・統計、成長予測(2025年~2030年) |
|
出版日: 2025年03月18日
発行: Mordor Intelligence
ページ情報: 英文 161 Pages
納期: 2~3営業日
|

全表示
- 概要
- 目次
概要
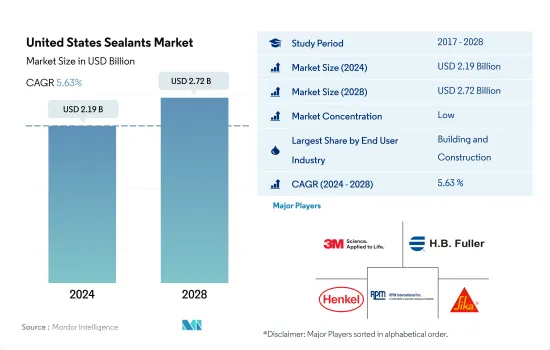
米国のシーラント市場規模は2024年に21億9,000万米ドルと推定され、2028年には27億2,000万米ドルに達すると予測され、予測期間中(2024~2028年)にCAGR 5.63%で成長する見込みです。
米国では家電製品が4.3%の成長を記録し、シーラント需要を押し上げる
- シーラントは、防水、耐候性シーリング、ひび割れシーリング、目地シーリングなど多様な用途があるため、建設業界で広く使用されています。米国の建設業界は、2030年までの建設における世界成長率の11.1%を占めると予想されており、そのため米国のシーラント市場で数量ベースで最も高いシェアを占めています。建設業界はシーラントの主要なエンドユーザーであり、その用途は多岐にわたる。
- シーラントは、ガラス、金属、プラスチック、塗装面など様々な表面に適用できるため、自動車産業で広く使用されており、その特徴は、極端な耐候性、耐久性、長持ちするなど、自動車産業で役立っています。エンジンや自動車のガスケットにも使われています。電気自動車の販売台数は2020年に2.4%増加しました。これは、予測期間中に自動車用シリコーンシーラントの需要を増加させると予想されます。
- さまざまなシーラントは、ポッティングや材料保護のために電子機器や電気機器製造に広く使用されています。これらはセンサーやケーブルなどのシールに使用されます。家庭用電子機器市場は米国で4.3%の成長を記録し、予測期間2022-2028年にシリコーンシーラントの需要を増加させると予想されています。ヘルスケア産業では、医療機器部品の組み立てやシールにシーラントが使用されています。米国市場におけるヘルスケア投資の増加も、予測期間2022-2028年のシーラント需要の増加につながると予測されています。
米国のシーラント市場動向
2022-2026年度に72億5,000万米ドルのアメリカ再建のためのインフラ(INFRA)プログラムなどの政府投資により、国内の建設が増加
- 米国は北米地域で最大の建設国です。同国の一人当たりGDPは2万5,350米ドルで、2022年には前年比3.7%の成長が見込まれています。建設産業は米国GDPの4.2%近くを占めています。米国の建設産業に影響を与える要因は、新規投資、住宅・非住宅建設、政府の政策などです。
- 公共部門の建設支出は2020年の3,612億米ドルに対し、2021年は3,463億米ドルと減少しました。しかし、民間部門の建設支出は2021年に増加し、2020年の1兆1,079億米ドルに対し、2021年には1兆2,454億米ドルとなりました。
- 1月の建築許可による民間住宅を含む住宅建設は、季節調整済み年率189.9万戸でした。これは12月の改定値188.5万戸を0.7%上回り、2021年1月の188.3万戸を0.8%上回りました。
- 米国運輸省(USDOT)は2022年3月、米国再建のためのインフラ(INFRA)プログラムにより、2022~2026年度に72億5,000万米ドルを全州・地域に分配し、国または地域にとって重要な複合一貫輸送貨物・高速道路プロジェクトを建設すると発表しました。こうした要因により、米国では予測期間中に建設活動が活発化すると予想されます。
自動車部品の75%を米国・カナダ・メキシコの3カ国で生産するという政府の協定により、自動車生産が増加します。
- 米国の自動車産業は、米国の対中制裁や、特に米国の自動車産業にとって最大の輸入金属供給源の2つであるカナダとメキシコからの鉄鋼とアルミニウムの輸入に対する関税といった複数の要因により、2019年の年間生産台数が約3.5%減少しました。自動車生産は、COVID-19パンデミックとそれに続く操業停止に起因する労働者の使用不能と相まって、操業とサプライチェーンの制限により、2020年には2019年比で約20%減少しました。パンデミックに続く2021年の半導体チップ不足とその他のサプライチェーン制約が自動車生産の伸びを抑制しています。
- 米国では、商用車の生産比率が2017年の73%から2020年には79%に上昇しました。これは、ピックアップトラックやその他の小型商用車(LCV)の需要が、その多目的な有用性から高まっているためです。このLCV需要の伸びは予測期間中も続くと予想されます。
- 米国は中国、欧州に次ぐ第3位の電気自動車メーカーです。米国の主要組立工場44ヵ所のうち7ヵ所が電気自動車(EV)の生産に携わっており、これは米国の生産能力の約16%に相当します。ゼネラルモーターズが3カ所、テスラが2カ所、リビアンとルーシッド・モーターズが1カ所ずつ所有しています。EVの需要は2020年から2021年にかけて85%増加しており、このように継続的に増加する同国のEV需要は、予測期間中も生産台数の伸びを牽引すると予想されます。米国・カナダ・メキシコ協定の実施により、関税ゼロを利用するためには参加3カ国のいずれかで自動車の75%を生産することが義務付けられるため、予測期間中の自動車生産台数の増加が見込まれます。
米国のシーラント産業の概要
米国のシーラント市場は細分化されており、上位5社で33.35%を占めています。この市場の主要企業は以下の通り。 3M, H.B. Fuller Company, Henkel AG & Co. KGaA, RPM International Inc. and Sika AG(アルファベット順)
その他の特典
- エクセル形式の市場予測(ME)シート
- 3ヶ月のアナリストサポート
目次
第1章 エグゼクティブサマリーと主な調査結果
第2章 レポートのオファー
第3章 イントロダクション
- 調査の前提条件と市場定義
- 調査範囲
- 調査手法
第4章 主要産業動向
- エンドユーザー動向
- 航空宇宙
- 自動車
- 建築・建設
- 規制の枠組み
- 米国
- バリューチェーンと流通チャネル分析
第5章 市場セグメンテーション
- エンドユーザー産業
- 航空宇宙
- 自動車
- 建築・建設
- ヘルスケア
- その他のエンドユーザー産業
- 樹脂
- アクリル
- エポキシ
- ポリウレタン
- シリコーン
- その他の樹脂
第6章 競合情勢
- 主要な戦略動向
- 市場シェア分析
- 企業情勢
- 企業プロファイル
- 3M
- Arkema Group
- Dow
- H.B. Fuller Company
- Henkel AG & Co. KGaA
- Illinois Tool Works Inc.
- MAPEI S.p.A.
- Pecora Corporation
- RPM International Inc.
- Sika AG
第7章 CEOへの主な戦略的質問
第8章 付録
- 世界の接着剤とシーラント産業の概要
- 概要
- ファイブフォース分析フレームワーク(産業魅力度分析)
- 世界のバリューチェーン分析
- 促進要因、阻害要因、機会
- 情報源と参考文献
- 図表一覧
- 主要洞察
- データパック
- 用語集
目次
Product Code: 92445
The United States Sealants Market size is estimated at 2.19 billion USD in 2024, and is expected to reach 2.72 billion USD by 2028, growing at a CAGR of 5.63% during the forecast period (2024-2028).
Consumer electronics register a growth of 4.3% in the United States to boost the demand for sealants
- Sealants are widely used in the construction industry because of their diverse applications, such as waterproofing, weather sealing, cracks sealing, and joint sealing. The US construction industry is expected to account for 11.1% of global growth in construction up to 2030, thus, accounting for the highest share of the US sealants market by volume. The construction industry is the primary end-user industry of sealants owing to the varied applications and high awareness of the usage of sealants in the region.
- Sealants are widely used in the automotive industry because of their applicability to various surfaces such as glass, metal, plastic, painted surfaces, etc., and their features are helpful in the automotive industry, such as for extreme weather resistance, durability, and long-lasting. They are used in engines and car gaskets. Electric vehicle sales increased by 2.4% in 2020 because of its increased demand for personal mobility. This is expected to increase the demand for automotive silicone sealants in the forecast period.
- Different sealants are widely used in electronics and electrical equipment manufacturing for potting and protecting materials. They are used for sealing sensors and cables, etc. The consumer electronics market is expected to register a 4.3% growth in the United States and increase the demand for silicone sealants in the forecast period 2022-2028. Sealants are used in the healthcare industry for assembling and sealing medical device parts. The increase in healthcare investments in the US market is also anticipated to lead to a rise in the demand for sealants over the forecast period 2022-2028.
United States Sealants Market Trends
Government's' investments such as the Infrastructure for Rebuilding America (INFRA) program of USD 7.25 billion for FY 2022-2026 to increase construction in the country
- The United States is the largest country for construction activities in the North American region. The country had a GDP of USD 25,350 per capita, with an expected growth rate of 3.7% Y-o-Y in 2022. The construction industry contributes nearly 4.2% of the US GDP. The factors affecting the US construction industry are new investments, residential & non-residential constructions, government policies, and others.
- Public sector construction spending declined in 2021, recording USD 346.3 billion compared to USD 361.2 billion in 2020. However, the private sector construction spending increased in 2021 and was valued at USD 1,245.4 billion in 2021 compared to USD 1107.9 billion in 2020.
- The residential house construction, including privately-owned housing units authorized by building permits in January, was at a seasonally adjusted annual rate of 1,899,000. This was 0.7% above the revised December rate of 1,885,000 and 0.8% above the January 2021 rate of 1,883,000.
- In March 2022, the US Department of Transportation (USDOT) announced that the Infrastructure for Rebuilding America (INFRA) program would distribute USD 7.25 billion for FY 2022-2026 to all states and regions to build multimodal freight and highway projects of national or regional significance. These factors are expected to boost construction activities in the United States over the forecast period.
Government's United States-Canada-Mexico agreement of having 75% of automobile components produced in these 3 countries will increase the automotive production
- The US automotive industry witnessed a decline in annual production by around 3.5% in 2019 due to multiple factors, such as US sanctions on China and tariffs on steel and aluminum imports, especially from Canada and Mexico, two of the largest sources for imported metals for the US automotive industry. Automotive production fell by around 20% in 2020 compared to 2019 due to operational and supply chain restrictions coupled with worker unavailability resulting from the COVID-19 pandemic and the subsequent lockdowns. The semiconductor chip shortages and other supply chain constraints in 2021, which followed the pandemic, have been holding back automotive production growth.
- In the United States, the percentage of commercial vehicles manufactured increased from 73% in 2017 to 79% in 2020. This was due to the rising demand for pickup trucks and other Light Commercial Vehicles (LCVs) because of their multipurpose utility. This growth in the demand for LCVs is expected to continue in the forecast period.
- The United States is the third largest electric vehicle manufacturer after China and Europe. Seven of the 44 major US assembly plants, representing about 16% of US production capacity, are engaged in producing electric vehicles (EVs). General Motors own three, two are owned by Tesla, and Rivian and Lucid Motors own one site each. Demand for EVs grew 85% from 2020 to 2021, and this continuously increasing demand for EVs in the country is expected to drive production growth during the forecast period as well. The implementation of the United States-Canada-Mexico agreement, which mandates 75% of the cars to be produced in one of the three participating countries to avail zero tariffs, is expected to increase automotive production during the forecast period.
US Sealants Industry Overview
The United States Sealants Market is fragmented, with the top five companies occupying 33.35%. The major players in this market are 3M, H.B. Fuller Company, Henkel AG & Co. KGaA, RPM International Inc. and Sika AG (sorted alphabetically).
Additional Benefits:
- The market estimate (ME) sheet in Excel format
- 3 months of analyst support
TABLE OF CONTENTS
1 EXECUTIVE SUMMARY & KEY FINDINGS
2 REPORT OFFERS
3 INTRODUCTION
- 3.1 Study Assumptions & Market Definition
- 3.2 Scope of the Study
- 3.3 Research Methodology
4 KEY INDUSTRY TRENDS
- 4.1 End User Trends
- 4.1.1 Aerospace
- 4.1.2 Automotive
- 4.1.3 Building and Construction
- 4.2 Regulatory Framework
- 4.2.1 United States
- 4.3 Value Chain & Distribution Channel Analysis
5 MARKET SEGMENTATION (includes market size in Value in USD and Volume, Forecasts up to 2028 and analysis of growth prospects)
- 5.1 End User Industry
- 5.1.1 Aerospace
- 5.1.2 Automotive
- 5.1.3 Building and Construction
- 5.1.4 Healthcare
- 5.1.5 Other End-user Industries
- 5.2 Resin
- 5.2.1 Acrylic
- 5.2.2 Epoxy
- 5.2.3 Polyurethane
- 5.2.4 Silicone
- 5.2.5 Other Resins
6 COMPETITIVE LANDSCAPE
- 6.1 Key Strategic Moves
- 6.2 Market Share Analysis
- 6.3 Company Landscape
- 6.4 Company Profiles (includes Global Level Overview, Market Level Overview, Core Business Segments, Financials, Headcount, Key Information, Market Rank, Market Share, Products and Services, and Analysis of Recent Developments).
- 6.4.1 3M
- 6.4.2 Arkema Group
- 6.4.3 Dow
- 6.4.4 H.B. Fuller Company
- 6.4.5 Henkel AG & Co. KGaA
- 6.4.6 Illinois Tool Works Inc.
- 6.4.7 MAPEI S.p.A.
- 6.4.8 Pecora Corporation
- 6.4.9 RPM International Inc.
- 6.4.10 Sika AG
7 KEY STRATEGIC QUESTIONS FOR ADHESIVES AND SEALANTS CEOS
8 APPENDIX
- 8.1 Global Adhesives and Sealants Industry Overview
- 8.1.1 Overview
- 8.1.2 Porter's Five Forces Framework (Industry Attractiveness Analysis)
- 8.1.3 Global Value Chain Analysis
- 8.1.4 Drivers, Restraints, and Opportunities
- 8.2 Sources & References
- 8.3 List of Tables & Figures
- 8.4 Primary Insights
- 8.5 Data Pack
- 8.6 Glossary of Terms

