
ソーラートラッカー- 市場シェア分析、産業動向・統計、成長予測(2025年~2030年)
Solar Tracker - Market Share Analysis, Industry Trends & Statistics, Growth Forecasts (2025 - 2030)- 発行日
- ページ情報
- 英文 140 Pages
- 納期
- 2~3営業日
- 商品コード
- 1689795
- カスタマイズ可能 お客様のご希望に応じて、既存データの加工や未掲載情報(例:国別セグメント)の追加などの対応が可能です。詳細はお問い合わせください。
- 適宜更新あり 本レポートは最新情報反映のため適宜更新し、内容構成変更を行う場合があります。ご検討の際はお問い合わせください。
- 翻訳ツール提供対象 PDF対応AI翻訳ツールの無料貸し出しサービスのご利用が可能です
概要
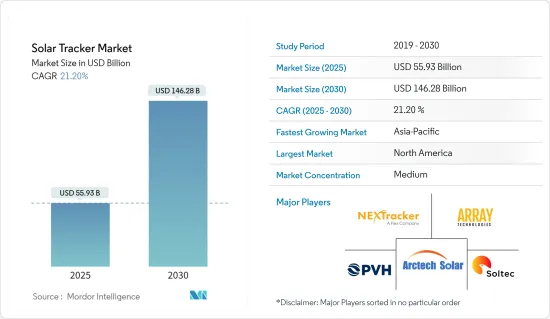
ソーラートラッカー市場規模は2025年に559億3,000万米ドルと推定され、予測期間中(2025~2030年)のCAGRは21.2%で、2030年には1,462億8,000万米ドルに達すると予測されます。
主要ハイライト
- 長期的には、太陽光発電設備の増加が、予測期間中のソーラートラッカー需要を生み出すと予想されます。
- その一方で、追尾システムの設置に必要な初期投資の高さ、設計の複雑さ、メンテナンスコスト、太陽追尾システムの容量制限などが、太陽追尾装置の利用を抑制すると予想されます。
- 政府の支援施策や再生可能エネルギー源を利用した電力需要の増加に対応する取り組みなどの要因により、今後数年間はソーラーパネルやソーラートラッカーの有利な市場が形成されると予想されます。
- 北米はソーラートラッカー市場を独占しており、米国は2023年末までに70%以上のプロジェクトにソーラートラッカーが設置される重要な顧客として浮上しています。
ソーラートラッカー市場動向
世界の太陽光発電設備の増加が市場を独占
- 太陽追尾技術を使用すると、ソーラー捕収剤、リフレクタ、太陽光発電パネルが太陽の方向を向きます。太陽が上空を移動する際、追尾装置はソーラー捕収剤が最大量の日射を受ける位置を維持するようにします。太陽追尾装置の太陽追尾能力は、太陽光発電システムの効率を25~35%向上させることができます。
- 太陽光発電(PV)プロジェクトの設置容量は、政府の有利な施策といくつかの国が設定した野心的な再生可能エネルギー目標に支えられた再生可能エネルギー産業への投資の増加により、過去10年間で大幅に増加しています。IRENA Renewable Energy Capacity Statistics 2024によると、世界の太陽光発電の累積設置容量は2022年の1,066.5GWから2023年には1,412.0GWへと32.39%増加しました。
- 中国、米国、日本、ドイツ、インド、オーストラリアといった国々が世界のPV設置容量の大半を占めており、ソーラートラッカー市場で重要な役割を果たすと予想されます。
- 中国市場は2023年に216GWのPV新設容量で成長し、世界市場の55.26%以上を占めます。産業の予測では、この大幅な加速は今後も続き、2024年には約165GW、2025年には170GWが追加される見込みです。太陽エネルギー産業の開発により、中国の太陽光発電の累積容量は2024年までに700GWを超え、2025年末には900GW近くまで増加すると予想されています。
- 欧州は、太陽光発電産業において著しい発展を遂げています。SolarPower Europeによると、2023年には加盟27カ国全体で約55.9GWの太陽光発電容量が新たに設置され、これは2022年の水準から40%の成長率に相当します。EUの太陽光発電の累積容量は263GWで、2022年の207GWから27%増加しました。ドイツは82GWで引き続き最大の貢献国です。
- さらに、複数の太陽光発電プロジェクトが計画中または建設段階にあります。例えば、2023年9月、ドイツのエネルギープロバイダであるVatenfallは、最適な発電を行うためにソーラートラッカーを使用した79MWのTutzpatzにおける農業用太陽光発電所の開発に言及しました。Vatenfallはまた、Power and Air Condition Solution Management(PASM)と10年間クリーン電力を供給する電力購入契約を結びました。
- 以上のようなことから、世界中で太陽光発電の設置が増加しており、予測期間中に市場を席巻することが予想されます。
市場を独占する北米
- 米国は、世界のソーラートラッカーの主要市場の一つであり、需要の大部分はカリフォルニア、アリゾナ、ネバダ、テキサス、フロリダ、ノースカロライナなどの州からもたらされています。国際再生可能エネルギー機関(IRENA)によると、米国の太陽光発電設備容量は2023年に約139GWとなり、前年から約21%増加しました。
- 米国の太陽光発電市場における単軸追尾式の利用は、過去10年間で着実に拡大しています。2023年末時点で、米国では約22.5GWの実用規模の太陽光発電設備が建設され、その中で太陽追尾システムが大きなシェアを占めています。
- カナダのソーラートラッカー市場は発展段階にあり、需要の大半はアルバータ州、マニトバ州、オンタリオ州、サスカチュワン州などの州からもたらされています。ソーラートラッカー市場は、その効率の向上とコストの低下により、近年勢いを増しています。同国では複数のプロジェクトが稼働しています。
- 2023年7月には、アルバータ州のScotford Project(81MW)とSaddlebtook Project(101MW)の2つの太陽光発電プロジェクトが開始されました。Qセルズとオールインダストリアルコントラクタズが開発するこれらのプロジェクトは、固定チルトトラッカーを使って二面体の太陽電池モジュールから発電します。
- 米国のソーラートラッカー大市場に加え、インディアナ州、バージニア州、ネバダ州などでは、かなり多くの太陽光発電プロジェクトが進行中であり、予測期間中にソーラートラッカーの大きな需要が生まれると予想されます。
- 2024年2月、ソーラートラッカーの製造・供給会社であるソルテックは、バージニア州に設置される約164MWのSF7ソーラートラッカーを供給する契約をBlue Ridge Powerから獲得しました。SF7ソーラートラッカーは、より少ない部品とサポートでプロジェクトを迅速に完了します。この発電所が完成すれば、29万4,000トン以上の排出が抑制され、約1万7,000世帯の電力を賄うことができます。
- 太陽エネルギー産業協会(SEIA)のデータによると、インディアナ州では2026年までに約5GWの太陽光発電容量が設置される見込みで、同州のパイプラインは国内第6位にランクされます。一方、ネバダ州では同期間に4GW以上の設置が見込まれており、同州の太陽光発電パイプラインは第7位となっています。
- このため、今後予定されている太陽光発電追尾システムプロジェクト、政府の支援施策、化石燃料ベースの電力への依存を減らす取り組みなどの要因が、この地域のソーラートラッカー市場を牽引すると予想されます。
ソーラートラッカー産業概要
ソーラートラッカー市場は半固定的です。市場の主要企業(順不同)には、NexTracker Inc.、Array Technologies Inc.、PV Hardware Solutions S.L.U.、Arctech Solar Holding、Soltec Power Holdings SAなどがあります。
その他の特典
- エクセル形式の市場予測(ME)シート
- 3ヶ月間のアナリストサポート
目次
第1章 イントロダクション
- 調査範囲
- 市場の定義
- 調査の前提
第2章 エグゼクティブサマリー
第3章 調査手法
第4章 市場概要
- イントロダクション
- 2029年までの市場規模と需要予測(単位:米ドル)
- 最近の動向と開発
- 政府の規制と施策
- 市場力学
- 促進要因
- 太陽光発電設備の増加
- 抑制要因
- 初期投資の高さ
- 促進要因
- サプライチェーン分析
- ポーターのファイブフォース分析
- 供給企業の交渉力
- 消費者の交渉力
- 新規参入業者の脅威
- 代替品の脅威
- 競争企業間の敵対関係の強さ
第5章 市場セグメンテーション
- 軸タイプ
- 単軸
- 二軸
- 地域
- 北米
- 米国
- メキシコ
- その他の北米地域
- 欧州
- ドイツ
- フランス
- 英国
- イタリア
- スペイン
- ノルディック
- トルコ
- ロシア
- その他の欧州
- アジア太平洋
- 中国
- インド
- 日本
- 韓国
- マレーシア
- タイ
- インドネシア
- ベトナム
- その他のアジア太平洋
- 中東・アフリカ
- サウジアラビア
- アラブ首長国連邦
- 南アフリカ
- カタール
- ナイジェリア
- エジプト
- その他の中東・アフリカ
- 南米
- ブラジル
- コロンビア
- チリ
- その他の南米
- 北米
第6章 競合情勢
- M&A、合弁事業、提携、協定
- 主要企業の戦略
- 企業プロファイル
- Soltec Power Holdings SA
- Arctech Solar Holdings Co Ltd.
- Meca Solar
- Ideematec Deutschland GmbH
- Nextracker Inc.
- Trina Solar
- Valmont Industries Inc.
- PV Hardware Solutions S.L.U.
- Solar Flexrack
- Array Technologies Inc.
- その他の著名な企業一覧(会社名、本社所在地、関連製品およびサービス、連絡先など)
- 市場ランキング分析
第7章 市場機会と今後の動向
- 電力需要の増加
目次
Product Code: 68308
The Solar Tracker Market size is estimated at USD 55.93 billion in 2025, and is expected to reach USD 146.28 billion by 2030, at a CAGR of 21.2% during the forecast period (2025-2030).
Key Highlights
- Over the long term, increasing solar PV installations are expected to create demand for solar trackers in the forecast period.
- On the other hand, the high initial investment required to install a tracking system, design complexity, maintenance cost, and limited capacity of solar tracking systems is expected to restrain the usage of solar trackers.
- Nevertheless, factors such as supportive government policies and efforts to meet the increasing power demand using renewable energy sources are expected to create a favorable market for solar panels and for solar trackers in the coming years.
- North America has dominated the solar trackers market, where the United States emerged as a significant customer with solar trackers installed in more than 70% of projects by the end of 2023.
Solar Tracker Market Trends
Increasing Solar PV Installations Across The Globe to Dominate the Market
- Using solar tracking technology, solar collectors, reflectors, and photovoltaic panels are oriented toward the sun. As the sun moves across the sky, a tracking device ensures that solar collectors maintain a position in which they receive the maximum amount of solar radiation as it moves across the sky. Solar tracker's ability to track the sun can improve PV system efficiency by as much as 25 to 35 percent.
- The installed capacity of solar photovoltaic (PV) projects has been growing significantly over the last decade due to increasing investments in the renewable energy industry supported by favorable government policies and ambitious renewable energy targets set by several countries. According to IRENA Renewable Energy Capacity Statistics 2024, the cumulative global installed solar PV capacity grew by 32.39%, i.e., from 1066.5 GW in 2022 to 1412.0 GW in 2023.
- Countries such as China, the United States, Japan, Germany, India, and Australia account for most of the installed PV capacity globally, which is expected to play a significant role in the solar tracker market.
- The Chinese market grew with 216 GW of newly installed PV capacity in 2023, representing more than 55.26% of the global market. Industry projections estimate that this significant acceleration is set to continue with about 165 GW expected to be added in 2024 and 170 GW in 2025. The developments in the solar energy industry is expected to witness China's cumulative solar PV capacity reach over 700 GW by 2024 and increase to close to 900 GW by the end of 2025.
- The European region has been witnessing significant developments in the solar industry. According to SolarPower Europe, In 2023, nearly 55.9 GW of new solar PV capacity was installed across the 27 Member States, representing a 40% growth rate from 2022 levels. The cumulative EU solar PV fleet amounts to 263 GW, up 27% from the 207 GW in 2022. Germany continues to be the largest contributor with 82 GW.
- Additionally, several solar projects are either in the planning or construction phase. For instance, In September 2023, Germany's energy provider Vattenfall noted the development of an Agri-Photovoltaic power plant in Tutzpatz of 79 MW using solar trackers to optimally generate electricity. Vatenfall has also inked a power purchase agreement with Power and Air Condition Solution Management (PASM) to supply clean electricity for ten years.
- Thus, owing to the above points, the increasing Solar PV installations across the globe are expected to dominate the market in the forecast period.
North America to Dominate the Market
- The United States is one of the major markets for solar trackers worldwide, with a majority of the demand coming from states like California, Arizona, Nevada, Texas, Florida, North Carolina, etc. As per the International Renewable Energy Agency (IRENA), the solar energy installed capacity in the United States of America was about 139 GW in 2023, an increase of about 21% since the previous year.
- The use of single-axis tracking in the United States's utility PV market has grown steadily over the past decade. At the end of 2023, about 22.5 GW of utility-scale solar installations were executed in the United States, where the solar tracker systems had a substantial share in the projects
- Canada's solar tracker market is in its development phase, with the majority of the demand coming from provinces like Alberta, Manitoba, Ontario, and Saskatchewan. The market for solar trackers has been gaining momentum in recent years due to their increased efficiency and declining costs. Multiple projects have been commissioned in the country.
- In July 2023, the country witnessed the commencement of two solar projects, the Scotford Project (81MW) and the Saddlebtook Project (101 MW) in Alberta. The projects, being developed by Qcells and Alltrade Industrial Contractors, would use fixed-tilt trackers to generate electricity from bifacial solar modules.
- In addition to the United States's big markets for solar trackers, states like Indiana, Virginia, and Nevada, among others, have a significantly large number of solar PV projects in the pipeline, which is expected to create significant demand for solar trackers during the forecast period.
- In February 2024, Soltec, the manufacturer and supplier of solar trackers, bagged a contract from Blue Ridge Power to supply about 164 MW of SF7 solar trackers to be located in Virginia. The SF7 solar tracker requires fewer components and supports to complete the project quickly. The power plant, upon completion, is likely to curtail over 294,000 tons of emissions, which could power about 17000 households.
- According to the data from the Solar Energy Industries Association (SEIA), around 5 GW of solar PV capacity is expected to be installed in Indiana by 2026, ranking the state's pipeline as the sixth-largest in the country. On the other hand, SEIA estimates that Nevada will install more than 4 GW over the same period, making the state the seventh-largest in terms of solar PV pipelines.
- Therefore, factors such as upcoming solar PV tracking systems projects, supportive government policies, and efforts to reduce reliance on fossil fuel-based power are expected to drive the solar tracker market in the region.
Solar Tracker Industry Overview
The solar tracker market is semi-consolidated. Some of the major players in the market (in no particular order) include NexTracker Inc., Array Technologies Inc., PV Hardware Solutions S.L.U., Arctech Solar Holding Co. Ltd, and Soltec Power Holdings SA.
Additional Benefits:
- The market estimate (ME) sheet in Excel format
- 3 months of analyst support
TABLE OF CONTENTS
1 INTRODUCTION
- 1.1 Scope of the Study
- 1.2 Market Definiton
- 1.3 Study Assumptions
2 EXECUTIVE SUMMARY
3 RESEARCH METHODOLOGY
4 MARKET OVERVIEW
- 4.1 Introduction
- 4.2 Market Size and Demand Forecast in USD, till 2029
- 4.3 Recent Trends and Developments
- 4.4 Government Policies and Regulations
- 4.5 Market Dynamics
- 4.5.1 Drivers
- 4.5.1.1 Increasing Solar PV Installations
- 4.5.2 Restraints
- 4.5.2.1 High Initial Investment
- 4.5.1 Drivers
- 4.6 Supply Chain Analysis
- 4.7 Porter's Five Forces Analysis
- 4.7.1 Bargaining Power of Suppliers
- 4.7.2 Bargaining Power of Consumers
- 4.7.3 Threat of New Entrants
- 4.7.4 Threat of Substitute Products and Services
- 4.7.5 Intensity of Competitive Rivalry
5 Market Segmentation
- 5.1 Axis Type
- 5.1.1 Single Axis
- 5.1.2 Dual Axis
- 5.2 Geography
- 5.2.1 North America
- 5.2.1.1 United States
- 5.2.1.2 Mexico
- 5.2.1.3 Rest of North America
- 5.2.2 Europe
- 5.2.2.1 Germany
- 5.2.2.2 France
- 5.2.2.3 United Kingdom
- 5.2.2.4 Italy
- 5.2.2.5 Spain
- 5.2.2.6 NORDIC
- 5.2.2.7 Turkey
- 5.2.2.8 Russia
- 5.2.2.9 Rest of Europe
- 5.2.3 Asia-Pacific
- 5.2.3.1 China
- 5.2.3.2 India
- 5.2.3.3 Japan
- 5.2.3.4 South Korea
- 5.2.3.5 Malaysia
- 5.2.3.6 Thailand
- 5.2.3.7 Indonesia
- 5.2.3.8 Vietnam
- 5.2.3.9 Rest of Asia-Pacific
- 5.2.4 Middle-East and Africa
- 5.2.4.1 Saudi Arabia
- 5.2.4.2 United Arab Emirates
- 5.2.4.3 South Africa
- 5.2.4.4 Qatar
- 5.2.4.5 Nigeria
- 5.2.4.6 Egypt
- 5.2.4.7 Rest of Middle East and Africa
- 5.2.5 South America
- 5.2.5.1 Brazil
- 5.2.5.2 Colombia
- 5.2.5.3 Chile
- 5.2.5.4 Rest of South America
- 5.2.1 North America
6 Competitive Landscape
- 6.1 Mergers and Acquisitions, Joint Ventures, Collaborations, and Agreements
- 6.2 Strategies Adopted by Leading Players
- 6.3 Company Profiles
- 6.3.1 Soltec Power Holdings SA
- 6.3.2 Arctech Solar Holdings Co Ltd.
- 6.3.3 Meca Solar
- 6.3.4 Ideematec Deutschland GmbH
- 6.3.5 Nextracker Inc.
- 6.3.6 Trina Solar
- 6.3.7 Valmont Industries Inc.
- 6.3.8 PV Hardware Solutions S.L.U.
- 6.3.9 Solar Flexrack
- 6.3.10 Array Technologies Inc.
- 6.4 List of Other Prominent Companies (Company Name, Headquarter, Relevant Products & Services, Contact Details, etc.)
- 6.5 Market Ranking Analysis
7 Market Opportunities and Future Trends
- 7.1 Increasing Power Demand
ソーラートラッカー- 市場シェア分析、産業動向・統計、成長予測(2025年~2030年)
- 発行日
- 発行
- Mordor Intelligence
- ページ情報
- 英文 140 Pages
- 納期
- 2~3営業日