
|
市場調査レポート
商品コード
1687300
アンカーおよびグラウト:市場シェア分析、産業動向・統計、成長予測(2025年~2030年)Anchors and Grouts - Market Share Analysis, Industry Trends & Statistics, Growth Forecasts (2025 - 2030) |
||||||
カスタマイズ可能
適宜更新あり
|
|||||||
| アンカーおよびグラウト:市場シェア分析、産業動向・統計、成長予測(2025年~2030年) |
|
出版日: 2025年03月18日
発行: Mordor Intelligence
ページ情報: 英文 329 Pages
納期: 2~3営業日
|

全表示
- 概要
- 目次
概要
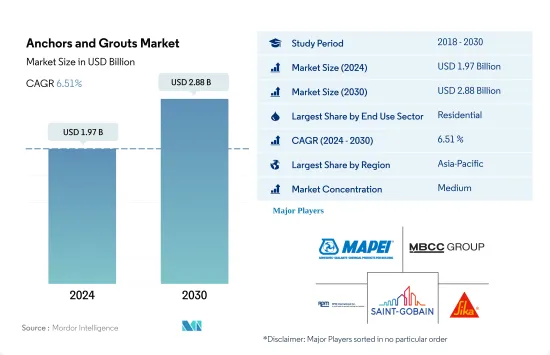
アンカーおよびグラウトの市場規模は2024年に19億7,000万米ドルと推定され、2030年には28億8,000万米ドルに達すると予測され、予測期間中(2024-2030年)のCAGRは6.51%で成長すると予測されます。
アジア太平洋は経済成長と海外直接投資の誘致に注力しており、市場の成長に影響を与えると予想される
- 2022年、世界のアンカーおよびグラウト市場は、主に世界のインフラ支出2%増に牽引され、顕著な5.1%増となりました。これとは対照的に、他のセクターの成長率はわずかかマイナスでした。2023年には商業および住宅セクターの高い成長率が見込まれるため、市場は2022年から5.3%増を記録すると推定されます。
- 各国における市場価値の主要な貢献者として、住宅部門は世界的に支配的な地位を占めています。例えば、2022年にはアジア太平洋が31%、欧州が36%のシェアを占めています。アジア太平洋と一部の欧州諸国では、ハードウッドやラミネートとは対照的に、住宅ではタイル、大理石、石材の床材が好まれており、これが地域別価値の上昇に寄与しています。
- 商業ビルでは、タイルの目地詰め、ひび割れ補修、ボルトやフェンスの支柱の固定など、さまざまな用途でアンカーやグラウトが広く使用されています。多くの高層非住宅ビルにはオフィス、ホテル、小売店などの商業スペースがあることから、この分野のアンカーおよびグラウトの消費量は他を圧倒しています。
- アジア太平洋地域は、アンカーおよびグラウト市場、特に産業・施設セクターで大きな成長が見込まれています。この成長の背景には、経済を強化し海外からの投資を呼び込むために、製造業、教育、ヘルスケア分野の拡大に戦略的に注力していることがあります。その結果、産業・施設セクターが最も急成長し、2023年から2030年までのCAGRは7.18%を記録すると予測されています。
アジア太平洋諸国の大半でアンカーおよびグラウトの需要が急成長、市場成長に影響
- 世界全体では、2022年のアンカーおよびグラウトの消費量は欧州で最も高い伸びを示し、前年比8.19%増となりました。2023年には、北米が2022年比で6.43%近く増加し、世界規模でのアンカーおよびグラウト需要の伸びで欧州を追い抜くと予想されます。
- アンカーおよびグラウト市場はアジア太平洋地域からの需要が最も多く、主に中国が2022年の世界需要の32%を占めました。同地域の市場にとってその他の重要な国は日本とインドで、2022年の同地域の総需要の18%近くを占めています。さらに、日本は予測期間(2023~2030年)にCAGR 8.09%を記録し、同地域で最も高い需要の伸びを記録する見通しです。
- 欧州はアジア太平洋に次いで世界最大のアンカーおよびグラウト市場です。ドイツ、フランス、英国は、この地域で最も重要な市場国です。2022年の欧州の総需要に占めるシェアは40%です。同地域では、住宅と商業の最終用途部門がアンカーおよびグラウトの60%以上を消費しています。イタリアの需要はこの地域で最も急成長し、予測期間中のCAGRは6.18%を記録する見込みです。
- 中国、日本、韓国は、アンカーおよびグラウトの世界の需要において、それぞれ8.09%、7.79%、7.58%と最も高いCAGRで推移すると予想されます。このため、アンカーおよびグラウトの需要はアジア太平洋地域で最も速い速度で成長し、予測期間中にCAGR 7.59%を記録すると予想されます。
世界のアンカーおよびグラウト市場動向
アジア太平洋地域で大規模オフィスビル建設プロジェクトが急増し、世界の商業建築専用床面積が増加へ
- 2022年、世界の商業建築用新設床面積は前年比0.15%の小幅な成長となりました。欧州は12.70%の大幅な伸びで際立っており、これは2030年の二酸化炭素排出目標に合わせてエネルギー効率の高いオフィスビルを推進する動きが原動力となっています。従業員のオフィス復帰に伴い、欧州企業はリース契約を再開し、2022年には450万平方フィートの新規オフィス建設に拍車をかけた。この勢いは2023年も続き、世界の成長率は4.26%と予測されています。
- COVID-19の流行は労働力と資材の不足を引き起こし、商業施設の建設プロジェクトのキャンセルと遅延を招いた。しかし、閉鎖が緩和され、建設活動が再開されるにつれて、2021年の世界の商業施設の新設床面積は11.11%急増し、アジア太平洋が20.98%の成長率でリードしました。
- 今後、世界の商業施設の新設床面積のCAGRは4.56%となります。アジア太平洋地域のCAGRは5.16%と予測され、他地域を凌駕すると予想されます。この成長の原動力となっているのは、中国、インド、韓国、日本における商業施設建設プロジェクトの活発化です。特に、北京、上海、香港、台北といった中国の主要都市では、Aグレードのオフィススペース建設が加速しています。さらに、インドでは2023年から2025年にかけて、上位7都市で約2,325万平方フィートに及ぶ約60のショッピングモールがオープンする予定です。アジア太平洋全域のこうした取り組みを合計すると、2030年までに商業施設の新規床面積は2022年比で15億6,000万平方フィート増加すると予想されます。
世界の住宅セクターを後押しする手頃な価格の住宅計画への政府投資の増加により、南米の住宅建設が最も急成長すると推定されます。
- 2022年、世界の住宅建築の新規床面積は2021年比で約2億8,900万平方フィート減少しました。これは、土地不足、労働力不足、建設資材価格の持続不可能な高騰が原因で発生した住宅危機に起因します。この危機はアジア太平洋に深刻な影響を与え、2022年の新設床面積は2021年比で5.39%減少しました。しかし2023年には、2030年までに30億人を収容できる手頃な価格の住宅を新たに建設するための資金を調達できる政府投資により、世界の新設床面積は2022年比で3.31%増加すると予測され、より明るい見通しが期待されます。
- COVID-19の流行は景気減速を引き起こし、そのため多くの住宅建設プロジェクトが中止または延期され、2020年の世界の新設床面積は2019年に比べて4.79%減少しました。2021年に規制が解除され、住宅プロジェクトに対する鬱積した需要が解放されると、新設床面積は2020年比で11.22%増加し、欧州が18.28%と最も高い伸びを示し、次いで南米が2021年に2020年比で17.36%増加しました。
- 世界の住宅用新設床面積は予測期間中にCAGR 3.81%を記録し、南米が最も速いCAGR 4.05%で発展すると予測されます。ブラジルのMinha Casa Minha Vidaは2023年に発表され、政府は低所得世帯に手頃な価格の住宅を提供するために19億8,000万米ドルの投資を計画しており、チリのFOGAESも2023年に発表され、初期投資額は5,000万米ドルです。
アンカーおよびグラウト産業の概要
アンカーおよびグラウト市場は適度に統合されており、上位5社で54.10%を占めています。この市場の主要企業は以下の通りです。MAPEI S.p.A., MBCC Group, RPM International Inc., Saint-Gobain and Sika AG(アルファベット順).
その他の特典
- エクセル形式の市場予測(ME)シート
- 3ヶ月のアナリストサポート
目次
第1章 エグゼクティブサマリーと主な調査結果
第2章 レポートのオファー
第3章 イントロダクション
- 調査の前提条件と市場定義
- 調査範囲
- 調査手法
第4章 主要産業動向
- 最終用途分野の動向
- 商業
- 産業・施設
- インフラ
- 住宅
- 主要インフラプロジェクト(現在および発表済み)
- 規制の枠組み
- バリューチェーンと流通チャネル分析
第5章 市場セグメンテーション
- 最終用途分野
- 商業
- 産業・施設
- インフラ
- 住宅
- サブ製品
- セメント系固定材
- 樹脂固定
- 技術別
- エポキシグラウト
- ポリウレタン(PU)グラウト
- その他のタイプ
- 地域別
- アジア太平洋
- 国別
- オーストラリア
- 中国
- インド
- インドネシア
- 日本
- マレーシア
- 韓国
- タイ
- ベトナム
- その他アジア太平洋地域
- 欧州
- 国別
- フランス
- ドイツ
- イタリア
- ロシア
- スペイン
- 英国
- その他欧州
- 中東・アフリカ
- 国別
- サウジアラビア
- アラブ首長国連邦
- その他中東とアフリカ
- 北米
- 国別
- カナダ
- メキシコ
- 米国
- 南米
- 国別
- アルゼンチン
- ブラジル
- その他南米
- アジア太平洋
第6章 競合情勢
- 主要な戦略動向
- 市場シェア分析
- 企業情勢
- 企業プロファイル
- Ardex Group
- Arkema
- Don Construction Products Ltd.
- Fosroc, Inc.
- LATICRETE International, Inc.
- MAPEI S.p.A.
- MBCC Group
- RPM International Inc.
- Saint-Gobain
- Sika AG
第7章 CEOへの主な戦略的質問
第8章 付録
- 世界概要
- 概要
- ファイブフォース分析フレームワーク(産業魅力度分析)
- 世界のバリューチェーン分析
- 市場力学(DROs)
- 情報源と参考文献
- 図表一覧
- 主要洞察
- データパック
- 用語集
目次
Product Code: 60918
The Anchors and Grouts Market size is estimated at 1.97 billion USD in 2024, and is expected to reach 2.88 billion USD by 2030, growing at a CAGR of 6.51% during the forecast period (2024-2030).
The Asia-Pacific is focusing on economic growth and attracting foreign direct investments, which is expected to influence the market's growth
- In 2022, the global anchors and grouts market saw a notable 5.1% surge in value, primarily driven by a 2% uptick in global infrastructure spending. In contrast, other sectors witnessed either marginal or negative growth rates. Due to the high growth rates expected from the commercial and residential sectors in 2023, the market was estimated to register a 5.3% increase from 2022.
- As a major contributor to the market's value across nations, the residential sector holds a dominant position globally. For instance, in 2022, Asia-Pacific and Europe accounted for value shares of 31% and 36%, respectively. The preference for tile, marble, or stone flooring in residential buildings, as opposed to hardwood or laminate, prevalent in Asia-Pacific and certain European nations, contributes to the higher regional values.
- Commercial buildings extensively employ anchors and grouts for various applications, including tile joint filling, crack repairs, and anchoring bolts or fence posts. Given that many high-rise non-residential buildings house commercial spaces like offices, hotels, and retail outlets, the sector's consumption of anchors and grouts surpasses others.
- The Asia-Pacific region is poised for significant growth in the anchors and grouts market, particularly in the industrial & institutional sector. The growth can be attributed to a strategic focus on expanding manufacturing, education, and healthcare sectors to bolster the economy and attract foreign investments. As a result, the industrial & institutional sector is projected to witness the fastest growth, recording a CAGR of 7.18% from 2023 to 2030.
Fast-paced growth in the demand for anchors and grouts in most Asia-Pacific countries to influence the market's growth
- Globally, the consumption of anchors and grouts in 2022 witnessed the highest growth in Europe, increasing by 8.19% compared to the previous year. In 2023, North America was expected to overtake Europe in terms of growth in demand for anchors and grouts at a global scale by nearly 6.43% compared to 2022.
- The anchors and grouts market witnessed the most demand from the Asia-Pacific, primarily owing to China, which accounted for 32% of the global demand in 2022. Other significant countries for the market in the region are Japan and India, collectively accounting for nearly 18% of the total demand in the region in 2022. Furthermore, Japan is poised to witness the highest growth in demand in the region, recording a CAGR of 8.09% during the forecast period (2023-2030).
- Europe is the largest market globally after the Asia-Pacific for anchors and grouts. Germany, France, and the United Kingdom are the most significant countries in the region for the market. Together, they held a share of 40% in terms of the total demand in Europe in 2022. The residential and commercial end-use sectors consume more than 60% of the anchors and grouts in the region. The demand in Italy is poised to grow the fastest in the region, recording a CAGR of 6.18% during the forecast period.
- China, Japan, and South Korea are expected to record the highest CAGRs of 8.09%, 7.79%, and 7.58%, respectively, in terms of the demand for anchors and grouts globally. Owing to this, the demand for anchors and grouts is expected to grow at the fastest rate in Asia-Pacific, recording a CAGR of 7.59% during the forecast period.
Global Anchors and Grouts Market Trends
Asia-Pacific's surge in large-scale office building projects is set to elevate the global floor area dedicated to commercial construction
- In 2022, the global new floor area for commercial construction witnessed a modest growth of 0.15% from the previous year. Europe stood out with a significant surge of 12.70%, driven by a push for high-energy-efficient office buildings to align with its 2030 carbon emission targets. As employees returned to offices, European companies, resuming lease decisions, spurred the construction of 4.5 million square feet of new office space in 2022. This momentum is poised to persist in 2023, with a projected global growth rate of 4.26%.
- The COVID-19 pandemic caused labor and material shortages, leading to cancellations and delays in commercial construction projects. However, as lockdowns eased and construction activities resumed, the global new floor area for commercial construction surged by 11.11% in 2021, with Asia-Pacific taking the lead with a growth rate of 20.98%.
- Looking ahead, the global new floor area for commercial construction is set to achieve a CAGR of 4.56%. Asia-Pacific is anticipated to outpace other regions, with a projected CAGR of 5.16%. This growth is fueled by a flurry of commercial construction projects in China, India, South Korea, and Japan. Notably, major Chinese cities like Beijing, Shanghai, Hong Kong, and Taipei are gearing up for an uptick in Grade A office space construction. Additionally, India is set to witness the opening of approximately 60 shopping malls, spanning 23.25 million square feet, in its top seven cities between 2023 and 2025. Collectively, these endeavors across Asia-Pacific are expected to add a staggering 1.56 billion square feet to the new floor area for commercial construction by 2030, compared to 2022.
South America's estimated fastest growth in residential constructions due to increasing government investments in schemes for affordable housing to boost the global residential sector
- In 2022, the global new floor area for residential construction declined by around 289 million square feet compared to 2021. This can be attributed to the housing crisis generated due to the shortage of land, labor, and unsustainably high construction materials prices. This crisis severely impacted Asia-Pacific, where the new floor area declined 5.39% in 2022 compared to 2021. However, a more positive outlook is expected in 2023 as the global new floor area is predicted to grow by 3.31% compared to 2022, owing to government investments that can finance the construction of new affordable homes capable of accommodating 3 billion people by 2030.
- The COVID-19 pandemic caused an economic slowdown, due to which many residential construction projects got canceled or delayed, and the global new floor area declined by 4.79% in 2020 compared to 2019. As the restrictions were lifted in 2021 and pent-up demand for housing projects was released, new floor area grew 11.22% compared to 2020, with Europe having the highest growth of 18.28%, followed by South America, which rose 17.36% in 2021 compared to 2020.
- The global new floor area for residential construction is expected to register a CAGR of 3.81% during the forecast period, with South America predicted to develop at the fastest CAGR of 4.05%. Schemes and initiatives like the Minha Casa Minha Vida in Brazil announced in 2023 with a few regulatory changes, for which the government plans an investment of USD 1.98 billion to provide affordable housing units for low-income families, and the FOGAES in Chile also publicized in 2023, with an initial investment of USD 50 million, are aimed at providing mortgage loans to families for affordable housing and will encourage the construction of new residential units.
Anchors and Grouts Industry Overview
The Anchors and Grouts Market is moderately consolidated, with the top five companies occupying 54.10%. The major players in this market are MAPEI S.p.A., MBCC Group, RPM International Inc., Saint-Gobain and Sika AG (sorted alphabetically).
Additional Benefits:
- The market estimate (ME) sheet in Excel format
- 3 months of analyst support
TABLE OF CONTENTS
1 EXECUTIVE SUMMARY & KEY FINDINGS
2 REPORT OFFERS
3 INTRODUCTION
- 3.1 Study Assumptions & Market Definition
- 3.2 Scope of the Study
- 3.3 Research Methodology
4 KEY INDUSTRY TRENDS
- 4.1 End Use Sector Trends
- 4.1.1 Commercial
- 4.1.2 Industrial and Institutional
- 4.1.3 Infrastructure
- 4.1.4 Residential
- 4.2 Major Infrastructure Projects (current And Announced)
- 4.3 Regulatory Framework
- 4.4 Value Chain & Distribution Channel Analysis
5 MARKET SEGMENTATION (includes market size, forecasts up to 2030 and analysis of growth prospects.)
- 5.1 End Use Sector
- 5.1.1 Commercial
- 5.1.2 Industrial and Institutional
- 5.1.3 Infrastructure
- 5.1.4 Residential
- 5.2 Sub Product
- 5.2.1 Cementitious Fixing
- 5.2.2 Resin Fixing
- 5.2.2.1 By Technology
- 5.2.2.1.1 Epoxy Grout
- 5.2.2.1.2 Polyurethane (PU) Grout
- 5.2.3 Other Types
- 5.3 Region
- 5.3.1 Asia-Pacific
- 5.3.1.1 By Country
- 5.3.1.1.1 Australia
- 5.3.1.1.2 China
- 5.3.1.1.3 India
- 5.3.1.1.4 Indonesia
- 5.3.1.1.5 Japan
- 5.3.1.1.6 Malaysia
- 5.3.1.1.7 South Korea
- 5.3.1.1.8 Thailand
- 5.3.1.1.9 Vietnam
- 5.3.1.1.10 Rest of Asia-Pacific
- 5.3.2 Europe
- 5.3.2.1 By Country
- 5.3.2.1.1 France
- 5.3.2.1.2 Germany
- 5.3.2.1.3 Italy
- 5.3.2.1.4 Russia
- 5.3.2.1.5 Spain
- 5.3.2.1.6 United Kingdom
- 5.3.2.1.7 Rest of Europe
- 5.3.3 Middle East and Africa
- 5.3.3.1 By Country
- 5.3.3.1.1 Saudi Arabia
- 5.3.3.1.2 United Arab Emirates
- 5.3.3.1.3 Rest of Middle East and Africa
- 5.3.4 North America
- 5.3.4.1 By Country
- 5.3.4.1.1 Canada
- 5.3.4.1.2 Mexico
- 5.3.4.1.3 United States
- 5.3.5 South America
- 5.3.5.1 By Country
- 5.3.5.1.1 Argentina
- 5.3.5.1.2 Brazil
- 5.3.5.1.3 Rest of South America
- 5.3.1 Asia-Pacific
6 COMPETITIVE LANDSCAPE
- 6.1 Key Strategic Moves
- 6.2 Market Share Analysis
- 6.3 Company Landscape
- 6.4 Company Profiles
- 6.4.1 Ardex Group
- 6.4.2 Arkema
- 6.4.3 Don Construction Products Ltd.
- 6.4.4 Fosroc, Inc.
- 6.4.5 LATICRETE International, Inc.
- 6.4.6 MAPEI S.p.A.
- 6.4.7 MBCC Group
- 6.4.8 RPM International Inc.
- 6.4.9 Saint-Gobain
- 6.4.10 Sika AG
7 KEY STRATEGIC QUESTIONS FOR CONCRETE, MORTARS AND CONSTRUCTION CHEMICALS CEOS
8 APPENDIX
- 8.1 Global Overview
- 8.1.1 Overview
- 8.1.2 Porter's Five Forces Framework (Industry Attractiveness Analysis)
- 8.1.3 Global Value Chain Analysis
- 8.1.4 Market Dynamics (DROs)
- 8.2 Sources & References
- 8.3 List of Tables & Figures
- 8.4 Primary Insights
- 8.5 Data Pack
- 8.6 Glossary of Terms

