
飼料用バインダー:市場シェア分析、産業動向・統計、成長予測(2025年~2030年)
Feed Binders - Market Share Analysis, Industry Trends & Statistics, Growth Forecasts (2025 - 2030)- 発行日
- ページ情報
- 英文 367 Pages
- 納期
- 2~3営業日
- 商品コード
- 1687197
- カスタマイズ可能 お客様のご希望に応じて、既存データの加工や未掲載情報(例:国別セグメント)の追加などの対応が可能です。詳細はお問い合わせください。
- 適宜更新あり 本レポートは最新情報反映のため適宜更新し、内容構成変更を行う場合があります。ご検討の際はお問い合わせください。
- 翻訳ツール提供対象 PDF対応AI翻訳ツールの無料貸し出しサービスのご利用が可能です
概要
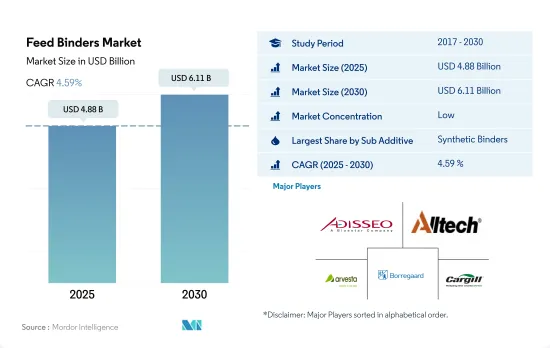
飼料用バインダーの市場規模は2025年に48億8,000万米ドルと予測され、2030年には61億1,000万米ドルに達すると予測され、予測期間中(2025~2030年)のCAGRは4.59%で成長する見込みです。
- 2022年の世界の飼料添加物市場は、バインダーが13%と大きなシェアを占めています。バインダーは、飼料添加物の効率を高めるために配合飼料に使用されます。バインダーは飼料添加物の種類の中で2番目に大きく、ほとんどすべての配合飼料に広く使用されているため、畜産農家にとって必須の要件となっています。
- 飼料用バインダーの種類の中では、合成バインダーが世界最大の市場シェアを占めており、2022年には26億米ドルになると推定されています。合成バインダーは、飼料をペレット化し、動物の消化と栄養摂取を改善し、それによって病気を予防するのに役立つため、好まれています。
- しかし、天然バインダー分野は、価格が安く、高品質のペレットを生産できることから、予測期間中に4.8%という高い成長率を記録すると予想されています。
- 2022年、アジア太平洋は飼料用バインダー市場に関して世界最大の地域であり、30.6%の市場シェアを占めました。この地域の高いシェアは、飼料生産量が多いことによるもので、生産された商業飼料に正比例し、2022年にはほぼ50万トンと推定されます。
- 米国やカナダのように飼料生産量と添加物使用量が多い国は、バインダーの需要が高いです。そのため、北米は飼料用バインダー市場の成長が速く、予測期間中のCAGRは4.9%と予測されています。
- 飼料用バインダー市場は、商業用動物生産の増加と、動物の健康と生産性を向上させるための添加物の使用によって、大きな成長を記録すると予測されます。予測期間中のCAGRは4.6%と予測されます。
- 世界の飼料用バインダー市場は、商業的畜産において飼料用バインダーが果たす重要な役割により、著しい成長率を示しています。飼料添加物を配合飼料に結合させ、その効率を高めるために使用されるバインダーは、2022年に世界の飼料添加物市場の13%を占め、飼料添加物の種類としては2番目に大きいです。バインダーはほとんどすべての配合飼料に使用されるため、すべての畜産農家にとって重要な要素です。
- アジア太平洋地域は、その高い普及率と約5億トンの飼料生産により、2022年の市場規模が13億米ドルとなり、世界の飼料用バインダー市場を独占しました。米国は飼料用バインダー市場に関して世界最大の国に浮上し、市場シェアの19.5%を占め、高度に発達した家畜生産手順により8億米ドルに達しました。次いで中国が13.8%、ブラジルが7.1%のシェアを占めています。
- タイは飼料用バインダー市場で最も急成長している国であり、予測期間中のCAGRは5.6%と予想されます。この成長は、技術と遺伝子の進歩に伴う家畜生産の持続的増加によるものです。2022年には、家禽セグメントが飼料用バインダー市場を独占し、44.5%を占め、次いで豚が35.4%の市場シェアを占めました。
- バインダー使用の費用便益比は畜産業の経費節減につながると推定され、市場の成長に寄与しています。飼料用バインダーの世界市場は、商業畜産の需要増加に牽引され、予測期間中にCAGR 4.6%を記録すると予想されます。飼料用バインダー市場は今後も堅調に推移し、市場関係者には大きな成長機会がもたらされると予想されます。
世界の飼料用バインダー市場動向
動物性タンパク質や卵などの家禽製品への高い需要と家禽部門への投資の増加により、家禽人口が増加しています。
- 家禽の飼育頭数は近年大幅に増加しているが、これは主に日常食における鶏肉と鶏卵の需要が増加しているためです。鶏肉製品へのシフトは、米国における豚肉など他の食肉の価格上昇に牽引されています。例えば欧州の鶏卵消費量は2017年から2021年にかけて4.6%増加し、2021年には6,135トンを占める。
- アジア太平洋は最大の家禽類生産国で、2022年の生産量は2017年比で6.6%増加します。家禽生産量の増加は、アフリカ豚熱の発生により豚肉の供給が減少したことを受け、動物性タンパク質への需要が高まっているためです。中国は世界の生産量の40%を占め、同国には9億羽以上の採卵鶏がおり、最大のレイヤー養鶏センターでは年間6,000万羽のヒナを孵化させることができます。中東も予測期間中(2023~2029年)に鶏肉生産の成長が見込まれます。サウジアラビアのAlmaraiのような企業は養鶏部門に多額の投資を行っており、生産拡大のための新農場設立に11億2,000万米ドルを投じています。
- 家禽製品の需要増と家禽部門への投資増が相まって、飼料生産の成長が強化されると予想されます。この成長は、予測期間中の世界市場における飼料添加物の需要を促進すると予想されます。全体として、鶏肉業界は、鶏肉製品へのシフトと同部門への投資の増加により、今後数年間で大きく成長する構えです。
アジア太平洋と南米における水産物の消費需要の増加と政府の取り組みにより、養殖種用の飼料生産が増加しています。
- 養殖業の拡大により飼料需要が急増しており、これが配合飼料生産の成長を牽引しています。2022年の配合飼料生産量は前年比13.1%増、魚類飼料生産量は2017年から2022年にかけて46.3%増。魚用飼料の消費量の増加は、水産物の需要増に対応するため、水産動物の性能を維持・向上させ、生産性を高める必要があることが背景にあります。
- アジア太平洋地域では魚の消費と生産が盛んであるため、2022年には魚用飼料が世界市場の73.2%を占める。世界市場ではエビやその他の水生種が魚類に続いており、エビは欧州地域や米国の国々が他地域から大量に輸入しています。各国は水産物の需要増に対応するため、養殖生産の拡大に力を入れています。例えば、インドは漁業省への予算配分を2020年の1億1,410万米ドルから2021年には1億6,880万米ドルに増額して生産量を増やしており、予測期間中に飼料需要を押し上げることが予想されます。
- 南米も飼料生産量が増加しており、養殖の拡大により2022年には2017年比46.4%増の510万トンに達します。同地域は主要な水産物消費地域の1つであり、水産物需要の増加が養殖生産の成長を促進しています。増大する需要を満たすために養殖が拡大し続ける中、業界の開発とその拡大への注力が飼料生産の成長を促進すると予想されます。このような水生種向けの飼料生産の増加は、予測期間中の水生セグメントの成長を助けると予想されます。
飼料用バインダー産業の概要
飼料用バインダー市場は細分化されており、上位5社で16.71%を占めています。この市場の主要企業は以下の通りです。 Adisseo, Alltech, Inc., Arvesta(Palital Feed Additives B.V), Borregaard AS and Cargill Inc.(sorted alphabetically).
その他の特典
- エクセル形式の市場予測(ME)シート
- 3ヶ月のアナリストサポート
目次
第1章 エグゼクティブサマリーと主な調査結果
第2章 レポートのオファー
第3章 イントロダクション
- 調査の前提条件と市場定義
- 調査範囲
- 調査手法
第4章 主要産業動向
- 動物頭数
- 家禽
- 反芻動物
- 豚
- 飼料生産
- 水産養殖
- 家禽
- 反芻動物
- 養豚
- 規制の枠組み
- オーストラリア
- ブラジル
- カナダ
- 中国
- フランス
- ドイツ
- インド
- イタリア
- 日本
- メキシコ
- オランダ
- フィリピン
- ロシア
- 南アフリカ
- スペイン
- タイ
- トルコ
- 英国
- 米国
- ベトナム
- バリューチェーンと流通チャネル分析
第5章 市場セグメンテーション
- サブ添加物
- 天然バインダー
- 合成バインダー
- 動物
- 水産養殖
- サブ動物別
- 魚類
- エビ
- その他の養殖種
- 家禽類
- サブ動物別
- ブロイラー
- レイヤー
- その他の鳥類
- 反芻動物
- サブ動物別
- 肉牛
- 乳牛
- その他の反芻動物
- 豚
- その他の動物
- 水産養殖
- 地域
- アフリカ
- 国別
- エジプト
- ケニア
- 南アフリカ
- その他のアフリカ
- アジア太平洋
- 国別
- オーストラリア
- 中国
- インド
- インドネシア
- 日本
- フィリピン
- 韓国
- タイ
- ベトナム
- その他アジア太平洋地域
- 欧州
- 国別
- フランス
- ドイツ
- イタリア
- オランダ
- ロシア
- スペイン
- トルコ
- 英国
- その他欧州
- 中東
- 国別
- イラン
- サウジアラビア
- その他中東
- 北米
- 国別
- カナダ
- メキシコ
- 米国
- その他北米地域
- 南米
- 国別
- アルゼンチン
- ブラジル
- チリ
- その他南米諸国
- アフリカ
第6章 競合情勢
- 主要な戦略的動き
- 市場シェア分析
- 企業情勢
- 企業プロファイル.
- Adisseo
- Alltech, Inc.
- ALLWYN CHEM INDUSTRIES
- Amlan International
- Arvesta(Palital Feed Additives B.V)
- Bentoli
- Borregaard AS
- Cargill Inc.
- Kemin Industries
- Uniscope Inc.
第7章 CEOへの主な戦略的質問
第8章 付録
- 世界概要
- 概要
- ファイブフォース分析フレームワーク
- 世界のバリューチェーン分析
- 世界市場規模とDRO
- 情報源と参考文献
- 図表リスト
- 主要洞察
- データパック
- 用語集
目次
Product Code: 56339
The Feed Binders Market size is estimated at 4.88 billion USD in 2025, and is expected to reach 6.11 billion USD by 2030, growing at a CAGR of 4.59% during the forecast period (2025-2030).
- In 2022, the global feed additives market accounted for a significant share of 13% for binders. Binders are used in compound feed to enhance the efficiency of feed additives. Binders are the second-largest feed additive type and are widely used in almost all feed mixtures, making them an essential requirement for commercial animal farmers.
- Among the types of feed binders, synthetic binders had the largest market share globally, estimated at USD 2.6 billion in 2022. Synthetic binders are preferred as they help in pelleting the feed and improving digestion and nutrition intake in animals, thereby preventing diseases.
- However, the natural binders segment is expected to register a higher growth rate during the forecast period, i.e., 4.8%, due to their lower price and ability to produce quality pellets.
- In 2022, Asia-Pacific was the largest region globally with respect to the feed binders market, accounting for a market share of 30.6%. The region's high share was due to its higher feed production, which was directly proportional to the commercial feed produced, estimated at almost 0.5 million metric tons in 2022.
- Countries like the United States and Canada, with higher feed production and additive usage, had a higher demand for binders. Therefore, North America is projected to grow faster in the feed binders market, with a CAGR of 4.9% during the forecast period.
- The feed binders market is expected to register significant growth, driven by increased commercial animal production and the usage of additives to improve animal health and productivity. The market is projected to register a CAGR of 4.6% during the forecast period.
- The global feed binders market has been growing at a significant rate due to the crucial role feed binders play in commercial animal farming. Binders, which are used to bind feed additives to compound feed and increase their efficiency, accounted for 13% of the global feed additives market in 2022, making them the second-largest feed additive type. Binders are a critical component for every commercial animal farmer, as they are used in almost every feed mixture.
- The Asia-Pacific region dominated the global feed binders market, with a market value of USD 1.3 billion in 2022, owing to its higher penetration rate and production of approximately 0.5 billion metric tons of feed. The United States emerged as the largest country in the world concerning the feed binders market, accounting for 19.5% of the market share and reaching USD 0.8 billion due to its highly developed livestock production procedures. China and Brazil followed with 13.8% and 7.1% of the market share, respectively.
- Thailand is expected to be the fastest-growing country in the feed binders market, with a CAGR of 5.6% during the forecast period. This growth is due to the sustainable increase in livestock production with technological and genetic advancements. In 2022, the poultry segment dominated the feed binders market, accounting for 44.5%, followed by swine, which had a market share of 35.4%.
- The cost-benefit ratio of binder usage is estimated to save money for the livestock industry, contributing to the market's growth. The global feed binders market is expected to register a CAGR of 4.6% during the forecast period, driven by the increasing demand for commercial animal farming. The market for feed binders is expected to remain robust in the coming years, with significant growth opportunities for market players.
Global Feed Binders Market Trends
High demand for animal protein and poultry products such as eggs with increasing investment in poultry sector is increasing poultry population
- The poultry population witnessed a significant increase in recent years, primarily due to the growing demand for chicken meat and eggs in daily diets. The shift toward poultry products has been driven by the increasing prices of other meat, such as pig meat, in the United States. The consumption of eggs in Europe, for instance, increased by 4.6% between 2017 and 2021, accounting for 6,135 metric tons in 2021.
- Asia-Pacific is the largest producer of poultry birds, with production increasing by 6.6% in 2022 compared to 2017. The rise in poultry production is due to the growing demand for animal protein following the outbreak of African swine fever, which has reduced the supply of pork meat. China accounts for 40% of global production, the country has more than 900 million stock-laying hens, and the largest layer poultry farming center can hatch 60 million chicks per year. The Middle East is also expected to witness growth in poultry production during the forecast period (2023-2029). Companies such as Almarai in Saudi Arabia have invested heavily in the poultry sector, with USD 1.12 billion spent on establishing new farms to expand production.
- The increasing demand for poultry products, coupled with rising investments in the poultry sector, is expected to strengthen the growth of feed production. This growth is expected to drive the demand for feed additives in the global market during the forecast period. Overall, the poultry industry is poised for significant growth in the coming years, driven by the shift toward poultry products and increasing investments in the sector.
The growing demand for seafood consumption in Asia-Pacific and South America, and government initiatives is increasing the feed production for aquaculture species
- The demand for feed is rapidly increasing due to the expansion of aquaculture, which is driving the growth of compound feed production. In 2022, compound feed production increased by 13.1% from the previous year, and fish feed production increased by 46.3% between 2017 and 2022. The rise in consumption of fish feed is driven by the need to maintain and improve the performance of aquatic animals and increase productivity to meet the growing demand for seafood.
- Fish feed accounted for 73.2% of the global market in 2022, as fish is highly consumed and produced in the Asia-Pacific region. Shrimp and other aquatic species follow fish in the global market, with shrimp being highly imported by countries in the European region and the United States from other regions. Countries are focusing on expanding aquaculture production to meet the growing demand for seafood. For instance, India increased its budget allocation to the Department of Fisheries from USD 114.1 million in 2020 to USD 168.8 million in 2021 to increase production, which is expected to boost the demand for feed during the forecast period.
- South America is also experiencing an increase in feed production, which rose by 46.4% in 2022 from 2017 to reach 5.1 million metric tons due to the expansion of aquaculture farming. It is one of the major seafood-consuming regions, and the increasing demand for seafood is driving the growth of aquaculture production. As aquaculture continues to expand to meet the growing demand, the development of the industry and a focus on its expansion are expected to fuel the growth of feed production. This increase in feed production for aquatic species is expected to aid in the growth of the aquatic segment during the forecast period.
Feed Binders Industry Overview
The Feed Binders Market is fragmented, with the top five companies occupying 16.71%. The major players in this market are Adisseo, Alltech, Inc., Arvesta (Palital Feed Additives B.V), Borregaard AS and Cargill Inc. (sorted alphabetically).
Additional Benefits:
- The market estimate (ME) sheet in Excel format
- 3 months of analyst support
TABLE OF CONTENTS
1 EXECUTIVE SUMMARY & KEY FINDINGS
2 REPORT OFFERS
3 INTRODUCTION
- 3.1 Study Assumptions & Market Definition
- 3.2 Scope of the Study
- 3.3 Research Methodology
4 KEY INDUSTRY TRENDS
- 4.1 Animal Headcount
- 4.1.1 Poultry
- 4.1.2 Ruminants
- 4.1.3 Swine
- 4.2 Feed Production
- 4.2.1 Aquaculture
- 4.2.2 Poultry
- 4.2.3 Ruminants
- 4.2.4 Swine
- 4.3 Regulatory Framework
- 4.3.1 Australia
- 4.3.2 Brazil
- 4.3.3 Canada
- 4.3.4 China
- 4.3.5 France
- 4.3.6 Germany
- 4.3.7 India
- 4.3.8 Italy
- 4.3.9 Japan
- 4.3.10 Mexico
- 4.3.11 Netherlands
- 4.3.12 Philippines
- 4.3.13 Russia
- 4.3.14 South Africa
- 4.3.15 Spain
- 4.3.16 Thailand
- 4.3.17 Turkey
- 4.3.18 United Kingdom
- 4.3.19 United States
- 4.3.20 Vietnam
- 4.4 Value Chain & Distribution Channel Analysis
5 MARKET SEGMENTATION (includes market size in Value in USD and Volume, Forecasts up to 2030 and analysis of growth prospects)
- 5.1 Sub Additive
- 5.1.1 Natural Binders
- 5.1.2 Synthetic Binders
- 5.2 Animal
- 5.2.1 Aquaculture
- 5.2.1.1 By Sub Animal
- 5.2.1.1.1 Fish
- 5.2.1.1.2 Shrimp
- 5.2.1.1.3 Other Aquaculture Species
- 5.2.2 Poultry
- 5.2.2.1 By Sub Animal
- 5.2.2.1.1 Broiler
- 5.2.2.1.2 Layer
- 5.2.2.1.3 Other Poultry Birds
- 5.2.3 Ruminants
- 5.2.3.1 By Sub Animal
- 5.2.3.1.1 Beef Cattle
- 5.2.3.1.2 Dairy Cattle
- 5.2.3.1.3 Other Ruminants
- 5.2.4 Swine
- 5.2.5 Other Animals
- 5.2.1 Aquaculture
- 5.3 Region
- 5.3.1 Africa
- 5.3.1.1 By Country
- 5.3.1.1.1 Egypt
- 5.3.1.1.2 Kenya
- 5.3.1.1.3 South Africa
- 5.3.1.1.4 Rest of Africa
- 5.3.2 Asia-Pacific
- 5.3.2.1 By Country
- 5.3.2.1.1 Australia
- 5.3.2.1.2 China
- 5.3.2.1.3 India
- 5.3.2.1.4 Indonesia
- 5.3.2.1.5 Japan
- 5.3.2.1.6 Philippines
- 5.3.2.1.7 South Korea
- 5.3.2.1.8 Thailand
- 5.3.2.1.9 Vietnam
- 5.3.2.1.10 Rest of Asia-Pacific
- 5.3.3 Europe
- 5.3.3.1 By Country
- 5.3.3.1.1 France
- 5.3.3.1.2 Germany
- 5.3.3.1.3 Italy
- 5.3.3.1.4 Netherlands
- 5.3.3.1.5 Russia
- 5.3.3.1.6 Spain
- 5.3.3.1.7 Turkey
- 5.3.3.1.8 United Kingdom
- 5.3.3.1.9 Rest of Europe
- 5.3.4 Middle East
- 5.3.4.1 By Country
- 5.3.4.1.1 Iran
- 5.3.4.1.2 Saudi Arabia
- 5.3.4.1.3 Rest of Middle East
- 5.3.5 North America
- 5.3.5.1 By Country
- 5.3.5.1.1 Canada
- 5.3.5.1.2 Mexico
- 5.3.5.1.3 United States
- 5.3.5.1.4 Rest of North America
- 5.3.6 South America
- 5.3.6.1 By Country
- 5.3.6.1.1 Argentina
- 5.3.6.1.2 Brazil
- 5.3.6.1.3 Chile
- 5.3.6.1.4 Rest of South America
- 5.3.1 Africa
6 COMPETITIVE LANDSCAPE
- 6.1 Key Strategic Moves
- 6.2 Market Share Analysis
- 6.3 Company Landscape
- 6.4 Company Profiles (includes Global Level Overview, Market Level Overview, Core Business Segments, Financials, Headcount, Key Information, Market Rank, Market Share, Products and Services, and Analysis of Recent Developments).
- 6.4.1 Adisseo
- 6.4.2 Alltech, Inc.
- 6.4.3 ALLWYN CHEM INDUSTRIES
- 6.4.4 Amlan International
- 6.4.5 Arvesta (Palital Feed Additives B.V)
- 6.4.6 Bentoli
- 6.4.7 Borregaard AS
- 6.4.8 Cargill Inc.
- 6.4.9 Kemin Industries
- 6.4.10 Uniscope Inc.
7 KEY STRATEGIC QUESTIONS FOR FEED ADDITIVE CEOS
8 APPENDIX
- 8.1 Global Overview
- 8.1.1 Overview
- 8.1.2 Porter's Five Forces Framework
- 8.1.3 Global Value Chain Analysis
- 8.1.4 Global Market Size and DROs
- 8.2 Sources & References
- 8.3 List of Tables & Figures
- 8.4 Primary Insights
- 8.5 Data Pack
- 8.6 Glossary of Terms
飼料用バインダー:市場シェア分析、産業動向・統計、成長予測(2025年~2030年)
- 発行日
- 発行
- Mordor Intelligence
- ページ情報
- 英文 367 Pages
- 納期
- 2~3営業日


