
|
市場調査レポート
商品コード
1907316
アジア太平洋地域のペットフード市場:市場シェア分析、業界動向と統計、成長予測(2026年~2031年)Asia-Pacific Pet Food - Market Share Analysis, Industry Trends & Statistics, Growth Forecasts (2026 - 2031) |
||||||
カスタマイズ可能
適宜更新あり
|
|||||||
| アジア太平洋地域のペットフード市場:市場シェア分析、業界動向と統計、成長予測(2026年~2031年) |
|
出版日: 2026年01月12日
発行: Mordor Intelligence
ページ情報: 英文 100 Pages
納期: 2~3営業日
|

概要
アジア太平洋地域のペットフード市場は、2025年の347億8,000万米ドルから2026年には372億3,000万米ドルへ成長し、2026年から2031年にかけてCAGR7.04%で推移し、2031年には523億2,000万米ドルに達すると予測されています。
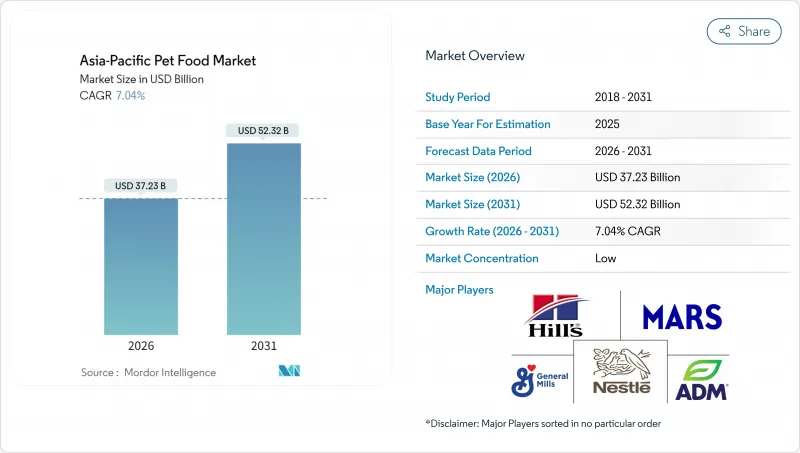
ペット飼育率の上昇、急速な都市化、可処分所得の増加が販売数量の着実な増加を支え、プレミアム化が平均単価を押し上げています。地域全体では、機能性配合、クリーンラベル戦略、代替タンパク質がブランド差別化を促進しています。デジタルコマースが消費者リーチを加速させ、物流投資によるラストマイル配送の信頼性向上に伴い、定期購入モデルが顧客ロイヤルティを深化させています。競争の激しさは依然として分散状態ですが、プライベートエクイティ資本や多国籍企業間の提携が、中国やオーストラリアなどの主要市場における新たな統合の波を示唆しています。
アジア太平洋地域のペットフード市場動向と洞察
ペットの人間化がプレミアムフード需要を牽引
ペットのヒューマナイズ化は、アジア太平洋地域全体で購買決定を根本的に変容させています。伴侶動物が実用動物ではなく家族の一員として扱われる傾向が強まる中、この行動変容がプレミアム製品の採用を促進しています。ペットオーナーは、有機原料、グレインフリー処方、治療効果など、人間の食品品質基準に匹敵する栄養ソリューションを求めるようになっています。マース社が20市場で実施した調査によると、犬猫飼育者の3分の1以上がペットを「人生で最も大切な存在」と認識しており、特にZ世代(45%)とミレニアル世代(40%)がこの動向を牽引しています。栄養基準や地域の食品安全認証といった規制の影響により、プレミアム製品の主張が裏付けられるケースが増加しており、科学的根拠を通じてブランドが高価格設定を正当化できるようになっています。
主要アジア経済圏における可処分所得の増加
アジア新興市場における経済成長は、自由裁量支出能力を持つ中産階級の拡大をもたらしており、その支出がペットケアに向けられています。フィリピンはこの動向を象徴しており、同国は中上位所得国へと移行しつつある一方、ペットフード市場規模は240億ペソ(4億3,000万米ドル)に迫っています。これは、各家庭がペットの栄養に相当な予算を割り当てていることが原動力となっています。この動向は都市部で加速しており、共働き世帯や家族形成の遅れにより、従来の子育て支出がペットケアへと振り向けられ、経済サイクルを超越した持続可能な需要基盤が確立されています。
変動する肉・穀物原料価格
原材料コストの変動はペットフードのバリューチェーン全体に利益率の圧迫をもたらし、特に価格に敏感な市場セグメントで価格決定力が限られるメーカーに影響を及ぼします。輸入依存型市場では、現地通貨安が商品価格の基礎的な変動以上に投入コストのインフレを拡大させるため、追加的な為替リスクに直面します。この変動性により、製造業者は利益率の圧縮と、顧客が低コストの代替品に流れてしまうリスクを伴う頻繁な価格調整のどちらかを選択せざるを得ません。サプライチェーンの多様化戦略が不可欠となりますが、高品質原料の供給源が地理的に集中しているため、製造業者がサプライヤーの多様化を通じて真のコスト安定性を達成する能力は制限されています。
セグメント分析
2025年時点でアジア太平洋地域のペットフード市場規模の66.05%を食品製品が占め、ペット用医療食は2031年までに8.27%という最速のCAGRを記録すると予測されています。ドライフードは依然として主力商品ですが、ウェットタイプは「人間化」傾向による生肉のような食感への需要増でより速い伸びを見せています。プロバイオティクスやオメガ3脂肪酸の需要拡大に伴い、栄養補助食品・サプリメント分野が勢いを増しています。高タンパク質かつ利便性の高いフリーズドライおやつは二桁成長を遂げています。獣医用ダイエットフードは規模こそ小さいもの、臨床的に検証された処方により最高水準の利益率を実現しています。
プレミアム化の進行に伴い、メーカーは単純な販売量よりも機能性表示を優先する傾向にあります。シンガポールのMajes社など地域イノベーターは2024年に気候特化レシピを導入し、マイクロセグメンテーション戦略を推進。高価な原料と高度な加工技術による単価上昇が、成熟した都市部市場でペット飼育率が飽和状態に近づく中でも収益の持続的成長を支えています。
アジア太平洋地域のペットフード市場レポートは、ペットフード製品(フード、ペット用栄養補助食品/サプリメントなど)、ペット種別(猫、犬、その他のペット)、流通チャネル(コンビニエンスストア、オンラインチャネルなど)、地域別(オーストラリア、中国、インド、インドネシアなど)に分類されています。市場予測は金額(米ドル)および数量(メトリックトン)で提供されます。
その他の特典:
- エクセル形式の市場予測(ME)シート
- アナリストによる3ヶ月間のサポート
よくあるご質問
目次
第1章 イントロダクション
- 調査の前提条件と市場の定義
- 調査範囲
- 調査手法
第2章 レポート提供
第3章 エグゼクティブサマリーおよび主要な調査結果
第4章 主要業界動向
- ペットの飼育数
- 猫
- 犬
- その他のペット
- ペット関連支出
- 消費者の動向
第5章 供給と生産の動向
- 貿易分析
- 原料動向
- バリューチェーンと流通チャネル分析
- 規制の枠組み
- 市場促進要因
- ペットの人間化が進み、プレミアムフードの需要が高まっています
- 主要アジア経済圏における可処分所得の増加
- 電子商取引とラストマイル物流の急速な普及
- 機能性およびクリーンラベル原料の採用
- 昆虫由来タンパク質が規制当局の承認を得る
- AIを活用したパーソナライズド栄養サブスクリプションモデル
- 市場抑制要因
- 変動する肉類・穀物原料価格
- 製品登録および輸入承認手続きの長期化
- ウェット/生食向け冷蔵物流の脆弱性
- ペットの肥満問題によるカロリー摂取量の伸び悩み
第6章 市場規模と成長予測(金額ベース/数量ベース)
- ペットフード製品
- 食品
- サブ製品別
- ドライペットフード
- サブカテゴリー別ドライペットフード
- キブル(ドライフード)
- その他のドライペットフード
- サブカテゴリー別ドライペットフード
- ウェットペットフード
- ドライペットフード
- サブ製品別
- ペット用栄養補助食品/サプリメント
- サブ製品別
- ミルクバイオアクティブ
- オメガ3脂肪酸
- プロバイオティクス
- タンパク質およびペプチド
- ビタミン・ミネラル
- その他の栄養補助食品
- サブ製品別
- ペット用おやつ
- サブ製品別
- カリカリおやつ
- デンタルおやつ
- フリーズドライおよびジャーキーおやつ
- ソフト&チュイートリーツ
- その他のおやつ
- サブ製品別
- ペット用医療食
- サブ製品別
- 皮膚用ダイエットフード
- 糖尿病
- 消化器系サポート
- 肥満用フード
- 口腔ケア用フード
- 腎臓
- 尿路疾患
- その他の獣医用ダイエットフード
- サブ製品別
- 食品
- ペット
- 猫
- 犬
- その他のペット
- 流通チャネル
- コンビニエンスストア
- オンラインチャネル
- 専門店
- スーパーマーケット/ハイパーマーケット
- その他の流通チャネル
- 地域
- オーストラリア
- 中国
- インド
- インドネシア
- 日本
- マレーシア
- フィリピン
- 台湾
- タイ
- ベトナム
- その他アジア太平洋地域
第7章 競合情勢
- 主要な戦略的動きs
- 市場シェア分析
- Brand Positioning Matrix
- Market Claim Analysis
- 企業概況
- 企業プロファイル.
- Alltech Inc.
- Clearlake Capital Group, L.P.(Wellness Pet Company Inc.)
- Colgate-Palmolive Company(Hill's Pet Nutrition Inc.)
- SunRice Group
- Farmina Pet Foods
- General Mills Inc.
- Mars Incorporated
- Nestle S.A.(Purina)
- Schell & Kampeter Inc.(Diamond Pet Foods)
- Virbac S.A.
- Affinity Petcare SA
- IB Group(Drools Pet Food Pvt. Ltd.)
- PLB International
- The J.M. Smucker Company
- Archer Daniels Midland(ADM)

