
飼料用プレバイオティクス:市場シェア分析、産業動向・統計、成長予測(2025年~2030年)
Feed Prebiotics - Market Share Analysis, Industry Trends & Statistics, Growth Forecasts (2025 - 2030)- 発行日
- ページ情報
- 英文 381 Pages
- 納期
- 2~3営業日
- 商品コード
- 1686534
- カスタマイズ可能 お客様のご希望に応じて、既存データの加工や未掲載情報(例:国別セグメント)の追加などの対応が可能です。詳細はお問い合わせください。
- 適宜更新あり 本レポートは最新情報反映のため適宜更新し、内容構成変更を行う場合があります。ご検討の際はお問い合わせください。
- 翻訳ツール提供対象 PDF対応AI翻訳ツールの無料貸し出しサービスのご利用が可能です
概要
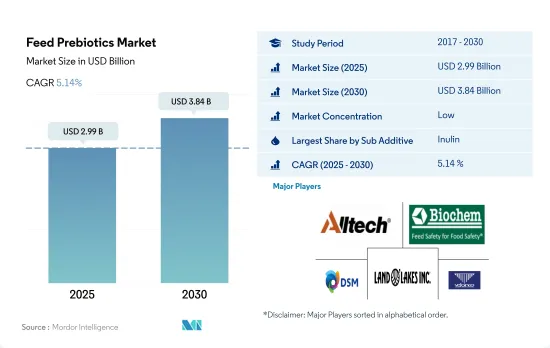
飼料用プレバイオティクス市場規模は2025年に29億9,000万米ドルと推定され、2030年には38億4,000万米ドルに達すると予測され、予測期間(2025-2030年)のCAGRは5.14%で成長する見込みです。
- 飼料用プレバイオティクスの世界市場は著しい成長を遂げており、2022年には25億8,000万米ドルに達し、2017~2022年の期間中に29.5%の著しい増加を反映しています。市場の成長は、家畜人口の急増と畜産業界における動物の健康に対する懸念の高まりに起因しています。
- 飼料用プレバイオティクスの中で、イヌリンは動物飼料に最も広く使用されているプレバイオティクスであり、2022年の市場価値は6億4,490万米ドルです。世界の飼料イヌリン市場では、家禽類が大きな割合を占めており、総市場シェアの58%を占めています。イヌリンの栄養補助食品は、腸内細菌叢を調整し、有益なビフィズス菌と乳酸菌株の迅速な増殖をもたらすことが判明しています。
- キシロオリゴ糖とガラクトオリゴ糖は、動物産業で使用される他の主要なプレバイオティクスであり、それぞれ5億8,000万米ドルと5億6,640万米ドルの市場価値を占めています。これらのプレバイオティクスは、栄養消化率や免疫反応を改善し、生産成績の向上につながることがわかっています。ラクチュロース、フラクトオリゴ糖、マンナンオリゴ糖などの他のプレバイオティクスは、プレバイオティクス市場で7億9,080万米ドルの価値を占めています。
- アジア太平洋地域は、飼料用プレバイオティクスの最大の消費地であり、主に同地域における動物および飼料生産の増加により、世界の動物個体数の50%以上を占めています。
- 国内消費用の食肉および畜産物に対する需要の増加と、添加物の消費に伴う栄養面での利点に関する意識の高まりにより、飼料用プレバイオティクス市場は予測期間中にCAGR 5.1%を記録すると予測されています。
- 飼料用プレバイオティクスの世界市場は、動物飼料に飼料用プレバイオティクスを使用することの利点に対する意識の高まりにより、急速に牽引力を増しています。プレバイオティクスは、飼料効率を高め、病原性細菌に対する耐性を提供し、腸内の有益な微生物に栄養を提供するために配合飼料に添加されます。
- 世界の飼料用プレバイオティクス市場は、2022年には世界の飼料添加物市場のほぼ7.8%を占めました。アジア太平洋が最大の地域であり、普及率と飼料生産量が高いため、市場規模は8億米ドルでした。米国は、商業的畜産が盛んで、畜産農場での新しい生産方法の導入に力を入れているため、2022年には18.1%を占め、世界市場で最大の国に浮上しました。中国とブラジルは配合飼料の生産量が多いため、2022年の市場シェアはそれぞれ13.9%と7.1%でした。
- 家畜の生産性向上におけるプレバイオティクスの重要性から、飼料用プレバイオティクスの世界市場において最大の製品タイプは家禽と豚であり、2022年にはそれぞれ46.2%と25.2%を占めました。したがって、抗生物質としてのプレバイオティクスの使用率が高いことから、予測期間中のCAGRは5.1%で市場を牽引すると予想されます。
- 飼料用プレバイオティクスの世界市場は、動物性タンパク質に対する需要の増加、動物の健康と生産性の向上に対する関心の高まり、動物飼料における抗生物質の代替としてのプレバイオティクスの採用の増加によって、今後数年間で大きな成長を記録すると予測されます。
世界の飼料用プレバイオティクス市場動向
動物性タンパク質や卵などの家禽製品への高い需要と家禽部門への投資の増加により、家禽人口が増加しています。
- 家禽の飼育頭数は近年大幅に増加しているが、これは主に日常食における鶏肉と鶏卵の需要が増加しているためです。鶏肉製品へのシフトは、米国における豚肉など他の食肉の価格上昇に起因しています。例えば欧州における卵の消費量は2017年から2021年にかけて4.6%増加し、2021年には6,135トンを占める。
- アジア太平洋は最大の家禽類生産国で、2022年の生産量は2017年比で6.6%増加します。家禽生産量の増加は、アフリカ豚熱の発生により豚肉の供給が減少したことを受け、動物性タンパク質への需要が高まっているためです。世界の生産量の40%を占める中国には9億羽以上の採卵鶏がおり、最大のレイヤー養鶏センターでは年間6,000万羽のヒナを孵化させることができます。中東地域もまた、予測期間(2023~2029年)に鶏肉生産の成長が見込まれます。サウジアラビアのAlmaraiのような企業がこの分野に多額の投資を行っており、生産拡大のための新農場設立に11億2,000万米ドルを投じています。
- 鶏肉製品の需要増と鶏肉セクターへの投資増が相まって、飼料生産の成長が強化されると予想されます。このことが、予測期間中の世界市場における飼料添加物の需要を促進すると予想されます。全体として、鶏肉業界は、鶏肉製品へのシフトと同部門への投資の増加により、今後数年間で大きく成長する態勢を整えています。
アジア太平洋と南米における水産物消費の需要拡大と政府の取り組みにより、養殖種用の飼料生産が増加しています。
- 養殖業の拡大により飼料需要が急増しており、これが配合飼料生産の成長を牽引しています。2022年、配合飼料生産量は前年比13.1%増、養魚飼料生産量は2017年から2022年にかけて46.3%増。魚用飼料の消費量の増加は、水産物の需要増に対応するため、水産動物の性能を維持・向上させ、生産性を向上させる必要があることが背景にあります。
- アジア太平洋地域では魚の消費と生産が盛んであるため、2022年には魚用飼料が世界市場の73.2%を占める。世界市場ではエビやその他の水生種が魚に続いており、エビは欧州地域や米国の国々が他地域から大量に輸入しています。増大する水産物需要を満たすため、各国は養殖生産の拡大に力を入れています。例えば、インドは生産量を増やすために水産省への予算配分を2020年の1億1,410万米ドルから2021年には1億6,880万米ドルに増額しており、予測期間中に飼料需要を押し上げると予想されます。
- 南米でも飼料生産が増加しており、養殖の拡大により2022年には2017年から46.4%上昇して510万トンに達します。同地域は主要な水産物消費地域のひとつであり、水産物需要の増加が養殖生産の成長を促進しています。増大する需要に対応するために養殖が拡大し続ける中、業界の開発とその拡大に注力することが、飼料生産の成長を促進すると予想されます。このような水生種向けの飼料生産の増加は、予測期間中の水生セグメントの成長を助けると予想されます。
飼料用プレバイオティクス産業の概要
飼料用プレバイオティクス市場は細分化されており、上位5社で26.04%を占めています。この市場の主要企業は以下の通りです。 Alltech, Inc., Biochem Zusatzstoffe Handels-und Produktionsgesellschaft mbH, DSM Nutritional Products AG, Land O'Lakes and Vetanco(sorted alphabetically).
その他の特典
- エクセル形式の市場予測(ME)シート
- 3ヶ月のアナリストサポート
目次
第1章 エグゼクティブサマリーと主な調査結果
第2章 レポートのオファー
第3章 イントロダクション
- 調査の前提条件と市場定義
- 調査範囲
- 調査手法
第4章 主要産業動向
- 動物頭数
- 家禽
- 反芻動物
- 豚
- 飼料生産
- 水産養殖
- 家禽
- 反芻動物
- 養豚
- 規制の枠組み
- オーストラリア
- ブラジル
- カナダ
- 中国
- フランス
- ドイツ
- インド
- イタリア
- 日本
- メキシコ
- オランダ
- フィリピン
- ロシア
- 南アフリカ
- スペイン
- タイ
- トルコ
- 英国
- 米国
- ベトナム
- バリューチェーンと流通チャネル分析
第5章 市場セグメンテーション
- サブ添加物
- フラクトオリゴ糖
- ガラクトオリゴ糖
- イヌリン
- ラクチュロース
- マンナンオリゴ糖
- キシロオリゴ糖
- その他のプレバイオティクス
- 動物
- 水産養殖
- サブ動物別
- 魚類
- エビ
- その他の養殖種
- 家禽類
- サブ動物別
- ブロイラー
- レイヤー
- その他の鳥類
- 反芻動物
- サブ動物別
- 肉牛
- 乳牛
- その他の反芻動物
- 豚
- その他の動物
- 水産養殖
- 地域
- アフリカ
- 国別
- エジプト
- ケニア
- 南アフリカ
- その他のアフリカ
- アジア太平洋
- 国
- オーストラリア
- 中国
- インド
- インドネシア
- 日本
- フィリピン
- 韓国
- タイ
- ベトナム
- その他アジア太平洋地域
- 欧州
- 国別
- フランス
- ドイツ
- イタリア
- オランダ
- ロシア
- スペイン
- トルコ
- 英国
- その他欧州
- 中東
- 国別
- イラン
- サウジアラビア
- その他中東
- 北米
- 国別
- カナダ
- メキシコ
- 米国
- その他北米地域
- 南米
- 国別
- アルゼンチン
- ブラジル
- チリ
- その他南米諸国
- アフリカ
第6章 競合情勢
- 主要な戦略的動き
- 市場シェア分析
- 企業情勢
- 企業プロファイル.
- Alltech, Inc.
- Behn Meyer
- Biochem Zusatzstoffe Handels-und Produktionsgesellschaft mbH
- DSM Nutritional Products AG
- EW Nutrition
- Impextraco NV
- Land O'Lakes
- Marubeni Corporation(Orffa International Holding B.V.)
- Vetanco
第7章 CEOへの主な戦略的質問
第8章 付録
- 世界概要
- 概要
- ファイブフォース分析フレームワーク
- 世界のバリューチェーン分析
- 世界市場規模とDRO
- 情報源と参考文献
- 図表リスト
- 主要洞察
- データパック
- 用語集
目次
The Feed Prebiotics Market size is estimated at 2.99 billion USD in 2025, and is expected to reach 3.84 billion USD by 2030, growing at a CAGR of 5.14% during the forecast period (2025-2030).
- The global feed prebiotics market has been witnessing significant growth, and in 2022, it reached a value of USD 2.58 billion, reflecting a remarkable increase of 29.5% during the period 2017-2022. The market growth can be attributed to the surge in livestock population and the growing concerns about animal health in the animal industry.
- Among feed prebiotics, inulin is the most extensively used prebiotic in animal feeds, accounting for a market value of USD 644.9 million in 2022. Poultry birds consume a significant proportion of the global feed inulin market, representing 58% of the total market share. Dietary supplementation of poultry feeding with inulin has been found to modulate intestinal microbiota, resulting in the quick proliferation of beneficial Bifidobacterium and Lactobacillus strains.
- Xylo oligosaccharides and galacto oligosaccharides are the other major prebiotics used in the animal industry, accounting for market values of USD 580 million and USD 566.4 million, respectively. These prebiotics have been found to improve nutrient digestibility and immune responses, which translate into improved production performance. Other prebiotics, such as lactulose, fructo oligosaccharides, mannan oligosaccharides, and others, accounted for USD 790.8 million value in the prebiotics market.
- The Asia-Pacific region is the largest consumer of feed prebiotics, accounting for more than 50% of the global animal population, mainly due to the increased animal and feed production in the region.
- With the increasing demand for meat and livestock products for domestic consumption and the rising awareness regarding the nutritional benefits associated with additives consumption, the feed prebiotics market is anticipated to experience a CAGR of 5.1% during the forecast period.
- The global feed prebiotics market is rapidly gaining traction due to the growing awareness of the benefits of using feed prebiotics in animal feed. Prebiotics are added to compound feed to increase feed efficiency, offer resistance against pathogenic bacteria, and provide nutrition to beneficial microorganisms in the gut.
- The global feed prebiotics market accounted for almost 7.8% of the global feed additives market in 2022. Asia-Pacific was the largest region, with a market value of USD 0.8 billion, due to the higher penetration rate and feed production. The United States emerged as the largest country in the global market, accounting for 18.1% in 2022, due to extensive commercial animal cultivation and the country's focus on implementing new production practices in animal farms. Due to their higher compound feed production, China and Brazil held market shares of 13.9% and 7.1% in 2022, respectively.
- Poultry birds and swine were the largest animal types in the global feed prebiotics market, accounting for 46.2% and 25.2% in 2022, respectively, due to the significance of prebiotics in increasing animal productivity. Therefore, the higher usage of prebiotics as antibiotics is expected to drive the market at a CAGR of 5.1% during the forecast period.
- The global feed prebiotics market is projected to record significant growth in the coming years, driven by the increasing demand for animal protein, the rising focus on improving animal health and productivity, and the growing adoption of prebiotics as an alternative to antibiotics in animal feed.
Global Feed Prebiotics Market Trends
High demand for animal protein and poultry products such as eggs with increasing investment in poultry sector is increasing poultry population
- The poultry population has witnessed a significant increase in recent years, primarily due to the growing demand for chicken meat and eggs in daily diets. The shift toward poultry products has been driven by the increasing prices of other meat, such as pig meat, in the United States. The consumption of eggs in Europe, for instance, increased by 4.6% between 2017 and 2021, accounting for 6,135 metric ton in 2021.
- Asia-Pacific is the largest producer of poultry birds, with production increasing by 6.6% in 2022 compared to 2017. The rise in poultry production is due to the growing demand for animal protein following the outbreak of African Swine Fever, which has reduced the supply of pork meat. China, which accounts for 40% of global production, has more than 900 million stock-laying hens, and the largest layer poultry farming center can hatch 60 million chicks per year. The Middle East region is also expected to witness growth in poultry production in the forecast period (2023-2029). Companies such as Almarai in Saudi Arabia have invested heavily in the sector, with USD 1.12 billion spent on establishing new farms to expand production.
- The increasing demand for poultry products, coupled with rising investments in the poultry sector, is expected to strengthen the growth of feed production. This, in turn, is expected to drive the demand for feed additives in the global market during the forecast period. Overall, the poultry industry is poised for significant growth in the coming years, driven by the shift toward poultry products and increasing investments in the sector.
The growing demand for seafood consumption in Asia-Pacific and South America, and government initiatives is increasing the feed production for aquaculture species
- The demand for feed is rapidly increasing due to the expansion of aquaculture, which is driving the growth of compound feed production. In 2022, compound feed production increased by 13.1% from the previous year, and fish feed production increased by 46.3% between 2017 and 2022. The rise in consumption of fish feed is driven by the need to maintain and improve the performance of aquatic animals and increase productivity to meet the growing demand for seafood.
- Fish feed accounted for 73.2% of the global market in 2022, as fish is highly consumed and produced in the Asia-Pacific region. Shrimp and other aquatic species follow fish in the global market, with shrimp being highly imported by countries in the European region and the United States from other regions. To meet the growing demand for seafood, countries are focusing on the expansion of aquaculture production. For instance, India increased its budget allocation to the department of fisheries from USD 114.1 million in 2020 to USD 168.8 million in 2021 to increase production, which is expected to boost the demand for feed during the forecast period.
- South America is also experiencing an increase in feed production, which has risen by 46.4% in 2022 from 2017 to reach 5.1 million metric ton due to the expansion of aquaculture farming. The region is one of the major seafood-consuming regions, and the increasing demand for seafood is driving the growth of aquaculture production. As aquaculture continues to expand to meet the growing demand, the development of the industry and a focus on its expansion are expected to fuel the growth of feed production. This increase in feed production for aquatic species is expected to aid in the growth of the aquatic segment during the forecast period.
Feed Prebiotics Industry Overview
The Feed Prebiotics Market is fragmented, with the top five companies occupying 26.04%. The major players in this market are Alltech, Inc., Biochem Zusatzstoffe Handels- und Produktionsgesellschaft mbH, DSM Nutritional Products AG, Land O'Lakes and Vetanco (sorted alphabetically).
Additional Benefits:
- The market estimate (ME) sheet in Excel format
- 3 months of analyst support
TABLE OF CONTENTS
1 EXECUTIVE SUMMARY & KEY FINDINGS
2 REPORT OFFERS
3 INTRODUCTION
- 3.1 Study Assumptions & Market Definition
- 3.2 Scope of the Study
- 3.3 Research Methodology
4 KEY INDUSTRY TRENDS
- 4.1 Animal Headcount
- 4.1.1 Poultry
- 4.1.2 Ruminants
- 4.1.3 Swine
- 4.2 Feed Production
- 4.2.1 Aquaculture
- 4.2.2 Poultry
- 4.2.3 Ruminants
- 4.2.4 Swine
- 4.3 Regulatory Framework
- 4.3.1 Australia
- 4.3.2 Brazil
- 4.3.3 Canada
- 4.3.4 China
- 4.3.5 France
- 4.3.6 Germany
- 4.3.7 India
- 4.3.8 Italy
- 4.3.9 Japan
- 4.3.10 Mexico
- 4.3.11 Netherlands
- 4.3.12 Philippines
- 4.3.13 Russia
- 4.3.14 South Africa
- 4.3.15 Spain
- 4.3.16 Thailand
- 4.3.17 Turkey
- 4.3.18 United Kingdom
- 4.3.19 United States
- 4.3.20 Vietnam
- 4.4 Value Chain & Distribution Channel Analysis
5 MARKET SEGMENTATION (includes market size in Value in USD and Volume, Forecasts up to 2030 and analysis of growth prospects)
- 5.1 Sub Additive
- 5.1.1 Fructo Oligosaccharides
- 5.1.2 Galacto Oligosaccharides
- 5.1.3 Inulin
- 5.1.4 Lactulose
- 5.1.5 Mannan Oligosaccharides
- 5.1.6 Xylo Oligosaccharides
- 5.1.7 Other Prebiotics
- 5.2 Animal
- 5.2.1 Aquaculture
- 5.2.1.1 By Sub Animal
- 5.2.1.1.1 Fish
- 5.2.1.1.2 Shrimp
- 5.2.1.1.3 Other Aquaculture Species
- 5.2.2 Poultry
- 5.2.2.1 By Sub Animal
- 5.2.2.1.1 Broiler
- 5.2.2.1.2 Layer
- 5.2.2.1.3 Other Poultry Birds
- 5.2.3 Ruminants
- 5.2.3.1 By Sub Animal
- 5.2.3.1.1 Beef Cattle
- 5.2.3.1.2 Dairy Cattle
- 5.2.3.1.3 Other Ruminants
- 5.2.4 Swine
- 5.2.5 Other Animals
- 5.2.1 Aquaculture
- 5.3 Region
- 5.3.1 Africa
- 5.3.1.1 By Country
- 5.3.1.1.1 Egypt
- 5.3.1.1.2 Kenya
- 5.3.1.1.3 South Africa
- 5.3.1.1.4 Rest of Africa
- 5.3.2 Asia-Pacific
- 5.3.2.1 By Country
- 5.3.2.1.1 Australia
- 5.3.2.1.2 China
- 5.3.2.1.3 India
- 5.3.2.1.4 Indonesia
- 5.3.2.1.5 Japan
- 5.3.2.1.6 Philippines
- 5.3.2.1.7 South Korea
- 5.3.2.1.8 Thailand
- 5.3.2.1.9 Vietnam
- 5.3.2.1.10 Rest of Asia-Pacific
- 5.3.3 Europe
- 5.3.3.1 By Country
- 5.3.3.1.1 France
- 5.3.3.1.2 Germany
- 5.3.3.1.3 Italy
- 5.3.3.1.4 Netherlands
- 5.3.3.1.5 Russia
- 5.3.3.1.6 Spain
- 5.3.3.1.7 Turkey
- 5.3.3.1.8 United Kingdom
- 5.3.3.1.9 Rest of Europe
- 5.3.4 Middle East
- 5.3.4.1 By Country
- 5.3.4.1.1 Iran
- 5.3.4.1.2 Saudi Arabia
- 5.3.4.1.3 Rest of Middle East
- 5.3.5 North America
- 5.3.5.1 By Country
- 5.3.5.1.1 Canada
- 5.3.5.1.2 Mexico
- 5.3.5.1.3 United States
- 5.3.5.1.4 Rest of North America
- 5.3.6 South America
- 5.3.6.1 By Country
- 5.3.6.1.1 Argentina
- 5.3.6.1.2 Brazil
- 5.3.6.1.3 Chile
- 5.3.6.1.4 Rest of South America
- 5.3.1 Africa
6 COMPETITIVE LANDSCAPE
- 6.1 Key Strategic Moves
- 6.2 Market Share Analysis
- 6.3 Company Landscape
- 6.4 Company Profiles (includes Global Level Overview, Market Level Overview, Core Business Segments, Financials, Headcount, Key Information, Market Rank, Market Share, Products and Services, and Analysis of Recent Developments).
- 6.4.1 Alltech, Inc.
- 6.4.2 Behn Meyer
- 6.4.3 Biochem Zusatzstoffe Handels- und Produktionsgesellschaft mbH
- 6.4.4 DSM Nutritional Products AG
- 6.4.5 EW Nutrition
- 6.4.6 Impextraco NV
- 6.4.7 Land O'Lakes
- 6.4.8 Marubeni Corporation (Orffa International Holding B.V.)
- 6.4.9 Vetanco
7 KEY STRATEGIC QUESTIONS FOR FEED ADDITIVE CEOS
8 APPENDIX
- 8.1 Global Overview
- 8.1.1 Overview
- 8.1.2 Porter's Five Forces Framework
- 8.1.3 Global Value Chain Analysis
- 8.1.4 Global Market Size and DROs
- 8.2 Sources & References
- 8.3 List of Tables & Figures
- 8.4 Primary Insights
- 8.5 Data Pack
- 8.6 Glossary of Terms
- 発行日
- 発行
- Mordor Intelligence
- ページ情報
- 英文 381 Pages
- 納期
- 2~3営業日


