
バイオ殺菌剤:市場シェア分析、産業動向・統計、成長予測(2025年~2030年)
Biofungicides - Market Share Analysis, Industry Trends & Statistics, Growth Forecasts (2025 - 2030)- 発行日
- ページ情報
- 英文 280 Pages
- 納期
- 2~3営業日
- 商品コード
- 1685859
- カスタマイズ可能 お客様のご希望に応じて、既存データの加工や未掲載情報(例:国別セグメント)の追加などの対応が可能です。詳細はお問い合わせください。
- 適宜更新あり 本レポートは最新情報反映のため適宜更新し、内容構成変更を行う場合があります。ご検討の際はお問い合わせください。
- 翻訳ツール提供対象 PDF対応AI翻訳ツールの無料貸し出しサービスのご利用が可能です
概要
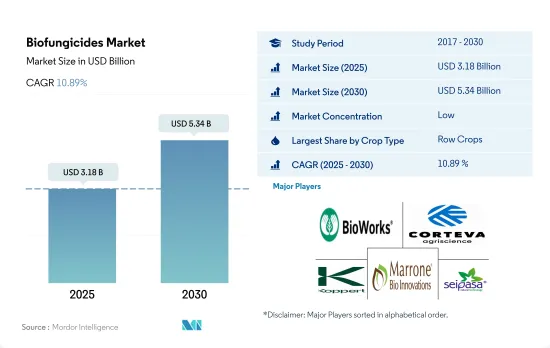
バイオ殺菌剤の市場規模は2025年に31億8,000万米ドルと推定・予測され、2030年には53億4,000万米ドルに達し、予測期間(2025~2030年)のCAGRは10.89%で成長すると予測されます。
- 2022年の世界のバイオ殺菌剤市場は、主に連作作物の生産が牽引しており、主な作物は大麦、トウモロコシ、小麦、菜種、ライ麦、ヒマワリ、大豆、米です。これらの作物は金額ベースで世界のバイオ殺菌剤市場の約84.1%を占めています。北米がこの分野の市場を独占しており、米国が市場全体の71.4%を占める主要国です。米国では連作作物の栽培面積がかなり広いため、連作作物におけるバイオ殺菌剤の消費は今後も伸びると予想されます。
- バナナ、リンゴ、ブドウ、トマト、タマネギ、キュウリ、キャベツなどの果物や野菜を含む園芸作物は、2022年に世界のバイオ殺菌剤市場の12.3%を占めました。欧州地域がこの市場のサブセグメントを支配しており、68.4%のシェアを占めています。イタリア、フランス、スペインがこの地域の主要国で、イタリアは39.7%のシェアを占めています。
- コーヒー、紅茶、ココア、綿花、タバコ、ゴム、サトウキビなどの換金作物は、2022年のバイオ殺菌剤の世界総消費量の4.0%を占めました。欧州地域がこの市場のサブセグメントを支配し、42.1%のシェアを占めています。フランス、ドイツ、イタリアがこの地域の主要国で、フランスは34.2%のシェアを占めています。
- 健康上の懸念から有機的に生産された果物や野菜の需要が増加しており、2023年から2029年にかけて、市場の作物セグメントにおけるバイオ殺菌剤の消費をさらに押し上げると予想されます。
- 農業では、バチルス菌、トリコデルマ菌、ストレプトマイセス菌、シュードモナス菌がバイオ殺菌剤として最も一般的に利用されている微生物です。これらの微生物は、ピシウム菌、リゾクトニア菌、フザリウム菌、スクレロチニア菌、チエラビオプシス菌、ボトリティス菌、うどんこ病などの病原菌に効果があることが証明されています。
- 欧州はバイオ殺菌剤の最大市場で、2022年には金額ベースで41.1%のシェアを占める。フランスは欧州連合の主要な農業生産国です。小麦、ライ麦、大麦、トウモロコシ、テンサイ、オート麦が同国で栽培されている主要作物のひとつです。フランスは2022年の金額ベースで欧州のバイオ殺菌剤市場の27.5%のシェアを占めました。この高いシェアは主に、同国の有機栽培面積が広大であることによるもので、2022年には同地域の有機栽培面積全体の17.4%を占める。
- 北米はバイオ殺菌剤の第2位の消費国であり、2022年には8億2,680万米ドルで37.7%のシェアを占め、2029年には17億6,000万米ドルに達すると予想されています。米国のような北米諸国では、有機証明書コストシェアプログラムや、コストシェア緩衝地帯を設置するための資金援助、有機農家への低利融資といった政府の取り組みが、バイオ殺菌剤の使用を加速させています。バイオ殺菌剤市場は2023年から2029年にかけて11.5%のCAGRで推移すると予測されています。
- 複数の作用様式と、生物防除と植物成長促進の両方において少数のバイオ殺菌剤が果たす役割は、バイオ殺菌剤市場を世界的に牽引すると予想されます。市場は2023年から2029年にかけてCAGR 10.8%を記録すると推定されます。
世界のバイオ殺菌剤市場動向
北米と欧州では、有機農業に対する意識の高まりと政府の取り組みにより、有機農業の生産量が過去最高を記録しています。
- 有機農業は持続可能な食糧システムに大きく貢献するものとして台頭し、世界187カ国で実践されています。2021年現在、世界の有機農地は7,230万haで、2018年から2021年にかけて全地域で平均2.9%増加しています。有機耕地は1,440万haで、有機農地全体の19.9%を占めています。
- 有機農業の最も強力な市場は北米と欧州で、世界の有機耕地の41.0%を占めています。2022年には、欧州には650万haの有機耕地があり、これは有機耕地全体の44.1%に相当します。北米と欧州で有機栽培されている最も重要な作物は、リンゴ、イチゴ、穀物、オリーブです。
- アジア太平洋の新興諸国も有機農業運動に参加し、国内需要を満たす新鮮な有機農産物の生産と供給で自給自足しつつあります。有機農業の動向はアジア太平洋で勢いを増しており、同地域では2017年から2022年にかけて有機耕地面積が18.8%増加します。この地域の政府による主要な取り組みも、有機農業の拡大傾向に重要な役割を果たしています。例えば、日本の食料・農業・農村基本計画は、2030年までに有機農家と有機農地の数を3倍に増やすことを目標としています。
- 有機農業の成長の原動力となっているのは、土壌の健康を促進し、環境への影響を低減し、より健康的な食品を生産するといった、有機農業の利点に対する意識の高まりです。
有機食品の1人当たり支出は主に米国とドイツで観察されるが、これはより健康的で持続可能な食品に対する消費者の需要に起因します。
- オーガニック食品市場は過去数年間に著しい成長を遂げ、世界の売上高は2012年の708億米ドルから2020年には1,206億米ドルに達します。有機食品への動向は、より健康的で持続可能な食品の選択肢を求める消費者需要の高まりや、従来型農業が環境に与える影響に対する意識の高まりなど、いくつかの要因に後押しされています。世界の有機食品市場は、今後数年間も成長傾向が続くと予想されます。
- オーガニック・トレード協会が2021年に実施した調査によると、同年のオーガニック果物・野菜の売上高は約4.5%増加し、オーガニック売上高全体の15%を占めました。オーガニック製品への平均支出額では北米が市場を独占しており、米国の1人当たり支出額は2021年に186.7米ドルに達し、北米諸国の中で最も高いです。欧州も有機食品市場で大きな成長が見込まれており、2021年の1人当たり支出額が最も高いのはドイツで75.6米ドルです。
- 有機食品市場は、消費者の可処分所得の高い先進諸国が依然として支配的であるが、新興諸国でも成長が見込まれます。例えば、アジア太平洋地域では労働者階級が増加しており、有機食品を入手しやすく手頃な価格になっているため、市場の拡大に寄与する可能性があります。
バイオ殺菌剤産業の概要
バイオ殺菌剤市場は断片化されており、上位5社で1.40%を占めています。この市場の主要企業は以下の通りです。 Bioworks Inc., Corteva Agriscience, Koppert Biological Systems Inc., Marrone Bio Innovations Inc. and Seipasa SA(sorted alphabetically).
その他の特典
- エクセル形式の市場予測(ME)シート
- 3ヶ月のアナリストサポート
目次
第1章 エグゼクティブサマリーと主な調査結果
第2章 レポートのオファー
第3章 イントロダクション
- 調査の前提条件と市場定義
- 調査範囲
- 調査手法
第4章 主要産業動向
- 有機栽培面積
- 一人当たりのオーガニック製品への支出
- 規制の枠組み
- アルゼンチン
- オーストラリア
- ブラジル
- カナダ
- 中国
- エジプト
- フランス
- ドイツ
- インド
- インドネシア
- イタリア
- 日本
- メキシコ
- オランダ
- ナイジェリア
- フィリピン
- ロシア
- 南アフリカ
- スペイン
- タイ
- トルコ
- 英国
- 米国
- ベトナム
- バリューチェーンと流通チャネル分析
第5章 市場セグメンテーション
- 作物タイプ
- 換金作物
- 園芸作物
- 耕作作物
- 地域
- アフリカ
- 国別
- エジプト
- ナイジェリア
- 南アフリカ
- その他のアフリカ
- アジア太平洋
- 国別
- オーストラリア
- 中国
- インド
- インドネシア
- 日本
- フィリピン
- タイ
- ベトナム
- その他アジア太平洋地域
- 欧州
- 国別
- フランス
- ドイツ
- イタリア
- オランダ
- ロシア
- スペイン
- トルコ
- 英国
- その他欧州
- 中東
- 国別
- イラン
- サウジアラビア
- その他中東
- 北米
- 国別
- カナダ
- メキシコ
- 米国
- その他北米地域
- 南米
- 国別
- アルゼンチン
- ブラジル
- その他南米
- アフリカ
第6章 競合情勢
- 主要な戦略動向
- 市場シェア分析
- 企業情勢
- 企業プロファイル.
- Andermatt Group AG
- Biolchim SPA
- Bioworks Inc.
- Certis USA LLC
- Corteva Agriscience
- Indogulf BioAg LLC(Biotech Division of Indogulf Company)
- Koppert Biological Systems Inc.
- Lallemand Inc.
- Marrone Bio Innovations Inc.
- Seipasa SA
第7章 CEOへの主な戦略的質問
第8章 付録
- 世界概要
- 概要
- ファイブフォース分析フレームワーク
- 世界のバリューチェーン分析
- 市場力学(DROs)
- 情報源と参考文献
- 図表一覧
- 主要洞察
- データパック
- 用語集
目次
Product Code: 48617
The Biofungicides Market size is estimated at 3.18 billion USD in 2025, and is expected to reach 5.34 billion USD by 2030, growing at a CAGR of 10.89% during the forecast period (2025-2030).
- The global biofungicides market in 2022 was primarily driven by the production of row crops, with the main crops being barley, corn, wheat, rapeseed, rye, sunflower, soybean, and rice. These crops accounted for approximately 84.1% of the global biofungicides market in terms of value. North America dominates this segment of the market, with the United States being the leading country, accounting for 71.4% of the total market value. The consumption of biofungicides in row crops is expected to continue to grow due to the considerable extent of area under the cultivation of these crops in the United States.
- Horticultural crops, including fruits and vegetables such as bananas, apples, grapes, tomatoes, onions, cucumbers, and cabbages, accounted for 12.3% of the global biofungicides market in 2022. The European region dominates this sub-segment of the market, accounting for a share of 68.4%. Italy, France, and Spain are the leading countries in this region, with Italy accounting for a share of 39.7%.
- Cash crops, including coffee, tea, cocoa, cotton, tobacco, rubber, and sugarcane, accounted for 4.0% of the total global consumption of biofungicides in 2022. The European region dominates this sub-segment of the market, accounting for a share of 42.1%. France, Germany, and Italy are the leading countries in this region, with France accounting for a share of 34.2%.
- The increased demand for organically produced fruits and vegetables, driven by health concerns, is expected to further boost the consumption of biofungicides in the crop segment of the market between 2023 and 2029.
- In agriculture, Bacillus, Trichoderma, Streptomyces, and Pseudomonas are the most commonly utilized microorganisms as bio fungicides. They have proven effective against pathogens such as Pythium, Rhizoctonia, Fusarium, Sclerotinia, Thielaviopsis, Botrytis, and powdery mildew.
- Europe is the largest market for biofungicides, accounting for a share of 41.1% in terms of value in 2022. France is the European Union's leading agricultural producer. Wheat, rye, barley, corn, sugar beet, and oats are among the major crops grown in the country. France accounted for a share of 27.5% of the European biofungicides market in terms of value in 2022. The high share percentage was primarily due to the country's extensive area under organic cultivation, accounting for 17.4% of the total organic area in the region in 2022.
- North America is the second-largest consumer of biofungicides; it accounted for a share of 37.7% in 2022, valued at USD 826.8 million, which is expected to reach USD 1.76 billion by 2029. Government initiatives in North American countries like the United States, such as the Organic Certificate cost-share program, providing financial assistance to establish a cost-share buffer zone, and low-interest loans for organic farmers, help accelerate the use of biofungicides. The biofungicides market is anticipated to register a CAGR of 11.5% between 2023 and 2029.
- The multiple modes of action and the role of a few biofungicides in both biocontrol and stimulating plant growth are expected to drive the market for biofungicides globally. The market is estimated to register a CAGR of 10.8% between 2023 and 2029.
Global Biofungicides Market Trends
Organic production is at an all-time high in North America and Europe, due to the increasing awareness and Government initiatives.
- Organic agriculture has emerged as a significant contributor to sustainable food systems, with 187 countries practicing it globally. As of 2021, there was 72.3 million ha of organic agricultural land worldwide, with an average increase of 2.9% across all regions from 2018 to 2021. Organic arable land accounted for 14.4 million ha, representing 19.9% of the total organic agricultural land.
- The strongest markets for organic farming are North America and Europe, accounting for 41.0% of the global organic arable land. In 2022, Europe had 6.5 million ha of organic arable land, equivalent to 44.1% of the overall organic arable agricultural area. The most significant crops grown organically in North America and Europe are apples, strawberries, cereals, and olives.
- Developing countries in Asia-Pacific are also joining the organic agriculture movement and becoming self-sufficient in producing and providing fresh organic produce to meet their domestic demand. The trend of organic farming is gaining momentum in Asia-Pacific, with the region recording an 18.8% increase in organic arable land from 2017 to 2022. The major initiatives by governments in the region also play a vital role in the growing trend of organic farming. For example, Japan's Basic Plan for Food, Agriculture, and Rural Areas aims to triple the number of organic farmers and lands by 2030.
- The growth of organic agriculture is driven by the rising awareness of the benefits of organic farming, such as promoting soil health, reducing environmental impacts, and producing healthier food.
Per capita spending of organic food majorly observed in United States and Germany, attributed to the consumer demand for healthier and sustainable food
- The organic food market experienced significant growth in the past few years, with global sales reaching USD 120.6 billion in 2020, up from USD 70.8 billion in 2012. The trend toward organic food is being driven by several factors, such as increasing consumer demand for healthier, more sustainable food options and a growing awareness of the environmental impact of conventional agriculture. The global organic food market is expected to continue its growth trend over the coming years.
- According to a survey conducted by the Organic Trade Association in 2021, sales of organic fruits and vegetables increased by around 4.5% in the same year, accounting for 15% of the overall organic sales. North America dominates the market in terms of average spending on organic products, with per capita spending in the United States reaching USD 186.7 in 2021, the highest among all North American countries. Europe is also expected to experience significant growth in the organic food market, with Germany accounting for the highest per capita spending of USD 75.6 in 2021.
- While the organic food market is still dominated by developed countries with high consumer disposable incomes, it is also expected to grow in developing nations. For example, the increasing number of working-class people in the Asia-Pacific region may contribute to the market's expansion due to the growing availability and affordability of organic food products.
Biofungicides Industry Overview
The Biofungicides Market is fragmented, with the top five companies occupying 1.40%. The major players in this market are Bioworks Inc., Corteva Agriscience, Koppert Biological Systems Inc., Marrone Bio Innovations Inc. and Seipasa SA (sorted alphabetically).
Additional Benefits:
- The market estimate (ME) sheet in Excel format
- 3 months of analyst support
TABLE OF CONTENTS
1 EXECUTIVE SUMMARY & KEY FINDINGS
2 REPORT OFFERS
3 INTRODUCTION
- 3.1 Study Assumptions & Market Definition
- 3.2 Scope of the Study
- 3.3 Research Methodology
4 KEY INDUSTRY TRENDS
- 4.1 Area Under Organic Cultivation
- 4.2 Per Capita Spending On Organic Products
- 4.3 Regulatory Framework
- 4.3.1 Argentina
- 4.3.2 Australia
- 4.3.3 Brazil
- 4.3.4 Canada
- 4.3.5 China
- 4.3.6 Egypt
- 4.3.7 France
- 4.3.8 Germany
- 4.3.9 India
- 4.3.10 Indonesia
- 4.3.11 Italy
- 4.3.12 Japan
- 4.3.13 Mexico
- 4.3.14 Netherlands
- 4.3.15 Nigeria
- 4.3.16 Philippines
- 4.3.17 Russia
- 4.3.18 South Africa
- 4.3.19 Spain
- 4.3.20 Thailand
- 4.3.21 Turkey
- 4.3.22 United Kingdom
- 4.3.23 United States
- 4.3.24 Vietnam
- 4.4 Value Chain & Distribution Channel Analysis
5 MARKET SEGMENTATION (includes market size in Value in USD and Volume, Forecasts up to 2030 and analysis of growth prospects)
- 5.1 Crop Type
- 5.1.1 Cash Crops
- 5.1.2 Horticultural Crops
- 5.1.3 Row Crops
- 5.2 Region
- 5.2.1 Africa
- 5.2.1.1 By Country
- 5.2.1.1.1 Egypt
- 5.2.1.1.2 Nigeria
- 5.2.1.1.3 South Africa
- 5.2.1.1.4 Rest of Africa
- 5.2.2 Asia-Pacific
- 5.2.2.1 By Country
- 5.2.2.1.1 Australia
- 5.2.2.1.2 China
- 5.2.2.1.3 India
- 5.2.2.1.4 Indonesia
- 5.2.2.1.5 Japan
- 5.2.2.1.6 Philippines
- 5.2.2.1.7 Thailand
- 5.2.2.1.8 Vietnam
- 5.2.2.1.9 Rest of Asia-Pacific
- 5.2.3 Europe
- 5.2.3.1 By Country
- 5.2.3.1.1 France
- 5.2.3.1.2 Germany
- 5.2.3.1.3 Italy
- 5.2.3.1.4 Netherlands
- 5.2.3.1.5 Russia
- 5.2.3.1.6 Spain
- 5.2.3.1.7 Turkey
- 5.2.3.1.8 United Kingdom
- 5.2.3.1.9 Rest of Europe
- 5.2.4 Middle East
- 5.2.4.1 By Country
- 5.2.4.1.1 Iran
- 5.2.4.1.2 Saudi Arabia
- 5.2.4.1.3 Rest of Middle East
- 5.2.5 North America
- 5.2.5.1 By Country
- 5.2.5.1.1 Canada
- 5.2.5.1.2 Mexico
- 5.2.5.1.3 United States
- 5.2.5.1.4 Rest of North America
- 5.2.6 South America
- 5.2.6.1 By Country
- 5.2.6.1.1 Argentina
- 5.2.6.1.2 Brazil
- 5.2.6.1.3 Rest of South America
- 5.2.1 Africa
6 COMPETITIVE LANDSCAPE
- 6.1 Key Strategic Moves
- 6.2 Market Share Analysis
- 6.3 Company Landscape
- 6.4 Company Profiles (includes Global Level Overview, Market Level Overview, Core Business Segments, Financials, Headcount, Key Information, Market Rank, Market Share, Products and Services, and Analysis of Recent Developments).
- 6.4.1 Andermatt Group AG
- 6.4.2 Biolchim SPA
- 6.4.3 Bioworks Inc.
- 6.4.4 Certis USA LLC
- 6.4.5 Corteva Agriscience
- 6.4.6 Indogulf BioAg LLC (Biotech Division of Indogulf Company)
- 6.4.7 Koppert Biological Systems Inc.
- 6.4.8 Lallemand Inc.
- 6.4.9 Marrone Bio Innovations Inc.
- 6.4.10 Seipasa SA
7 KEY STRATEGIC QUESTIONS FOR AGRICULTURAL BIOLOGICALS CEOS
8 APPENDIX
- 8.1 Global Overview
- 8.1.1 Overview
- 8.1.2 Porter's Five Forces Framework
- 8.1.3 Global Value Chain Analysis
- 8.1.4 Market Dynamics (DROs)
- 8.2 Sources & References
- 8.3 List of Tables & Figures
- 8.4 Primary Insights
- 8.5 Data Pack
- 8.6 Glossary of Terms
バイオ殺菌剤:市場シェア分析、産業動向・統計、成長予測(2025年~2030年)
- 発行日
- 発行
- Mordor Intelligence
- ページ情報
- 英文 280 Pages
- 納期
- 2~3営業日


