
|
市場調査レポート
商品コード
1906878
ポリオキシメチレン(POM):市場シェア分析、業界動向と統計、成長予測(2026年~2031年)Polyoxymethylene (POM) - Market Share Analysis, Industry Trends & Statistics, Growth Forecasts (2026 - 2031) |
||||||
カスタマイズ可能
適宜更新あり
|
|||||||
| ポリオキシメチレン(POM):市場シェア分析、業界動向と統計、成長予測(2026年~2031年) |
|
出版日: 2026年01月12日
発行: Mordor Intelligence
ページ情報: 英文 120 Pages
納期: 2~3営業日
|

概要
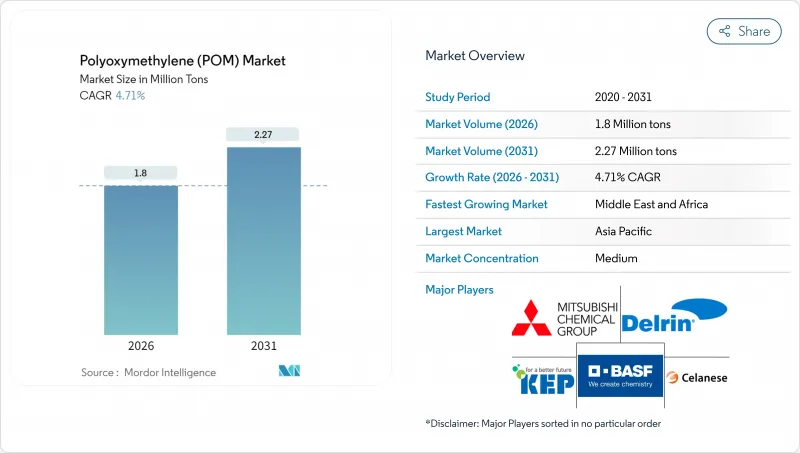
ポリオキシメチレン(POM)市場の規模は、2026年には180万トンに達すると予測されております。
これは2025年の172万トンから増加した数値であり、2031年には227万トンに達すると見込まれております。2026年から2031年にかけての年間平均成長率(CAGR)は4.71%と予測されております。
需要増加の背景には、自動車の軽量化プログラム、電子機器の小型化、精密機械における金属からプラスチックへの移行が挙げられます。欧州連合(EU)、中国、米国における自動車排出ガス規制の強化は、寸法安定性に優れたエンジニアリング樹脂の普及を促進しています。自動車メーカー(OEM)は部品点数の削減とリサイクルの簡素化を目的に単一材料モジュールを設計しており、このアプローチがアセタール共重合体の選択を後押ししています。一方、持続可能性への取り組みにより、メーカーは機械的特性を損なうことなく規制基準を満たす低ホルムアルデヒド含有グレードや再生材含有グレードの開発を推進しています。競合面では、アジアの統合メーカーは自社メタンール供給と下流加工業者への近接性を活用してコスト優位性を強化する一方、欧米のサプライヤーは電気自動車(EV)内装部品や半導体製造装置向け特殊配合製品で差別化を図っています。
世界のポリオキシメチレン(POM)市場の動向と洞察
自動車軽量化の急成長
自動車メーカーは、特に燃料モジュール、ドアラッチ、トランスミッション部品において、構造剛性を維持しながら車両重量を削減するため、アセタール共重合体を指定しています。2024年時点で平均的な自動車には8~10ポンドのPOMが使用されており、この数値は新型バッテリー電気自動車モデルごとに増加しています。EVの熱管理システムは、樹脂の耐クリープ性と化学的不活性性を高め、ボンネット下の熱サイクルに耐える薄肉部品の実現を可能にしています。ウィンドウレギュレーターなどのスライド機構では、POM製ギアを採用することで、寿命にわたる騒音・振動・粗さ(NVH)目標を達成しています。自動車メーカーはまた、ガイドレール、シール、ヒンジピンなどの複数のサブ機能を単一の射出成形モジュールに統合し、重量削減を最大化すると同時に、使用終了時の分解を簡素化しています。2024年の需要の31.05%が自動車関連であることは、次世代モビリティソリューションにおけるこのポリマーの確固たる役割を裏付けています。
電気・電子機器の小型化
スマートフォン、ウェアラブル機器、5Gインフラにおける部品の微細化は、マイクロン単位の公差を維持する寸法安定性プラスチックの需要を加速させています。POMの低吸湿性は湿潤環境下での膨張を防止し、微細ピッチコネクタやマイクロギアの精度を保護します。静電気散逸グレードはチップハンドリング治具における静電気放電リスクを軽減し、高流動性グレードはカメラモジュール向けに0.25mmまでの薄肉成形を可能にします。消費者向けデバイスメーカーは、この樹脂の加工容易性を活用して新たなアクチュエータ設計の試作を迅速化し、市場投入までの時間を短縮しています。数十個の微小可動部品を必要とするIoTノードの急増は、アジア太平洋地域の受託製造拠点においてアセタール共重合体の適用範囲をさらに拡大しております。
バイオベースおよび高性能プラスチックとの競合
持続可能性目標を背景に、OEMメーカーはセルロース強化アセタールや完全バイオ由来ポリアミドの実験を進めております。これらはライフサイクル排出量を二桁パーセント削減します。航空宇宙サプライヤーは、POMの耐熱限界100℃を超える高温部部品において、コスト増を伴いながらもポリエーテルエーテルケトン(PEEK)への代替を検討中です。欧州の消費財市場では、規制当局がカーボンネガティブ(炭素排出量マイナス)の配合をエコ税の軽減で優遇しており、調達判断に影響を与えています。一部の医療機器メーカーは、反復的な蒸気滅菌サイクルに耐える滅菌安定性のある化学物質へ転換しており、精密ポンプ部品におけるPOMのシェアを侵食しています。既存のポリマーはコストパフォーマンスの面で優位性を保っていますが、環境情報開示義務の強化により、環境に優しい代替品が存在する用途での需要が脅かされています。
セグメント分析
シートカテゴリーは2025年に世界消費量の64.78%を占め、自動車ドアモジュール、電子機器筐体、産業用カバーなどでの広範な使用を反映しています。このセグメントは2031年までCAGR5.05%を維持すると予測されています。押出技術の進歩によりシート厚さの公差は±3%まで達成され、二次的な平削り加工を必要とせず複雑な三次元部品への直接加工が可能となりました。コンバーターは、大型パネルの熱成形時に反りを生じにくい均一な結晶形態を高く評価しております。
棒材・管材形態は、使用温度範囲内で寸法ドリフトが0.05mmを超えてはならない歯車、スラストワッシャー、流体処理マニホールドなどの高精度ニッチ市場に対応します。ハイブリッドパワートレイン組立品と工場自動化設備が、緩やかながら着実な成長を牽引しています。「その他」カテゴリー(主に射出成形によるニアネットシェイプ)は、アルミニウムと同等の重量を実現しながらコストを3分の1に抑える設計技術者の注目を集めています。ASTM D6100規格は全形状における公差基準を統一し、世界のOEMメーカーに複数地域からの調達に対する確信を提供します。シートが主流であり続ける一方、積層造形用ペレット原料の普及により、2027年以降は「その他」サブセグメントが徐々に拡大する可能性があります。
ポリオキシメチレン(POM)市場レポートは、形状タイプ(シート、ロッド・チューブ、その他)、エンドユーザー産業(航空宇宙、自動車、電気・電子、産業・機械、その他エンドユーザー産業)、地域(アジア太平洋、北米、欧州、南米、中東・アフリカ)別に分類されています。市場予測は数量(トン)および金額(米ドル)で提供されます。
地域別分析
アジア太平洋地域は、垂直統合型サプライチェーンと中国、インド、東南アジアのOEMメーカーからの需要急増に支えられ、2025年の出荷量の66.70%を占めました。日本のメーカーは精密歯車に好まれる高結晶性コポリマーの供給を継続している一方、韓国のサプライヤーは半導体製造装置向け導電性グレードの普及を推進しています。ホーチミン市やプネ周辺の産業集積地では、市販シートから自動車部品への転換が加速し、地域の自給自足体制が強化されています。
中東・アフリカ地域は2031年までCAGR5.90%と最も急速な拡大軌道を示します。SABICのペトロケミヤのようなメガサイトではメタノール・ホルムアルデヒド・下流ポリマー製造設備を統合し、原料安定性とエネルギー効率を実現しています。アラブ首長国連邦の航空宇宙部品メーカーはアルミニウムからの脱却を図り、湾岸航空会社の機材拡充計画を支援するためPOMを現地調達しています。同地域がアジアと欧州の消費地の中間に位置する利点は輸出業者の輸送コスト削減に寄与しており、紅海航路のボトルネックによりこの効果はさらに増幅されています。
北米と欧州は技術的優位性を維持し、低ホルムアルデヒド含有量や再生材含有型の研究開発パイプラインを育成しています。ミシガン州とバイエルン州の自動車ティア1サプライヤーは樹脂メーカーと協力し、製造工程までのライフサイクル評価を実施。循環型経済との適合性を確保するため、仕様範囲の狭小化を推進しています。南米市場は未成熟ながら、ブラジルの自動車産業回廊における製造投資の恩恵を受けており、アセタール需要は現地の燃料システム生産と連動しています。全体として、アジア太平洋地域はメタノール原料と完成品組立ラインの両方が集中していることから、優位性を維持する態勢にあると考えられます。
その他の特典:
- エクセル形式の市場予測(ME)シート
- アナリストによる3ヶ月間のサポート
よくあるご質問
目次
第1章 イントロダクション
- 調査の前提条件と市場の定義
- 調査範囲
第2章 調査手法
第3章 エグゼクティブサマリー
第4章 市場情勢
- 市場概要
- 市場促進要因
- 自動車軽量化のブーム
- 電気・電子機器分野における小型化
- 産業機械における金属からプラスチックへの移行
- アジア太平洋地域における製造業の拡大
- EV内装向け低VOC POMグレード
- 市場抑制要因
- バイオベースプラスチックおよび高性能プラスチックとの競合
- 原材料価格の変動性と貿易障壁
- メタノールからSAF(持続可能航空燃料)への転用バリューチェーン
- バリューチェーン分析
- 規制情勢
- 輸出入分析
- 価格動向
- ポーターのファイブフォース分析
- 供給企業の交渉力
- 買い手の交渉力
- 代替品の脅威
- 競争企業間の敵対関係
- 新規参入業者の脅威
- 最終用途セクター動向
- 航空宇宙(航空宇宙部品生産収益)
- 自動車(自動車生産台数)
- 建築・建設(新築床面積)
- 電気・電子機器(電気・電子機器生産収益)
- 包装(プラスチック包装量)
第5章 市場規模と成長予測(金額および数量ベース)
- 形態別
- シート
- ロッドおよびチューブ
- その他
- エンドユーザー業界別
- 航空宇宙産業
- 自動車
- 電気・電子機器
- 産業・機械
- その他のエンドユーザー業界
- 地域別
- アジア太平洋地域
- 中国
- 日本
- インド
- 韓国
- オーストラリア
- マレーシア
- その他アジア太平洋地域
- 北米
- カナダ
- メキシコ
- 米国
- 欧州
- ドイツ
- フランス
- イタリア
- 英国
- ロシア
- その他欧州地域
- 南米
- ブラジル
- アルゼンチン
- その他南米
- 中東・アフリカ
- サウジアラビア
- アラブ首長国連邦
- ナイジェリア
- 南アフリカ
- その他の中東・アフリカ
- アジア太平洋地域
第6章 競合情勢
- 市場集中度
- 戦略的動向
- 市場シェア(%)/順位分析
- 企業プロファイル
- Celanese Corporation
- China BlueChemical Ltd.
- Delrin USA, LLC
- Henan Energy and Chemical Group Co., Ltd.
- Kolon BASF innoPOM, Inc.
- Korea Engineering Plastics Co., Ltd.
- LG Chem
- Mitsubishi Chemical Group Corporation
- Polyplastics Co., Ltd.(Daicel Group)
- SABIC
- Yuntianhua Group Co., Ltd.
