
|
市場調査レポート
商品コード
1684073
インドネシアのアンカー・グラウト:市場シェア分析、産業動向、成長予測(2025年~2030年)Indonesia Anchors and Grouts - Market Share Analysis, Industry Trends & Statistics, Growth Forecasts (2025 - 2030) |
||||||
カスタマイズ可能
適宜更新あり
|
|||||||
| インドネシアのアンカー・グラウト:市場シェア分析、産業動向、成長予測(2025年~2030年) |
|
出版日: 2025年03月18日
発行: Mordor Intelligence
ページ情報: 英文 192 Pages
納期: 2~3営業日
|

全表示
- 概要
- 目次
概要
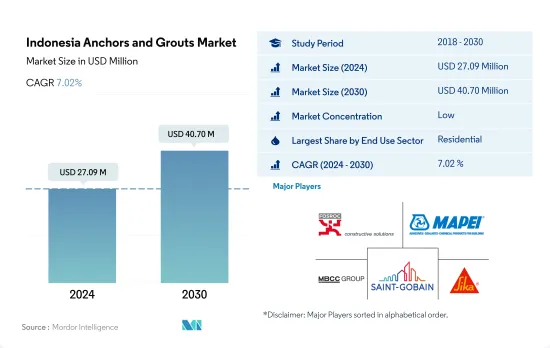
インドネシアのアンカー・グラウト市場規模は2024年に2,709万米ドルと推定され、2030年には4,070万米ドルに達すると予測され、予測期間(2024年~2030年)のCAGRは7.02%で成長すると予測されます。
国民経済における製造業の優位性がアンカー・グラウトの需要を大きく押し上げる
- 2022年、市場は複数のセクターで成長を示し、その値は2021年のそれを2.2%上回りました。2023年には、景気拡大と海外からの投資に牽引され、建設セクターが成長しました。この成長はアンカー・グラウトの需要を促進すると予想されました。例えば、公共事業住宅省は2023年にヌサンタラ市に47棟のマンションを建設する目標を設定し、2022年比で6.8%の需要増が予測されました。
- アンカー・グラウトの主要な消費者は住宅分野であるが、これは主にプレハブ住宅の人気が高まっているためです。様々な種類の中でも、この分野では樹脂固定用アンカー・グラウトが主流で、2022年には57%の数量シェアを占める。
- インドネシア経済において製造業が支配的な役割を果たしており、2022年のGDPに約18.34%寄与していることから、工業施設の建設活動はアンカー・グラウトの大きな市場を形成しています。この動向により、産業・施設セグメントは第2位の消費者となっています。ポリウレタン系よりもエポキシ系のアンカー・グラウトが好まれていることは明らかで、耐薬品性に優れていることから、2022年にはエポキシ系が樹脂固定タイプの需要の32%を占める。
- 都市人口の急増、1人当たり所得の低さ、手頃な労働力、中間層の急増、比較的低い土地コストなどの要因に後押しされ、製造、教育、ヘルスケアなどの施設建設が顕著に増加しています。この動向は投資家を惹きつけています。特に、産業・施設セクターは予測期間中(2023年~2030年)に8.82%と最も高いCAGRで推移すると予測されています。
インドネシアのアンカー・グラウト市場動向
インドネシアの商業用不動産市場規模は2028年までに1兆3,900億米ドルに達すると予測され、商業セクターの需要が拡大する可能性が高い
- 2022年、インドネシアの新規商業床面積は前年比9.7%減少しました。この落ち込みは、COVID-19パンデミック時の建築活動の落ち込みから平常に戻った結果です。パンデミック以前から、インドネシアの商業ビルの年間エネルギー原単位は低下傾向を示しており、その割合は年率2.64%でした。しかし、2023年には回復が見られ、新しいオフィス、倉庫、小売スペースを必要とする外国直接投資(FDI)の急増が原動力となって、新しい商業床面積が5.7%増加しました。
- COVID-19が大流行する中、2020年と2021年にインドネシアは、約960万平方フィートを占める新規商業床面積の大幅な急増を示しました。政府が経済活性化に注力した結果、民間・公共プロジェクトともに建設関連の検疫が緩和されるなどの措置がとられました。これにより、従業員は現場での仕事を再開し、企業は事業を継続できるようになりました。特筆すべきは、インドネシアの完成工事高が2020年には約1兆3,200億IDRに達し、2021年には1兆4,200億IDRに増加することです。
- インドネシアの新規商業床面積は、2023年比で2030年までに約58.72%の大幅な伸びが予測されています。この急増は、ショッピングモール、オフィス、その他の商業スペースに対する需要の高まりによるものです。小売不動産セグメントは、同国で特に魅惑的なセクターとして浮上しています。例えば、商業用不動産市場の規模は、2028年までに1兆3,900億米ドルに達すると予想されています。インドネシアの商業用新設床面積は、予測期間中にCAGR 6.82%を記録し、安定した成長を維持すると予想されます。
住宅需要の増加が住宅セクターの成長を促進する可能性が高い
- 2022年、インドネシアの住宅新設床面積は2021年比で7.10%の伸びを示しました。この急増は、人口増加、富裕化、都市化に起因しています。政府主導の住宅支援は2022年に29兆インドルピーに達し、住宅融資流動性ファシリティ・スキームの下、2023年には32兆インドルピーに増加すると予測されました。このイニシアチブは、少なくとも22万戸の住宅建設を目指しています。住宅建設セクターは著しい成長を遂げる見込みです。2023年には前年比で約5,600万平方フィートに増加すると推定されます。
- 2020年、インドネシアの住宅新築床面積は2019年比で7.06%増加しました。これは政府による戦略的な動きで、景気後退を緩和し、収入減に悩む家計を支援するために建設を優先させました。その結果、検疫を含む建設活動の制限が大幅に緩和されました。しかし、2021年には動向が逆転し、住宅着工床面積は約12.54%減少しました。これは主に、建設部門への外国直接投資(FDI)の落ち込みが原因です。2021年の建設へのFDIは前年比51%減となりました。
- インドネシアの住宅新設床面積は、予測期間中、数量ベースでCAGR 6.08%の成長が見込まれます。この成長は、政府のイニシアティブと国内外の投資によって後押しされた、同国の都市化の進展に起因します。これらの要因は、直接的・間接的に、同国における住宅ニーズの高まりを強調し、最終的に住宅建設を促進します。急増する需要を満たすには、2030年までに年間82万戸から100万戸の住宅が必要になると予測されています。
インドネシアのアンカー・グラウト産業の概要
インドネシアのアンカー・グラウト市場は細分化されており、上位5社で34.76%を占めています。この市場の主要企業は以下の通り。 Fosroc, Inc., MAPEI S.p.A., MBCC Group, Saint-Gobain and Sika AG.
その他の特典
- エクセル形式の市場予測(ME)シート
- 3ヶ月のアナリストサポート
目次
第1章 エグゼクティブサマリーと主な調査結果
第2章 レポートのオファー
第3章 イントロダクション
- 調査の前提条件と市場定義
- 調査範囲
- 調査手法
第4章 主要産業動向
- 最終用途分野の動向
- 商業
- 産業・施設
- インフラ
- 住宅
- 主要インフラプロジェクト(現在および発表済み)
- 規制の枠組み
- バリューチェーンと流通チャネル分析
第5章 市場セグメンテーション
- 最終用途セクター
- 商業
- 産業・施設
- インフラ
- 住宅
- サブ製品
- セメント系固定材
- 樹脂固定
- 技術別
- エポキシグラウト
- ポリウレタン(PU)グラウト
- その他のタイプ
第6章 競合情勢
- 主要な戦略動向
- 市場シェア分析
- 企業情勢
- 企業プロファイル
- Arkema
- Deltacretindo
- Fosroc, Inc.
- LATICRETE International, Inc.
- MAPEI S.p.A.
- MBCC Group
- Normet
- Saint-Gobain
- Sika AG
- Ultrachem Construction Chemicals
第7章 CEOへの主な戦略的質問CEOへの主な戦略的質問
第8章 付録
- 世界概要
- 概要
- ファイブフォース分析フレームワーク(産業魅力度分析)
- 世界・バリューチェーン分析
- 市場力学(DROs)
- 情報源と参考文献
- 図表一覧
- 主要洞察
- データパック
- 用語集
目次
Product Code: 50002026
The Indonesia Anchors and Grouts Market size is estimated at 27.09 million USD in 2024, and is expected to reach 40.70 million USD by 2030, growing at a CAGR of 7.02% during the forecast period (2024-2030).
The manufacturing sector's domination in the national economy provides a significant boost in the demand for anchors and grouts
- In 2022, the market witnessed growth across multiple sectors, with its value surpassing that of 2021 by 2.2%. The construction sector grew in 2023, driven by economic expansion and foreign investments. This growth was expected to fuel the demand for anchors and grouts. For instance, the Ministry for Public Works and Housing set a target of constructing 47 apartment towers in Nusantara City in 2023, indicating a projected demand increase of 6.8% over 2022.
- The residential segment is the primary consumer of anchors and grouts in the country, largely due to the rising popularity of prefabricated houses, which necessitate substantial usage of anchors and grouts for installation. Among the various types, the sector predominantly favors resin fixing anchors and grouts, accounting for a significant 57% volume share in 2022.
- Given the manufacturing sector's dominant role in Indonesia's economy, contributing approximately 18.34% to the GDP in 2022, the construction activities in industrial facilities create a sizable market for anchors and grouts. This trend makes the industrial and institutional segment the second-largest consumer. The preference for epoxy-based anchors and grouts over polyurethane-based ones is evident, with epoxy variants representing 32% of the resin fixing type demand in 2022, owing to their superior chemical resistance.
- Driven by factors like a surging urban population, low per capita income, affordable labor, a burgeoning middle class, and relatively lower land costs, there is a notable uptick in the construction of facilities, including manufacturing, education, and healthcare. This trend is attracting investors. Notably, the industrial and institutional sector is projected to witness the highest CAGR of 8.82% during the forecast period (2023-2030).
Indonesia Anchors and Grouts Market Trends
Indonesian commercial real estate market volume is projected to reach USD 1.39 trillion by 2028 and is likely to augment the demand for commercial sector
- In 2022, Indonesia witnessed a 9.7% decline in the volume of new commercial floor area compared to the previous year. This drop was a result of a return to normalcy following a decline in building activities during the COVID-19 pandemic. Even before the pandemic, commercial buildings in Indonesia were already showing a downward trend in annual energy intensity, accounting for a rate of 2.64% per year. However, in 2023, the country saw a rebound, registering a 5.7% increase in the volume of new commercial floor area, driven by a surge in foreign direct investment (FDI) necessitating new offices, warehouses, and retail spaces.
- Amidst the COVID-19 pandemic, in 2020 and 2021, Indonesia witnessed a significant surge in the volume of new commercial floor area, accounting for approximately 9.6 million square feet. The government's focus on revitalizing the economy led to measures such as easing construction-related quarantines, both in private and public projects. This allowed employees to resume work on-site and companies to continue their operations. Notably, the value of completed constructions in Indonesia stood at around IDR 1.32 quadrillion in 2020 and rose to IDR 1.42 quadrillion in 2021.
- The volume of new commercial floor area in Indonesia is projected to witness a robust growth of around 58.72% by 2030 compared to 2023. This surge is driven by a rising demand for shopping malls, offices, and other commercial spaces. The retail real estate segment is emerging as a particularly captivating sector in the country. For instance, the volume of the commercial real estate market is anticipated to reach USD 1.39 trillion by 2028. The commercial new floor area in Indonesia is expected to maintain steady growth, registering a CAGR of 6.82% during the forecast period.
Increase in demand for housing units is likely to augment the residential sector's growth
- In 2022, Indonesia witnessed a 7.10% volume growth in residential new floor area compared to 2021. This surge can be attributed to increased population, wealth, and urbanization. The government-led housing aid reached IDR 29 trillion in 2022, which was projected to increase to IDR 32 trillion in 2023 under the Housing Financing Liquidity Facility scheme. This initiative aims to construct at least 220 thousand houses. The residential construction sector is poised to witness a significant growth rate. It was estimated to increase to approximately 56 million square feet in 2023 compared to the preceding year.
- In 2020, the volume of residential new floor areas in Indonesia grew by 7.06% compared to 2019. This was a strategic move by the government, prioritizing construction to mitigate the economic downturn and support households grappling with reduced incomes. Consequently, restrictions on construction activities, including quarantines, were significantly eased. However, in 2021, the trend reversed, with a decline of about 12.54% in residential new floor area, primarily attributed to a dip in foreign direct investment (FDI) in the construction sector. FDI for construction plummeted by 51% in 2021 compared to the previous year.
- The residential new floor area in Indonesia is projected to witness a CAGR of 6.08% in volume during the forecast period. This growth stems from the country's increasing urbanization, bolstered by government initiatives and foreign and domestic investments. These factors, directly and indirectly, underscore the mounting housing needs in the nation, ultimately driving residential building construction. Projections indicate that to meet the escalating demand, the country would require between 820,000 and 1 million housing units annually by 2030.
Indonesia Anchors and Grouts Industry Overview
The Indonesia Anchors and Grouts Market is fragmented, with the top five companies occupying 34.76%. The major players in this market are Fosroc, Inc., MAPEI S.p.A., MBCC Group, Saint-Gobain and Sika AG (sorted alphabetically).
Additional Benefits:
- The market estimate (ME) sheet in Excel format
- 3 months of analyst support
TABLE OF CONTENTS
1 EXECUTIVE SUMMARY & KEY FINDINGS
2 REPORT OFFERS
3 INTRODUCTION
- 3.1 Study Assumptions & Market Definition
- 3.2 Scope of the Study
- 3.3 Research Methodology
4 KEY INDUSTRY TRENDS
- 4.1 End Use Sector Trends
- 4.1.1 Commercial
- 4.1.2 Industrial and Institutional
- 4.1.3 Infrastructure
- 4.1.4 Residential
- 4.2 Major Infrastructure Projects (current And Announced)
- 4.3 Regulatory Framework
- 4.4 Value Chain & Distribution Channel Analysis
5 MARKET SEGMENTATION (includes market size, forecasts up to 2030 and analysis of growth prospects.)
- 5.1 End Use Sector
- 5.1.1 Commercial
- 5.1.2 Industrial and Institutional
- 5.1.3 Infrastructure
- 5.1.4 Residential
- 5.2 Sub Product
- 5.2.1 Cementitious Fixing
- 5.2.2 Resin Fixing
- 5.2.2.1 By Technology
- 5.2.2.1.1 Epoxy Grout
- 5.2.2.1.2 Polyurethane (PU) Grout
- 5.2.3 Other Types
6 COMPETITIVE LANDSCAPE
- 6.1 Key Strategic Moves
- 6.2 Market Share Analysis
- 6.3 Company Landscape
- 6.4 Company Profiles
- 6.4.1 Arkema
- 6.4.2 Deltacretindo
- 6.4.3 Fosroc, Inc.
- 6.4.4 LATICRETE International, Inc.
- 6.4.5 MAPEI S.p.A.
- 6.4.6 MBCC Group
- 6.4.7 Normet
- 6.4.8 Saint-Gobain
- 6.4.9 Sika AG
- 6.4.10 Ultrachem Construction Chemicals
7 KEY STRATEGIC QUESTIONS FOR CONCRETE, MORTARS AND CONSTRUCTION CHEMICALS CEOS
8 APPENDIX
- 8.1 Global Overview
- 8.1.1 Overview
- 8.1.2 Porter's Five Forces Framework (Industry Attractiveness Analysis)
- 8.1.3 Global Value Chain Analysis
- 8.1.4 Market Dynamics (DROs)
- 8.2 Sources & References
- 8.3 List of Tables & Figures
- 8.4 Primary Insights
- 8.5 Data Pack
- 8.6 Glossary of Terms

