
|
市場調査レポート
商品コード
1684064
エポキシグラウト:市場シェア分析、産業動向と統計、成長予測(2025年~2030年)Epoxy Grout - Market Share Analysis, Industry Trends & Statistics, Growth Forecasts (2025 - 2030) |
||||||
カスタマイズ可能
適宜更新あり
|
|||||||
| エポキシグラウト:市場シェア分析、産業動向と統計、成長予測(2025年~2030年) |
|
出版日: 2025年03月18日
発行: Mordor Intelligence
ページ情報: 英文 295 Pages
納期: 2~3営業日
|

全表示
- 概要
- 目次
概要
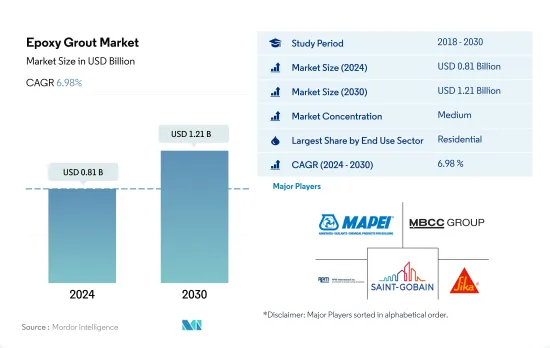
エポキシグラウト市場規模は2024年に8億1,000万米ドルと推定され、2030年には12億1,000万米ドルに達すると予測され、予測期間(2024年~2030年)のCAGRは6.98%で成長します。
手頃な価格の住宅需要の増加がエポキシ系グラウト市場を牽引する見込み
- 2022年のエポキシ系グラウトの世界消費量は金額ベースで2.49%増となり、住宅およびインフラ建設セクターからの需要増が牽引しました。エポキシ系グラウトは、2023年には世界のアンカー・グラウト市場の約40.78%を占めると予測されました。
- 2023年には、住宅部門がエポキシグラウトの世界最大の消費者になると推定されました。都市化、政府の取り組み、国内外からの投資といった要因が、世界的に住宅へのニーズを煽っています。2030年までに、インドでは人口の40%以上が都市部に居住するようになると推定され、約2,500万戸の手頃な価格の住宅需要が見込まれます。その結果、住宅セクターにおけるエポキシ系グラウトの消費量は、2023年から2030年にかけて1億3,500万米ドル増加すると予測されています。
- 世界市場の工業・施設セクターは、予測期間(2023年~2030年)中、エポキシグラウトの消費量において7.75%という最高のCAGRを示すと予測されています。米国では2026年までに650億米ドルの支出が予測されているように、新しい産業用建物への投資がこの成長を促進しています。さらに、世界の工業用床面積は2030年に3.09%増加すると予想されているが、これは主に倉庫ニーズの高まりによるものです。例えば、インドの倉庫スペースは2030年までに5億平方フィートに達すると予想されています。その結果、工業・施設セクターのエポキシグラウトの世界消費量は、2023年の1億4,700万米ドルから2030年には2億4,900万米ドルに達すると推定されます。
中国やインドなどの巨大な成長市場のおかげで、アジア太平洋は世界のエポキシグラウト市場を独占する可能性があります。
- 2022年、エポキシ系グラウトの世界需要は前年比1,740万米ドル増となりました。この上昇は、他のグラウトタイプよりも、汚れ、水、化学薬品に対する耐性が優れているため、好まれるようになっていることに起因しています。欧州が最も顕著な急増を示し、エポキシ系グラウトの需要は2021年と比較して2022年には1,250万米ドル上昇しました。同市場の商業部門は、2023年にエポキシグラウトの需要をさらに1,000万米ドル急増させると予測されました。
- 中国が主導するアジア太平洋が世界のエポキシグラウト市場を独占し、2022年の需要の31%を占める。日本とインドも極めて重要な役割を果たし、同年の地域需要の18%に寄与しました。特に日本は、2023年から2030年までのCAGRが8.4%で、需要が最も伸びると予測されています。
- 欧州は世界第2位のエポキシグラウト消費国です。ドイツ、フランス、英国が主要なプレーヤーとして台頭し、2022年には合計で地域需要の40%のシェアを占める。欧州では、住宅と商業部門がグラウト需要の60%以上を牽引しています。イタリアはこの地域で最も急速な成長を示すことになり、予測期間中のCAGRは6.23%と予測されています。
- 日本、中国、韓国、インドといった国々は、アジア太平洋におけるエポキシ系グラウトの需要において最も高い成長率を示すと予想されています。その結果、アジア太平洋の需要が最も急増し、予測期間中の金額ベースのCAGRは8.35%になると予測されています。
世界のエポキシグラウト市場動向
アジア太平洋の大規模オフィスビル建設プロジェクトの急増により、世界の商業建築専用床面積が増加
- 2022年、世界の商業建築用新設床面積は前年比0.15%の小幅な成長となりました。欧州は12.70%の大幅な伸びで際立っており、これは2030年の二酸化炭素排出目標に合わせてエネルギー効率の高いオフィスビルを推進する動きが原動力となっています。従業員のオフィス復帰に伴い、欧州企業はリース契約を再開し、2022年には450万平方フィートの新規オフィス建設に拍車をかけた。この勢いは2023年も続き、世界の成長率は4.26%と予測されています。
- COVID-19の流行は労働力と資材の不足を引き起こし、商業施設の建設プロジェクトのキャンセルと遅延を招いた。しかし、閉鎖が緩和され、建設活動が再開されるにつれて、2021年の世界の商業施設の新設床面積は11.11%急増し、アジア太平洋が20.98%の成長率でリードしました。
- 今後、世界の商業施設の新設床面積のCAGRは4.56%となります。アジア太平洋のCAGRは5.16%と予測され、他地域を凌駕すると予想されます。この成長の原動力となっているのは、中国、インド、韓国、日本における商業施設建設プロジェクトの活発化です。特に、北京、上海、香港、台北といった中国の主要都市では、Aグレードのオフィススペース建設が加速しています。さらに、インドでは2023年から2025年にかけて、上位7都市で約2,325万平方フィートに及ぶ約60のショッピングモールがオープンする予定です。アジア太平洋全域のこうした取り組みを合計すると、2030年までに商業施設の新規床面積は2022年比で15億6,000万平方フィート増加すると予想されます。
世界の住宅セクターを後押しする手頃な価格の住宅計画への政府投資の増加により、南米の住宅建設が最も急成長すると推定されます。
- 2022年、世界の住宅建築の新規床面積は2021年比で約2億8,900万平方フィート減少しました。これは、土地不足、労働力不足、建設資材価格の持続不可能な高騰が原因で発生した住宅危機に起因します。この危機はアジア太平洋に深刻な影響を与え、2022年の新設床面積は2021年比で5.39%減少しました。しかし2023年には、2030年までに30億人を収容できる手頃な価格の住宅を新たに建設するための資金を調達できる政府投資により、世界の新設床面積は2022年比で3.31%増加すると予測され、より明るい見通しが期待されます。
- COVID-19の流行は景気減速を引き起こし、そのため多くの住宅建設プロジェクトが中止または延期され、2020年の世界の新設床面積は2019年に比べて4.79%減少しました。2021年に規制が解除され、住宅プロジェクトに対する鬱積した需要が解放されると、新設床面積は2020年比で11.22%増加し、欧州が18.28%と最も高い伸びを示し、次いで南米が2021年に2020年比で17.36%増加しました。
- 世界の住宅用新設床面積は予測期間中にCAGR 3.81%を記録し、南米が最も速いCAGR 4.05%で発展すると予測されます。2023年に発表されたブラジルのMinha Casa Minha Vidaのような制度やイニシアチブは、いくつかの規制変更とともに発表され、政府は低所得世帯に手頃な価格の住宅を提供するために19億8,000万米ドルの投資を計画しており、同じく2023年に発表されたチリのFOGAESのような制度やイニシアチブは、手頃な価格の住宅のために家族に住宅ローンを提供することを目的としており、新しい住宅ユニットの建設を促進します。
エポキシグラウト産業の概要
エポキシグラウト市場は適度に統合されており、上位5社で51.94%を占めています。この市場の主要企業は以下の通りです。 MAPEI S.p.A., MBCC Group, RPM International Inc., Saint-Gobain and Sika AG(sorted alphabetically).
その他の特典
- エクセル形式の市場予測(ME)シート
- 3ヶ月のアナリストサポート
目次
第1章 エグゼクティブサマリーと主な調査結果
第2章 レポートのオファー
第3章 イントロダクション
- 調査の前提条件と市場定義
- 調査範囲
- 調査手法
第4章 主要産業動向
- 最終用途分野の動向
- 商業
- 産業・施設
- インフラ
- 住宅
- 主要インフラプロジェクト(現在および発表済み)
- 規制の枠組み
- バリューチェーンと流通チャネル分析
第5章 市場セグメンテーション
- 最終用途セクター
- 商業
- 産業・施設
- インフラ
- 住宅
- 地域
- アジア太平洋
- 国別
- オーストラリア
- 中国
- インド
- インドネシア
- 日本
- マレーシア
- 韓国
- タイ
- ベトナム
- その他のアジア太平洋
- 欧州
- 国別
- フランス
- ドイツ
- イタリア
- ロシア
- スペイン
- 英国
- その他の欧州
- 中東・アフリカ
- 国別
- サウジアラビア
- アラブ首長国連邦
- その他の中東・アフリカ
- 北米
- 国別
- カナダ
- メキシコ
- 米国
- 南米
- 国別
- アルゼンチン
- ブラジル
- その他の南米
- アジア太平洋
第6章 競合情勢
- 主要な戦略動向
- 市場シェア分析
- 企業情勢
- 企業プロファイル
- Ardex Group
- Arkema
- Don Construction Products Ltd.
- Five Star Products, Inc.
- LATICRETE International, Inc.
- MAPEI S.p.A.
- MBCC Group
- RPM International Inc.
- Saint-Gobain
- Sika AG
第7章 CEOへの主な戦略的質問CEOへの主な戦略的質問
第8章 付録
- 世界概要
- 概要
- ファイブフォース分析フレームワーク(産業魅力度分析)
- 世界・バリューチェーン分析
- 市場力学(DROs)
- 情報源と参考文献
- 図表一覧
- 主要洞察
- データパック
- 用語集
目次
Product Code: 50002017
The Epoxy Grout Market size is estimated at 0.81 billion USD in 2024, and is expected to reach 1.21 billion USD by 2030, growing at a CAGR of 6.98% during the forecast period (2024-2030).
A rise in demand for affordable housing units is expected to drive the epoxy grout market
- The global consumption of epoxy grouts saw a 2.49% growth in terms of value in 2022, driven by rising demand from the residential and infrastructure construction sectors. Epoxy grouts were projected to make up approximately 40.78% of the global anchors and grouts market in 2023.
- In 2023, the residential sector was estimated to be the largest consumer of epoxy grouts globally. Factors such as urbanization, government initiatives, and investments, both domestic and foreign, are fueling the need for housing worldwide. By 2030, it is estimated that over 40% of India's population will reside in urban areas, leading to a demand for around 25 million affordable housing units. As a result, the consumption of epoxy grouts in the residential sector is projected to rise by USD 135 million from 2023 to 2030.
- The industrial and institutional sector of the global market is anticipated to exhibit the highest CAGR of 7.75% in terms of the consumption of epoxy grouts during the forecast period (2023-2030). Investments in new industrial buildings, like the projected USD 65 billion spending in the United States by 2026, are driving this growth. Additionally, the global industrial floor area is expected to rise by 3.09% in 2030, largely due to an uptick in warehousing needs. For instance, India's warehousing space is anticipated to reach 500 million sq. ft by 2030. As a result, the global consumption of epoxy grouts from the industrial and institutional sector is estimated to reach USD 249 million in 2030, up from USD 147 million in 2023.
Owing to its huge and growing markets, such as China and India, Asia-Pacific may dominate the global epoxy grout market
- In 2022, the global demand for epoxy grouts witnessed a USD 17.4 million surge compared to the previous year. This uptick can be attributed to their growing preference over other grout types, owing to their superior resistance to stains, water, and chemicals. Europe saw the most significant surge, with the demand for epoxy grouts rising by USD 12.5 million in 2022 compared to 2021. The commercial sector of the market was projected to drive an additional USD 10 million surge in demand for epoxy grouts in 2023.
- Asia-Pacific, led by China, dominates the global epoxy grout market, accounting for 31% of the demand in 2022. Japan and India also played pivotal roles, collectively contributing to 18% of the regional demand in the same year. Notably, Japan is projected to witness the highest growth in demand, with a CAGR of 8.4% from 2023 to 2030.
- Europe stands as the second-largest consumer of epoxy grouts globally. Germany, France, and the United Kingdom emerged as key players, collectively representing a 40% share of the regional demand in 2022. In Europe, the residential and commercial sectors drive over 60% of the grout demand. Italy is set to witness the most rapid growth in the region, with a projected CAGR of 6.23% during the forecast period.
- Countries like Japan, China, South Korea, and India are expected to witness the highest growth rates in terms of the demand for epoxy grouts in Asia-Pacific. As a result, Asia-Pacific is projected to experience the swiftest surge in demand, with a CAGR of 8.35% in terms of value during the forecast period.
Global Epoxy Grout Market Trends
Asia-Pacific's surge in large-scale office building projects is set to elevate the global floor area dedicated to commercial construction
- In 2022, the global new floor area for commercial construction witnessed a modest growth of 0.15% from the previous year. Europe stood out with a significant surge of 12.70%, driven by a push for high-energy-efficient office buildings to align with its 2030 carbon emission targets. As employees returned to offices, European companies, resuming lease decisions, spurred the construction of 4.5 million square feet of new office space in 2022. This momentum is poised to persist in 2023, with a projected global growth rate of 4.26%.
- The COVID-19 pandemic caused labor and material shortages, leading to cancellations and delays in commercial construction projects. However, as lockdowns eased and construction activities resumed, the global new floor area for commercial construction surged by 11.11% in 2021, with Asia-Pacific taking the lead with a growth rate of 20.98%.
- Looking ahead, the global new floor area for commercial construction is set to achieve a CAGR of 4.56%. Asia-Pacific is anticipated to outpace other regions, with a projected CAGR of 5.16%. This growth is fueled by a flurry of commercial construction projects in China, India, South Korea, and Japan. Notably, major Chinese cities like Beijing, Shanghai, Hong Kong, and Taipei are gearing up for an uptick in Grade A office space construction. Additionally, India is set to witness the opening of approximately 60 shopping malls, spanning 23.25 million square feet, in its top seven cities between 2023 and 2025. Collectively, these endeavors across Asia-Pacific are expected to add a staggering 1.56 billion square feet to the new floor area for commercial construction by 2030, compared to 2022.
South America's estimated fastest growth in residential constructions due to increasing government investments in schemes for affordable housing to boost the global residential sector
- In 2022, the global new floor area for residential construction declined by around 289 million square feet compared to 2021. This can be attributed to the housing crisis generated due to the shortage of land, labor, and unsustainably high construction materials prices. This crisis severely impacted Asia-Pacific, where the new floor area declined 5.39% in 2022 compared to 2021. However, a more positive outlook is expected in 2023 as the global new floor area is predicted to grow by 3.31% compared to 2022, owing to government investments that can finance the construction of new affordable homes capable of accommodating 3 billion people by 2030.
- The COVID-19 pandemic caused an economic slowdown, due to which many residential construction projects got canceled or delayed, and the global new floor area declined by 4.79% in 2020 compared to 2019. As the restrictions were lifted in 2021 and pent-up demand for housing projects was released, new floor area grew 11.22% compared to 2020, with Europe having the highest growth of 18.28%, followed by South America, which rose 17.36% in 2021 compared to 2020.
- The global new floor area for residential construction is expected to register a CAGR of 3.81% during the forecast period, with South America predicted to develop at the fastest CAGR of 4.05%. Schemes and initiatives like the Minha Casa Minha Vida in Brazil announced in 2023 with a few regulatory changes, for which the government plans an investment of USD 1.98 billion to provide affordable housing units for low-income families, and the FOGAES in Chile also publicized in 2023, with an initial investment of USD 50 million, are aimed at providing mortgage loans to families for affordable housing and will encourage the construction of new residential units.
Epoxy Grout Industry Overview
The Epoxy Grout Market is moderately consolidated, with the top five companies occupying 51.94%. The major players in this market are MAPEI S.p.A., MBCC Group, RPM International Inc., Saint-Gobain and Sika AG (sorted alphabetically).
Additional Benefits:
- The market estimate (ME) sheet in Excel format
- 3 months of analyst support
TABLE OF CONTENTS
1 EXECUTIVE SUMMARY & KEY FINDINGS
2 REPORT OFFERS
3 INTRODUCTION
- 3.1 Study Assumptions & Market Definition
- 3.2 Scope of the Study
- 3.3 Research Methodology
4 KEY INDUSTRY TRENDS
- 4.1 End Use Sector Trends
- 4.1.1 Commercial
- 4.1.2 Industrial and Institutional
- 4.1.3 Infrastructure
- 4.1.4 Residential
- 4.2 Major Infrastructure Projects (current And Announced)
- 4.3 Regulatory Framework
- 4.4 Value Chain & Distribution Channel Analysis
5 MARKET SEGMENTATION (includes market size, forecasts up to 2030 and analysis of growth prospects.)
- 5.1 End Use Sector
- 5.1.1 Commercial
- 5.1.2 Industrial and Institutional
- 5.1.3 Infrastructure
- 5.1.4 Residential
- 5.2 Region
- 5.2.1 Asia-Pacific
- 5.2.1.1 By Country
- 5.2.1.1.1 Australia
- 5.2.1.1.2 China
- 5.2.1.1.3 India
- 5.2.1.1.4 Indonesia
- 5.2.1.1.5 Japan
- 5.2.1.1.6 Malaysia
- 5.2.1.1.7 South Korea
- 5.2.1.1.8 Thailand
- 5.2.1.1.9 Vietnam
- 5.2.1.1.10 Rest of Asia-Pacific
- 5.2.2 Europe
- 5.2.2.1 By Country
- 5.2.2.1.1 France
- 5.2.2.1.2 Germany
- 5.2.2.1.3 Italy
- 5.2.2.1.4 Russia
- 5.2.2.1.5 Spain
- 5.2.2.1.6 United Kingdom
- 5.2.2.1.7 Rest of Europe
- 5.2.3 Middle East and Africa
- 5.2.3.1 By Country
- 5.2.3.1.1 Saudi Arabia
- 5.2.3.1.2 United Arab Emirates
- 5.2.3.1.3 Rest of Middle East and Africa
- 5.2.4 North America
- 5.2.4.1 By Country
- 5.2.4.1.1 Canada
- 5.2.4.1.2 Mexico
- 5.2.4.1.3 United States
- 5.2.5 South America
- 5.2.5.1 By Country
- 5.2.5.1.1 Argentina
- 5.2.5.1.2 Brazil
- 5.2.5.1.3 Rest of South America
- 5.2.1 Asia-Pacific
6 COMPETITIVE LANDSCAPE
- 6.1 Key Strategic Moves
- 6.2 Market Share Analysis
- 6.3 Company Landscape
- 6.4 Company Profiles
- 6.4.1 Ardex Group
- 6.4.2 Arkema
- 6.4.3 Don Construction Products Ltd.
- 6.4.4 Five Star Products, Inc.
- 6.4.5 LATICRETE International, Inc.
- 6.4.6 MAPEI S.p.A.
- 6.4.7 MBCC Group
- 6.4.8 RPM International Inc.
- 6.4.9 Saint-Gobain
- 6.4.10 Sika AG
7 KEY STRATEGIC QUESTIONS FOR CONCRETE, MORTARS AND CONSTRUCTION CHEMICALS CEOS
8 APPENDIX
- 8.1 Global Overview
- 8.1.1 Overview
- 8.1.2 Porter's Five Forces Framework (Industry Attractiveness Analysis)
- 8.1.3 Global Value Chain Analysis
- 8.1.4 Market Dynamics (DROs)
- 8.2 Sources & References
- 8.3 List of Tables & Figures
- 8.4 Primary Insights
- 8.5 Data Pack
- 8.6 Glossary of Terms

