
ガム-市場シェア分析、産業動向・統計、成長予測(2025年~2030年)
Gums - Market Share Analysis, Industry Trends & Statistics, Growth Forecasts (2025 - 2030)
- 発行日
- ページ情報
- 英文 314 Pages
- 納期
- 2~3営業日
- 商品コード
- 1684018
- カスタマイズ可能 お客様のご希望に応じて、既存データの加工や未掲載情報(例:国別セグメント)の追加などの対応が可能です。詳細はお問い合わせください。
- 適宜更新あり 本レポートは最新情報反映のため適宜更新し、内容構成変更を行う場合があります。ご検討の際はお問い合わせください。
- 翻訳ツール提供対象 PDF対応AI翻訳ツールの無料貸し出しサービスのご利用が可能です
概要
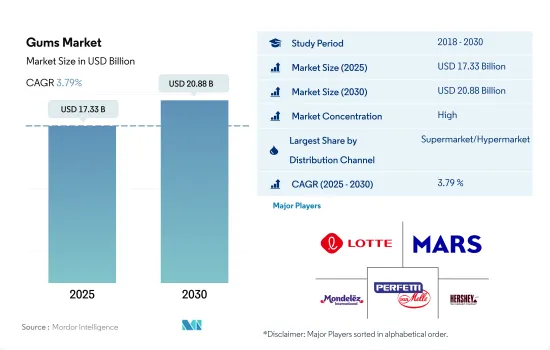
2025年のガム市場規模は173億3,000万米ドルと推計され、2030年には208億8,000万米ドルに達すると予測され、予測期間中(2025年~2030年)のCAGRは3.79%で成長します。
コンビニエンス・ショッピング施設がスーパーマーケット/ハイパーマーケットとコンビニエンス・ストアを通じたガム売上を牽引し、2023年の金額シェアはほぼ75%でした。
- 世界全体では、小売部門全体は2020年と比較して2023年には金額ベースで13.02%の成長を維持しました。この成長は、市場における消費者のコンビニエンス・ショッピング施設に対する志向の高まりによって予想されます。対面式ショッピングへの関心の高まりや、割引特典に対する需要などが、小売業界を大きく牽引する可能性が高いです。
- スーパーマーケットとハイパーマーケットは、世界的に最も大きく、最も支配的なセグメントであることが観察されました。2022年現在、このセグメントは金額ベースで41.91%のシェアを占めており、多国籍ブランドの市場ネットワークの普及が成長を促進しています。2022年現在、世界最大のスーパーマーケット・チェーンはリドルで11,200店舗、次いでアルディ・スッドで7,200店舗、ペニー・マーケットで3,600店舗となっています。コンビニエンスストアは2022年に金額ベースで33.41%と2番目に高いシェアを占め、その売上は主に、課金キオスクの近くにあるバブルガムやチューインガムといった商品のポジショニングによって支持されています。
- オンライン小売チャネルは最も急成長している流通チャネルであり、世界のインターネット普及率の上昇、スマートフォン利用の増加、食料品宅配チェーンの増加・拡大ネットワークによって加速され、予測期間中に金額ベースで4.23%のCAGRで推移すると予想されます。オンラインストアでは、消費者はプライベートブランドや主流ブランドのもとで販売されている豊富な商品群から好きなものを選ぶことができます。スマートフォンユーザーの増加と主要地域におけるインターネットの普及は、予測期間中に菓子類のオンライン販売を促進すると予想されます。2023年4月現在、世界のインターネット・ユーザーは51億8,000万人で、世界人口の64.6%に相当します。
北米の原材料価格変動はアジア太平洋よりも20%高く、調査期間を通じて北米が金額で市場をリードしました。
- 数量ベースでは、アジア太平洋が2023年に大きなシェアを占めました。金額では北米が最も高いシェアを占めたが、これは北米のガム価格が高いためです。ガムは同地域、特に中国、日本、韓国で広く消費されている菓子類です。日本では、チューインガムが2022年のガム市場全体で数量ベースで89.66%のシェアを占めています。学生や社会人などフォーマルな場での消費者は、集中力を高めるために脳を刺激するために噛むことを好みます。
- 北米では、ガムの成長は、チューインガム消費の健康上の利点に関する意識の高まりと関連しています。2023年現在、アメリカ人の約50%がガムを噛んでいます。その結果、この地域ではチューインガムとバブルガムの需要が大幅に増加しています。チューインガムもバブルガムも、砂糖をベースにしたものや砂糖不使用のものなど、さまざまな形態で販売されています。したがって、北米のガム市場は2021年と比較して2022年には金額で8.63%の成長を観察しました。
- 中東は予測期間中、金額ベースでCAGR 6.49%の急成長を記録すると予想されます。同市場の成長は、同地域における無糖ガムの需要に起因しています。この地域の主要企業には、Batook Chewing Gum Industries Ltd、Gandour、Suifafood、Mastika Gum Co S.A.R.L.などがあります。ライフスタイルや食生活の嗜好が進化するにつれて、中東の消費者はより健康的なスナックの代替品を求めるようになっています。したがって、無糖ガムや機能性ガムは予測期間中に成長すると予想されます。
世界のガム市場動向
チューインガムに関連する口腔衛生上の利点と、フレーバーの幅広い入手可能性が、市場のプラス成長をもたらしました。
- アジア太平洋と北米が顕著なガム消費地域であり、次いで欧州です。アジア太平洋では、学生や社会人のようなフォーマルな環境の消費者が、集中力を高めるため、脳の活性化のためにガムを噛むことを好みます。中国、インド、日本は、この地域の主要なガム消費国です。
- チューインガムは、北米やアジア太平洋を含む主要市場で広く消費されているガムの一種です。味は、チューインガムを購入する際に最も重要な特性の一つです。人気のあるチューインガムのフレーバーには、ペパーミント、スペアミント、スイカ、シナモン、オリジナル・バブルガム、トロピカルなどがあります。
- 世界的には、北米が2023年に金額ベースで最も高いガム消費を経験しました。同地域では、2023年現在、地元の食料品店で12~60個入りの無糖ガムを買うと、平均して1個当たり1~2米ドルになります。
- 世界的に、チューインガムに対する消費者の嗜好は、歯を清潔に保ち、息を爽やかにするなど、関連する健康上の利点に起因しています。また、チューインガムやバブルガムは、反復的でリズミカルな動作を提供することで、ストレスを和らげる効果があると認識されています。
ガム産業の概要
ガム市場はかなり統合されており、上位5社で82.28%を占めています。この市場の主要企業は以下の通りです。 Lotte Corporation, Mars Incorporated, Mondelez International Inc., Perfetti Van Melle BV and The Hershey Company(sorted alphabetically).
その他の特典
- エクセル形式の市場予測(ME)シート
- 3ヶ月のアナリストサポート
目次
第1章 エグゼクティブサマリーと主な調査結果
第2章 レポートのオファー
第3章 イントロダクション
- 調査の前提条件と市場定義
- 調査範囲
- 調査手法
第4章 主要産業動向
- 規制の枠組み
- 消費者の購買行動
- 成分分析
- バリューチェーンと流通チャネル分析
第5章 市場セグメンテーション
- 菓子類
- バブルガム
- チューインガム
- 砂糖含有量別
- 砂糖入りチューインガム
- 無糖チューインガム
- 流通チャネル
- コンビニエンスストア
- オンライン小売店
- スーパーマーケット/ハイパーマーケット
- その他
- 地域
- アフリカ
- 国別
- エジプト
- ナイジェリア
- 南アフリカ
- その他のアフリカ
- アジア太平洋
- 国別
- オーストラリア
- 中国
- インド
- インドネシア
- 日本
- マレーシア
- ニュージーランド
- 韓国
- その他のアジア太平洋
- 欧州
- 国別
- ベルギー
- フランス
- ドイツ
- イタリア
- オランダ
- ロシア
- スペイン
- スイス
- トルコ
- 英国
- その他の欧州
- 中東
- 国別
- バーレーン
- クウェート
- オマーン
- カタール
- サウジアラビア
- アラブ首長国連邦
- その他の中東
- 北米
- 国別
- カナダ
- メキシコ
- 米国
- その他の北米
- 南米
- 国別
- アルゼンチン
- ブラジル
- その他の南米
- アフリカ
第6章 競合情勢
- 主要な戦略動向
- 市場シェア分析
- 企業情勢
- 企業プロファイル
- Canel's Group
- Ford Gum & Machine Company Inc.
- Gerrit J. Verburg Co.
- Lotte Corporation
- Mars Incorporated
- Mondelez International Inc.
- Perfetti Van Melle BV
- Simply Gum Inc.
- The Fini Company
- The Hershey Company
- The PUR Company Inc.
- Tootsie Roll Industries Inc.
第7章 CEOへの主な戦略的質問CEOへの主な戦略的質問
第8章 付録
- 世界概要
- 概要
- ファイブフォース分析フレームワーク
- 世界・バリューチェーン分析
- 市場力学(DROs)
- 情報源と参考文献
- 図表一覧
- 主要洞察
- データパック
- 用語集
目次
Product Code: 50001790
The Gums Market size is estimated at 17.33 billion USD in 2025, and is expected to reach 20.88 billion USD by 2030, growing at a CAGR of 3.79% during the forecast period (2025-2030).
Convenience shopping facilities led gums sales through supermarkets/hypermarkets and convenience stores, together holding almost 75% value share in 2023
- Globally, the overall retailing segment maintained growth of 13.02% by value in 2023 compared to 2020. The growth is anticipated with the consumers' growing inclination for convenience shopping facilities in the market. Aspects such as rising interest in in-person shopping and demand for discount offers, etc., are likely to drive the retailing industry drastically.
- Supermarkets and hypermarkets were observed to be the largest and the most dominating segment globally. As of 2022, the segment occupied a share of 41.91% by value, and the proliferation of the network of multinational brands of markets promotes growth. Globally, Lidl was recognized as the largest supermarket chain, with 11,200 outlets, followed by Aldi Sud, with 7,200 outlets, and Penny Market, with 3,600 outlets as of 2022. Convenience stores occupied the second highest share of 33.41% by value in 2022, and the sales are mostly favored by product positioning of products - bubble gums and chewing gums near billing kiosks.
- The online retail channel was the fastest-growing distribution channel, and it is expected to register a CAGR of 4.23% by value over the forecast period, accelerated by the increasing global internet penetration, increasing smartphone usage, and increasing and expansive network of grocery delivery chains. Online stores allow consumers to select from a large collection of product offerings marketed under private labels and mainstream brands. The rising number of smartphone users with the widespread penetration of the internet across key regions is anticipated to foster online sales of confectionery during the forecast period. As of April 2023, there were 5.18 billion internet users worldwide, which amounted to 64.6% of the global population.
Raw material price variations in North America recorded 20% higher than in Asia-Pacific, which led North America to lead the market by value throughout the study period
- By volume, Asia-Pacific held a major share in 2023. North America had the highest share by value, owing to the higher price of gums in North America. Gums are widely consumed confectionery variants in the region, especially across China, Japan, and South Korea. In Japan, chewing gum held an 89.66% share of the overall gum market in 2022 in terms of volume. Consumers in formal settings, such as students and working professionals, prefer chewing for brain stimulation to enhance focus and concentration.
- In North America, the growth of gums is associated with the rising awareness about the health benefits of chewing gum consumption. Around 50% of Americans chew gums as of 2023. As a result, the demand for chewing and bubble gums has been increasing significantly in the region. Both chewing and bubble gums are available in various formats, including sugar-based and sugar-free products. Hence, the North American gum market observed a growth of 8.63% by value in 2022 compared to 2021.
- The Middle East is anticipated to register the fastest growth with a CAGR of 6.49% by value during the forecast period. The growth of the market is attributed to the demand for sugar-free gums in the region. Some of the major players in the region include Batook Chewing Gum Industries Ltd, Gandour, Suifafood, and Mastika Gum Co S.A.R.L. As lifestyles and dietary preferences evolve, consumers in the Middle East are increasingly seeking healthier snack alternatives. Hence, sugar-free and functional gum varieties are anticipated to grow during the forecast period.
Global Gums Market Trends
Oral health benefits associated with chewing gum, along with the wide availability of flavors, resulted in the market's positive growth
- Asia-Pacific and North America are the prominent gum-consuming regions, followed by Europe. In Asia-Pacific, consumers in formal settings, such as students and working professionals, prefer chewing gum for brain stimulation as it enhances focus and concentration. China, India, and Japan are leading gum-consuming countries in the region.
- Chewing gum is a widely consumed gum variant across leading markets, including North America and Asia-Pacific. The flavor is one of the most significant attributes when it comes to buying chewing gum. Some popular chewing gum flavors include peppermint, spearmint, watermelon, cinnamon, original bubblegum, and tropical.
- Globally, North America experienced the highest consumption of gums in terms of value in 2023. In the region, as of 2023, on average, the cost of a simple package of sugar-free gum that contains 12 to 60 pieces at the local grocery store ranged from USD 1 to USD 2 per individual pack.
- Globally, the consumer preference for chewing gums is attributed to their associated health benefits, such as keeping teeth clean and freshening breath. Also, chewing gum and bubble gum are perceived to have a stress-relieving effect by providing a repetitive and rhythmic action.
Gums Industry Overview
The Gums Market is fairly consolidated, with the top five companies occupying 82.28%. The major players in this market are Lotte Corporation, Mars Incorporated, Mondelez International Inc., Perfetti Van Melle BV and The Hershey Company (sorted alphabetically).
Additional Benefits:
- The market estimate (ME) sheet in Excel format
- 3 months of analyst support
TABLE OF CONTENTS
1 EXECUTIVE SUMMARY & KEY FINDINGS
2 REPORT OFFERS
3 INTRODUCTION
- 3.1 Study Assumptions & Market Definition
- 3.2 Scope of the Study
- 3.3 Research Methodology
4 KEY INDUSTRY TRENDS
- 4.1 Regulatory Framework
- 4.2 Consumer Buying Behavior
- 4.3 Ingredient Analysis
- 4.4 Value Chain & Distribution Channel Analysis
5 MARKET SEGMENTATION (includes market size in Value in USD and Volume, Forecasts up to 2030 and analysis of growth prospects)
- 5.1 Confectionery Variant
- 5.1.1 Bubble Gum
- 5.1.2 Chewing Gum
- 5.1.2.1 By Sugar Content
- 5.1.2.1.1 Sugar Chewing Gum
- 5.1.2.1.2 Sugar-free Chewing Gum
- 5.2 Distribution Channel
- 5.2.1 Convenience Store
- 5.2.2 Online Retail Store
- 5.2.3 Supermarket/Hypermarket
- 5.2.4 Others
- 5.3 Region
- 5.3.1 Africa
- 5.3.1.1 By Country
- 5.3.1.1.1 Egypt
- 5.3.1.1.2 Nigeria
- 5.3.1.1.3 South Africa
- 5.3.1.1.4 Rest of Africa
- 5.3.2 Asia-Pacific
- 5.3.2.1 By Country
- 5.3.2.1.1 Australia
- 5.3.2.1.2 China
- 5.3.2.1.3 India
- 5.3.2.1.4 Indonesia
- 5.3.2.1.5 Japan
- 5.3.2.1.6 Malaysia
- 5.3.2.1.7 New Zealand
- 5.3.2.1.8 South Korea
- 5.3.2.1.9 Rest of Asia-Pacific
- 5.3.3 Europe
- 5.3.3.1 By Country
- 5.3.3.1.1 Belgium
- 5.3.3.1.2 France
- 5.3.3.1.3 Germany
- 5.3.3.1.4 Italy
- 5.3.3.1.5 Netherlands
- 5.3.3.1.6 Russia
- 5.3.3.1.7 Spain
- 5.3.3.1.8 Switzerland
- 5.3.3.1.9 Turkey
- 5.3.3.1.10 United Kingdom
- 5.3.3.1.11 Rest of Europe
- 5.3.4 Middle East
- 5.3.4.1 By Country
- 5.3.4.1.1 Bahrain
- 5.3.4.1.2 Kuwait
- 5.3.4.1.3 Oman
- 5.3.4.1.4 Qatar
- 5.3.4.1.5 Saudi Arabia
- 5.3.4.1.6 United Arab Emirates
- 5.3.4.1.7 Rest of Middle East
- 5.3.5 North America
- 5.3.5.1 By Country
- 5.3.5.1.1 Canada
- 5.3.5.1.2 Mexico
- 5.3.5.1.3 United States
- 5.3.5.1.4 Rest of North America
- 5.3.6 South America
- 5.3.6.1 By Country
- 5.3.6.1.1 Argentina
- 5.3.6.1.2 Brazil
- 5.3.6.1.3 Rest of South America
- 5.3.1 Africa
6 COMPETITIVE LANDSCAPE
- 6.1 Key Strategic Moves
- 6.2 Market Share Analysis
- 6.3 Company Landscape
- 6.4 Company Profiles
- 6.4.1 Canel's Group
- 6.4.2 Ford Gum & Machine Company Inc.
- 6.4.3 Gerrit J. Verburg Co.
- 6.4.4 Lotte Corporation
- 6.4.5 Mars Incorporated
- 6.4.6 Mondelez International Inc.
- 6.4.7 Perfetti Van Melle BV
- 6.4.8 Simply Gum Inc.
- 6.4.9 The Fini Company
- 6.4.10 The Hershey Company
- 6.4.11 The PUR Company Inc.
- 6.4.12 Tootsie Roll Industries Inc.
7 KEY STRATEGIC QUESTIONS FOR CONFECTIONERY CEOS
8 APPENDIX
- 8.1 Global Overview
- 8.1.1 Overview
- 8.1.2 Porter's Five Forces Framework
- 8.1.3 Global Value Chain Analysis
- 8.1.4 Market Dynamics (DROs)
- 8.2 Sources & References
- 8.3 List of Tables & Figures
- 8.4 Primary Insights
- 8.5 Data Pack
- 8.6 Glossary of Terms
ガム-市場シェア分析、産業動向・統計、成長予測(2025年~2030年)
- 発行日
- 発行
- Mordor Intelligence
- ページ情報
- 英文 314 Pages
- 納期
- 2~3営業日


