
|
市場調査レポート
商品コード
1683104
アフリカの飼料添加物市場-市場シェア分析、産業動向・統計、成長予測(2025年~2030年)Africa Feed Additives - Market Share Analysis, Industry Trends & Statistics, Growth Forecasts (2025 - 2030) |
||||||
カスタマイズ可能
適宜更新あり
|
|||||||
| アフリカの飼料添加物市場-市場シェア分析、産業動向・統計、成長予測(2025年~2030年) |
|
出版日: 2025年03月18日
発行: Mordor Intelligence
ページ情報: 英文 433 Pages
納期: 2~3営業日
|

全表示
- 概要
- 目次
概要
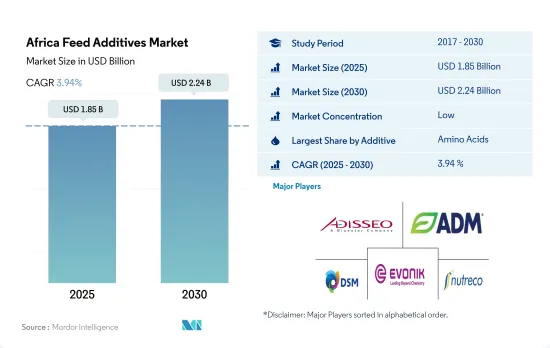
アフリカの飼料添加物市場規模は2025年に18億5,000万米ドルと推定され、2030年には22億4,000万米ドルに達すると予測され、予測期間中(2025~2030年)のCAGRは3.94%で成長する見込みです。
- 2022年、アフリカの飼料添加物市場は16億5,000万米ドルを占め、2017~2022年の間に5.0%増加しました。主に南アフリカのような主要国のGDP成長率が崩壊し、消費者の消費力が激減したため、2019年に急激な落ち込みがありました。それゆえ、2019年にこの地域では飼料生産が激減しました。
- 飼料添加物のうち、アミノ酸は動物飼料に多く使用されています。2022年、アミノ酸はアフリカの飼料添加物市場の4億800万米ドルを占めました。アミノ酸は主に家禽類で消費され、同地域のアミノ酸市場全体の57%を占めています。アミノ酸はタンパク質の合成に使用され、リジンとメチオニンは動物の成長と健康維持に使用される最も重要なアミノ酸です。
- 2022年には、飼料結合剤はこの地域で2番目に消費量の多い飼料添加物で、2億1,970万米ドルを占めました。飼料結合剤は、ペレットを強化し、ペレットの完全性、耐久性、安定性を向上させ、栄養素の溶出を減らし、取り扱い、輸送、保管中のペレットのセグメント化を防ぐために使用されます。
- ミネラル、プロバイオティクス、プレバイオティクス、酸味料、マイコトキシン解毒剤は、この地域で広く使用されている主要な飼料添加物であり、アフリカの飼料添加物市場でそれぞれ186米ドル、121.5米ドル、116.4米ドル、116.3米ドル、1億180万米ドルのシェア値を占めています。これらの飼料添加物は、成長成績を向上させ、栄養素の吸収を容易にし、動物の腸内健康を維持するのに役立ちます。
- 食肉産業が拡大し、高品質の食肉や動物由来の製品に対する需要が高まるにつれて、健康的な飼料に対する需要が大幅に増加しています。このため、この地域の飼料添加物の需要は増加し、2023~2029年のCAGRは3.9%を記録すると予想されます。
- アフリカの飼料添加物市場は近年著しい成長を遂げ、2022年の市場規模は16億5,000万米ドルで、世界の飼料添加物市場規模の5.0%を占めます。この成長は今後も続くとみられ、同地域では食肉と食肉製品の需要が引き続き増加していることから、2023~2029年の間に推定25.7%の増加が見込まれています。しかし、2019年には、同地域における鳥インフルエンザとアフリカ豚インフルエンザの発生により、飼料生産が減少したため、市場は2018年比で23.5%減少しました。
- 南アフリカは、2022年の市場規模が約7億5,000万米ドルで、同地域最大の国でした。同国の飼料生産量と普及率は中程度に高く、市場シェア上昇に貢献しました。南アフリカはまた、予測期間中のCAGRが4.5%で、この地域で最も急成長している国でもあります。
- この地域では、家禽肉の需要の増加と動物の成長を促進する添加物の利点により、家禽類が最大の動物タイプであり、2022年の飼料添加物市場全体の54.9%を占めました。反芻動物は第2位の動物タイプで、2022年の市場シェアは32.8%でした。
- この地域ではブロイラー、レイヤー、乳牛が最大の動物で、2022年の市場シェアはそれぞれ34%、20%、19%を占めました。飼料添加物の使用はこれらの家畜の肉含量を増加させ、これがこれらの家畜における添加物使用の大きな促進要因となっています。
- 食肉と食肉製品への需要の高まりは、動物の生産への投資の増加とともに、この地域の飼料添加物市場を牽引し、予測期間中にCAGR 3.9%を記録すると予想されます。
アフリカの飼料添加物市場動向
アフリカ地域の家禽生産を増加させている高い利益率による家禽肉と卵の一人当たり消費量の増加
- アフリカの養鶏産業は、商業活動や自給自足農業従事者や農村地域への良質なタンパク質の供給において重要な役割を果たしています。2022年のアフリカの総動物頭数の61.5%を家禽類が占めているが、これは主に同地域における家禽肉と卵の需要の高まりによるものです。家禽鳥の頭数は、同地域の養鶏場の成長に牽引され、2017年から8.8%増加し、2022年には22億頭となります。
- 家禽鳥の中でもブロイラーは、同地域における食肉需要の増加により、非常に飼育されています。南アフリカでは、国際的と国内的な鶏肉価格と利益率の上昇を利用するために主要生産者が産業に投資したため、鶏肉生産量は2021年の157万トンから2022年には157万7,000トンに増加しました。
- アフリカの養鶏産業は、主要な輸入国からの鶏肉製品の需要の高まりにより拡大しており、養鶏への投資の増加につながっています。2021年には、南アフリカ最大の養鶏業者の1つであるQuantum Foodsが、生産性を高めるための孵化場の建設やブロイラー農場の改良など、養鶏事業に1,400万米ドル以上を投資しました。
- 南アフリカにおける一人当たりの鶏肉消費量は、2017年の33.7kgから2022年には35.09kgに上昇し、牛肉や羊肉など他の動物性タンパク質の価格上昇に牽引され、予測期間(2023~2029年)には7.5%の成長が見込まれます。これらの要因により、予測期間中(2023~2029年)に養殖場数と頭数が増加すると予測されます。
総合魚類養殖の開発と内水面漁業の発展が複合養殖飼料の需要を増加させている
- 養殖業は、アフリカの多くの国々で農業部門の最大産業のひとつとなっています。不順な気候条件と漁獲量の減少により、2019年の同地域における配合飼料の使用量は前年比で60%減少しました。同地域における淡水と海洋養殖の増加により配合飼料の需要が急増し、2019年から152%増加し、2022年には150万トンに達しました。この増加にもかかわらず、2022年の同地域の飼料総生産量に占める養殖飼料生産量の割合は4.3%でした。
- 近年の養殖生産量の増加は、押出飼料の使用や農場管理方法の改善など、栄養飼料の適用が大幅に拡大したことに加え、投資の増加により、2020~2022年にかけて配合飼料の生産量が1.3%増加したことによる。エジプトの養殖飼料産業は急速な発展を遂げ、従来のペレット飼料(10%)から高品質の押出飼料(90%)へとシフトしました。養殖開発基金や、ナイジェリアなど他の国々における同様の政府制度は、この地域における養殖を推進し、それによって飼料生産を増加させると予想されます。
- エジプトの漁業・養殖開発計画では、一貫養殖の拡大、内陸漁業の開発、メガ国家的生産を通じて、2025年までに魚類生産量を300万トンに増やすことを目指しています。したがって、水産養殖生産の増加、高品質の押出飼料の使用の増加、投資の増加が、この地域の飼料生産を促進すると予想されます。
アフリカの飼料添加物産業概要
アフリカの飼料添加物市場はセグメント化されており、上位5社で16.14%を占めています。この市場の主要企業は、Adisseo、Archer Daniel Midland Co.、DSM Nutritional Products AG、Evonik Industries AG、SHV(Nutreco NV)です。
その他の特典
- エクセル形式の市場予測(ME)シート
- 3ヶ月のアナリストサポート
目次
第1章 エグゼクティブサマリーと主要調査結果
第2章 レポートのオファー
第3章 イントロダクション
- 調査の前提条件と市場定義
- 調査範囲
- 調査手法
第4章 主要産業動向
- 動物頭数
- 家禽
- 反芻動物
- 豚
- 飼料生産
- 水産養殖
- 家禽
- 反芻動物
- 養豚
- 規制の枠組み
- エジプト
- ケニア
- 南アフリカ
- バリューチェーンと流通チャネルの分析
第5章 市場セグメンテーション
- 添加剤
- 酸味料
- サブ添加物別
- フマル酸
- 乳酸
- プロピオン酸
- その他の酸味料
- アミノ酸
- 添加物別
- リジン
- メチオニン
- スレオニン
- トリプトファン
- その他のアミノ酸
- 抗生物質
- 添加物別
- バシトラシン
- ペニシリン
- テトラサイクリン
- タイロシン
- その他の抗生物質
- 酸化防止剤
- 添加物別
- ブチルヒドロキシアニソール(BHA)
- ブチル化ヒドロキシトルエン(BHT)
- クエン酸
- エトキシキン
- 没食子酸プロピル
- トコフェロール
- その他の酸化防止剤
- 結合剤
- サブ添加物別
- 天然結合剤
- 合成バインダー
- 酵素
- 副添加物別
- 炭水化物分解酵素
- フィターゼ
- その他の酵素
- 香料・甘味料
- サブ添加物別
- 香料
- 甘味料
- ミネラル
- サブ添加物別
- マクロミネラル
- 微量ミネラル
- マイコトキシン解毒剤
- 副添加物別
- 結合剤
- バイオトランスフォーマー
- フィトジェニックス
- 副添加物別
- エッセンシャルオイル
- ハーブ&スパイス
- その他の植物性食品
- 色素
- 副添加物別
- カロテノイド
- クルクミン&スピルリナ
- プレバイオティクス
- 副添加物別
- フラクトオリゴ糖
- ガラクトオリゴ糖
- イヌリン
- ラクチュロース
- マンナンオリゴ糖
- キシロオリゴ糖
- その他のプレバイオティクス
- プロバイオティクス
- 添加物別
- ビフィズス菌
- 腸球菌
- 乳酸菌
- ペディオコッカス
- レンサ球菌
- その他のプロバイオティクス
- ビタミン
- 添加物別
- ビタミンA
- ビタミンB
- ビタミンC
- ビタミンE
- その他のビタミン
- 酵母
- 添加物別
- 生酵母
- セレン酵母
- 使用済み酵母
- トルラ乾燥酵母
- ホエイ酵母
- 酵母誘導体
- 酸味料
- 動物
- 水産養殖
- サブアニマル別
- 魚類
- エビ
- その他の養殖種
- 家禽類
- 小動物別
- ブロイラー
- レイヤー
- その他の鳥類
- 反芻動物
- 小動物別
- 肉牛
- 乳牛
- その他の反芻動物
- 豚
- その他の動物
- 水産養殖
- 国名
- エジプト
- ケニア
- 南アフリカ
- その他のアフリカ
第6章 競合情勢
- 主要な戦略動向
- 市場シェア分析
- 企業情勢
- 企業プロファイル(世界レベル概要、市場レベル概要、主要な事業セグメント、財務、従業員数、主要情報、市場ランク、市場シェア、製品・サービス、最近の動向分析を含む)。
- Adisseo
- Archer Daniel Midland Co.
- BASF SE
- Brenntag SE
- Cargill Inc.
- DSM Nutritional Products AG
- Evonik Industries AG
- IFF(Danisco Animal Nutrition)
- Kemin Industries
- SHV(Nutreco NV)
第7章 CEOへの主要戦略的質問
第8章 付録
- 世界概要
- 概要
- ファイブフォース分析フレームワーク
- 世界のバリューチェーン分析
- 世界市場規模とDRO
- 情報源と参考文献
- 図表リスト
- 主要洞察
- データパック
- 用語集
目次
Product Code: 49260
The Africa Feed Additives Market size is estimated at 1.85 billion USD in 2025, and is expected to reach 2.24 billion USD by 2030, growing at a CAGR of 3.94% during the forecast period (2025-2030).
- In 2022, the African feed additives market accounted for USD 1.65 billion, an increase of 5.0% during 2017-2022. There was a sudden dip in 2019, mainly due to collapsed GDP growth of major countries like South Africa, where the spending power of consumers reduced drastically. Hence, feed production reduced drastically in the region in 2019.
- Among feed additives, amino acids are largely used in animal feeds. In 2022, amino acids accounted for USD 408 million of the African feed additives market. Amino acids were largely consumed by poultry birds, accounting for 57% of the total amino acids market in the region. Amino acids are used to synthesize proteins, and lysine and methionine are the most crucial amino acids used for animals' growth and health maintenance.
- In 2022, feed binders were the second most consumed feed additives in the region, accounting for USD 219.7 million of feed additives. Feed binders are used to strengthen pellets, improve pellets' integrity, durability, and stability, reduce nutrient leaching, and prevent fragmentation of pellets during handling, transportation, and storage.
- Minerals, probiotics, prebiotics, acidifiers, and mycotoxin detoxifiers are the major feed additives widely used in the region, accounting for USD 186, 121.5, 116.4, 116.3, and 101.8 million share values of the African feed additives market, respectively. These feed additives help improve growth performance, enable easy absorption of nutrients, and maintain the animals' gut health.
- With the expansion of the meat industry and increasing demand for quality meat and animal-based products, the demand for healthy diets has increased significantly. Thus, the demand for feed additives in the region is anticipated to increase, registering a CAGR of 3.9% during 2023-2029.
- The African feed additives market saw significant growth in recent years, with a market value of USD 1.65 billion in 2022, accounting for 5.0% of the global feed additives market value. This growth is expected to continue, with an estimated 25.7% increase between 2023 and 2029, as the demand for meat and meat products continues to rise in the region. However, in 2019, the market declined by 23.5% compared to 2018 due to the Avian flu and African swine flu incidence in the region, leading to reduced feed production.
- South Africa was the largest country in the region in terms of market value, with around USD 0.75 billion in 2022. The country's moderately higher feed production and penetration rates contributed to its higher market share. South Africa was also the fastest-growing country in the region, with a CAGR of 4.5% during the forecast period.
- Poultry birds were the largest animal type in the region, accounting for 54.9% of the total feed additives market value in 2022 due to an increase in the demand for poultry meat and the benefits of additives in promoting animal growth. Ruminants were the second-largest animal type, with a market share of 32.8% in 2022.
- Broilers, layers, and dairy cattle were the largest animals in the region, occupying 34%, 20%, and 19% of the market share in 2022, respectively. The usage of feed additives increases the meat content of these animals, which was a significant driving factor in the usage of additives in these animals.
- The growing demand for meat and meat products, along with an increase in investments in the production of animals, is expected to drive the feed additives market in the region, registering a CAGR of 3.9% during the forecast period.
Africa Feed Additives Market Trends
The increasing per capita consumption of poultry meat and eggs with higher profit margins which is increasing the poultry production in Africa region
- The African poultry industry plays an important role in commercial activities and in providing quality protein to subsistence farmers and rural communities. Poultry birds accounted for 61.5% of the total animal headcount in Africa in 2022, primarily due to the rising demand for poultry meat and eggs in the region. The number of poultry birds increased by 8.8% from 2017 to 2.2 billion heads in 2022, driven by the growth of poultry farms in the region.
- Among poultry birds, broilers were highly raised due to the increasing demand for meat in the region. In South Africa, chicken meat production increased from 1,570 thousand metric tons in 2021 to 1,577 thousand metric tons in 2022 as major producers invested in the industry to capitalize on higher international and domestic poultry prices and profit margins.
- The African poultry industry is expanding due to the growing demand for poultry products from key importing countries, leading to increased investments in poultry farming. In 2021, Quantum Foods, one of South Africa's largest poultry producers, invested over USD 14 million in its poultry operations, including constructing hatcheries and upgrading broiler farms to boost productivity.
- The per capita consumption of poultry meat in South Africa rose to 35.09 kg in 2022 from 33.7 kg in 2017, and it is expected to grow by 7.5% during the forecast period (2023-2029), driven by the increasing prices of other animal proteins like beef and lamb. These factors are projected to increase the number of farms and headcount during the forecast period (2023-2029).
Expansion of integrated fish farming and development of inland fisheries is increasing the demand for compound aqua feed
- Aquaculture farming has become one of the largest industries in the agriculture sector in many countries across Africa. Due to unfavorable climatic conditions and a reduction in fish catch, the usage of compound feed in the region decreased by 60% in 2019 compared to the previous year. The increase in freshwater and marine aquaculture farming in the region caused a surge in demand for compound feed, which grew by 152% from 2019 to reach 1.5 million metric tons in 2022. Despite this increase, aquaculture feed production accounted for 4.3% of the total feed production in the region in 2022.
- The rise in aquaculture production in recent years is credited to a significant expansion in the application of nutritional feed, including the use of extruded feed and improved farm management practices, as well as an increase in investments, which led to a 1.3% increase in the production of compound feed from 2020 to 2022. The Egyptian aquaculture feed industry underwent rapid development, with a shift from conventionally pelleted feeds (10%) to high-quality extruded feeds (90%). The Fish Farming Development Fund and similar government schemes in other countries, such as Nigeria, are expected to drive aquaculture farming in the region, thereby increasing feed production.
- Egypt's fisheries and aquaculture development plan aims to increase fish production to 3 million metric tons by 2025 through the expansion of integrated fish farming, development of inland fisheries, and mega-national productions. Thus, an increase in aquaculture production, a rise in the usage of high-quality extruded feed, and an increase in investments are expected to drive feed production in the region.
Africa Feed Additives Industry Overview
The Africa Feed Additives Market is fragmented, with the top five companies occupying 16.14%. The major players in this market are Adisseo, Archer Daniel Midland Co., DSM Nutritional Products AG, Evonik Industries AG and SHV (Nutreco NV) (sorted alphabetically).
Additional Benefits:
- The market estimate (ME) sheet in Excel format
- 3 months of analyst support
TABLE OF CONTENTS
1 EXECUTIVE SUMMARY & KEY FINDINGS
2 REPORT OFFERS
3 INTRODUCTION
- 3.1 Study Assumptions & Market Definition
- 3.2 Scope of the Study
- 3.3 Research Methodology
4 KEY INDUSTRY TRENDS
- 4.1 Animal Headcount
- 4.1.1 Poultry
- 4.1.2 Ruminants
- 4.1.3 Swine
- 4.2 Feed Production
- 4.2.1 Aquaculture
- 4.2.2 Poultry
- 4.2.3 Ruminants
- 4.2.4 Swine
- 4.3 Regulatory Framework
- 4.3.1 Egypt
- 4.3.2 Kenya
- 4.3.3 South Africa
- 4.4 Value Chain & Distribution Channel Analysis
5 MARKET SEGMENTATION (includes market size in Value in USD and Volume, Forecasts up to 2030 and analysis of growth prospects)
- 5.1 Additive
- 5.1.1 Acidifiers
- 5.1.1.1 By Sub Additive
- 5.1.1.1.1 Fumaric Acid
- 5.1.1.1.2 Lactic Acid
- 5.1.1.1.3 Propionic Acid
- 5.1.1.1.4 Other Acidifiers
- 5.1.2 Amino Acids
- 5.1.2.1 By Sub Additive
- 5.1.2.1.1 Lysine
- 5.1.2.1.2 Methionine
- 5.1.2.1.3 Threonine
- 5.1.2.1.4 Tryptophan
- 5.1.2.1.5 Other Amino Acids
- 5.1.3 Antibiotics
- 5.1.3.1 By Sub Additive
- 5.1.3.1.1 Bacitracin
- 5.1.3.1.2 Penicillins
- 5.1.3.1.3 Tetracyclines
- 5.1.3.1.4 Tylosin
- 5.1.3.1.5 Other Antibiotics
- 5.1.4 Antioxidants
- 5.1.4.1 By Sub Additive
- 5.1.4.1.1 Butylated Hydroxyanisole (BHA)
- 5.1.4.1.2 Butylated Hydroxytoluene (BHT)
- 5.1.4.1.3 Citric Acid
- 5.1.4.1.4 Ethoxyquin
- 5.1.4.1.5 Propyl Gallate
- 5.1.4.1.6 Tocopherols
- 5.1.4.1.7 Other Antioxidants
- 5.1.5 Binders
- 5.1.5.1 By Sub Additive
- 5.1.5.1.1 Natural Binders
- 5.1.5.1.2 Synthetic Binders
- 5.1.6 Enzymes
- 5.1.6.1 By Sub Additive
- 5.1.6.1.1 Carbohydrases
- 5.1.6.1.2 Phytases
- 5.1.6.1.3 Other Enzymes
- 5.1.7 Flavors & Sweeteners
- 5.1.7.1 By Sub Additive
- 5.1.7.1.1 Flavors
- 5.1.7.1.2 Sweeteners
- 5.1.8 Minerals
- 5.1.8.1 By Sub Additive
- 5.1.8.1.1 Macrominerals
- 5.1.8.1.2 Microminerals
- 5.1.9 Mycotoxin Detoxifiers
- 5.1.9.1 By Sub Additive
- 5.1.9.1.1 Binders
- 5.1.9.1.2 Biotransformers
- 5.1.10 Phytogenics
- 5.1.10.1 By Sub Additive
- 5.1.10.1.1 Essential Oil
- 5.1.10.1.2 Herbs & Spices
- 5.1.10.1.3 Other Phytogenics
- 5.1.11 Pigments
- 5.1.11.1 By Sub Additive
- 5.1.11.1.1 Carotenoids
- 5.1.11.1.2 Curcumin & Spirulina
- 5.1.12 Prebiotics
- 5.1.12.1 By Sub Additive
- 5.1.12.1.1 Fructo Oligosaccharides
- 5.1.12.1.2 Galacto Oligosaccharides
- 5.1.12.1.3 Inulin
- 5.1.12.1.4 Lactulose
- 5.1.12.1.5 Mannan Oligosaccharides
- 5.1.12.1.6 Xylo Oligosaccharides
- 5.1.12.1.7 Other Prebiotics
- 5.1.13 Probiotics
- 5.1.13.1 By Sub Additive
- 5.1.13.1.1 Bifidobacteria
- 5.1.13.1.2 Enterococcus
- 5.1.13.1.3 Lactobacilli
- 5.1.13.1.4 Pediococcus
- 5.1.13.1.5 Streptococcus
- 5.1.13.1.6 Other Probiotics
- 5.1.14 Vitamins
- 5.1.14.1 By Sub Additive
- 5.1.14.1.1 Vitamin A
- 5.1.14.1.2 Vitamin B
- 5.1.14.1.3 Vitamin C
- 5.1.14.1.4 Vitamin E
- 5.1.14.1.5 Other Vitamins
- 5.1.15 Yeast
- 5.1.15.1 By Sub Additive
- 5.1.15.1.1 Live Yeast
- 5.1.15.1.2 Selenium Yeast
- 5.1.15.1.3 Spent Yeast
- 5.1.15.1.4 Torula Dried Yeast
- 5.1.15.1.5 Whey Yeast
- 5.1.15.1.6 Yeast Derivatives
- 5.1.1 Acidifiers
- 5.2 Animal
- 5.2.1 Aquaculture
- 5.2.1.1 By Sub Animal
- 5.2.1.1.1 Fish
- 5.2.1.1.2 Shrimp
- 5.2.1.1.3 Other Aquaculture Species
- 5.2.2 Poultry
- 5.2.2.1 By Sub Animal
- 5.2.2.1.1 Broiler
- 5.2.2.1.2 Layer
- 5.2.2.1.3 Other Poultry Birds
- 5.2.3 Ruminants
- 5.2.3.1 By Sub Animal
- 5.2.3.1.1 Beef Cattle
- 5.2.3.1.2 Dairy Cattle
- 5.2.3.1.3 Other Ruminants
- 5.2.4 Swine
- 5.2.5 Other Animals
- 5.2.1 Aquaculture
- 5.3 Country
- 5.3.1 Egypt
- 5.3.2 Kenya
- 5.3.3 South Africa
- 5.3.4 Rest of Africa
6 COMPETITIVE LANDSCAPE
- 6.1 Key Strategic Moves
- 6.2 Market Share Analysis
- 6.3 Company Landscape
- 6.4 Company Profiles (includes Global Level Overview, Market Level Overview, Core Business Segments, Financials, Headcount, Key Information, Market Rank, Market Share, Products and Services, and Analysis of Recent Developments).
- 6.4.1 Adisseo
- 6.4.2 Archer Daniel Midland Co.
- 6.4.3 BASF SE
- 6.4.4 Brenntag SE
- 6.4.5 Cargill Inc.
- 6.4.6 DSM Nutritional Products AG
- 6.4.7 Evonik Industries AG
- 6.4.8 IFF(Danisco Animal Nutrition)
- 6.4.9 Kemin Industries
- 6.4.10 SHV (Nutreco NV)
7 KEY STRATEGIC QUESTIONS FOR FEED ADDITIVE CEOS
8 APPENDIX
- 8.1 Global Overview
- 8.1.1 Overview
- 8.1.2 Porter's Five Forces Framework
- 8.1.3 Global Value Chain Analysis
- 8.1.4 Global Market Size and DROs
- 8.2 Sources & References
- 8.3 List of Tables & Figures
- 8.4 Primary Insights
- 8.5 Data Pack
- 8.6 Glossary of Terms

