
|
市場調査レポート
商品コード
1644958
アジア太平洋の大気質モニタリング-市場シェア分析、産業動向と統計、成長予測(2025年~2030年)Asia Pacific Air Quality Monitoring - Market Share Analysis, Industry Trends & Statistics, Growth Forecasts (2025 - 2030) |
||||||
カスタマイズ可能
適宜更新あり
|
|||||||
| アジア太平洋の大気質モニタリング-市場シェア分析、産業動向と統計、成長予測(2025年~2030年) |
|
出版日: 2025年01月05日
発行: Mordor Intelligence
ページ情報: 英文 110 Pages
納期: 2~3営業日
|

全表示
- 概要
- 目次
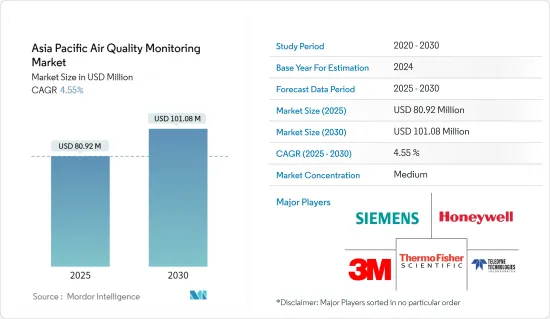
アジア太平洋の大気質モニタリング(AQM)市場規模は、2025年に8,092万米ドルと推定され、予測期間(2025~2030年)のCAGRは4.55%で、2030年には1億108万米ドルに達すると予測されています。
主要ハイライト
- 中期的には、大気汚染を抑制するための意識の高まりと政府の施策や非政府の取り組みが市場の成長を促進すると予想されます。
- 一方、大気質モニタリングシステムのコストが高いことが、予測期間中のアジア太平洋の大気質モニタリング市場の成長を妨げると予測されます。\
- 大気質モニタリングシステムの技術的進歩の増加は、予測期間中にアジア太平洋の大気質モニタリング市場に有利な成長機会をもたらすと考えられます。
アジア太平洋の大気質モニタリング市場動向
屋外セグメントが著しい成長を遂げる
- 屋外空気質モニタリングシステムは、外気、すなわちオープンスペースの汚染物質、浮遊粒子、湿度、温度の濃度レベルを測定します。CO2、O3、NO2、SO2、ホルムアルデヒド(HCHO)、総揮発性有機化合物(TVOC)などの汚染物質のレベルを検出します。
- パキスタンの2022年の平均PM2.5濃度は70.9マイクログラム/立方メートル(μg/m3)で、世界で最も汚染された国のひとつとなりました。これはインドの平均PM2.5濃度よりも18μg/m3近く高いです。
- 大気質モニタリングシステムは、各政府が特定の州や国の都市や公共スペースに配備するのが主流です。これらの装置は耐候性があり、建築物の認定を受けるためには特定の環境検査とシミュレーションを満たす必要があります。
- 屋外モニターはさらに、携帯型屋外モニター、固定型屋外モニター、粉塵・微粒子モニター、AQMステーションに区分されます。ポータブル屋外モニターは、その運用上の利点と容易な展開により、世界的に最も広く展開されています。
- 都市化が進み、都市部に移り住む人が増えるにつれて、都市部の大気汚染レベルは上昇しています。2050年までに都市部に住む人は25億人増えると推定されています。人口密度が高く、産業施設、都市廃棄物の発生、交通渋滞などの多様な汚染源があるため、大気質のモニタリングと対処システムの改善が強く求められています。
- 2022年4月、Oizomはインドの9つのスマートシティに129台の大気質モニターを設置したと発表しました。政府は2015年に100スマートシティプログラムを開始し、Oizomは大気質モニタリングのための堅牢で正確かつコンパクトなソリューションを提供するパイオニアとなりました。Oizomは2017年にカキナダスマートシティへの設置を開始し、最終的には5年間でバラナシ、ガンディナガール、スラート、イタナガル、ダヴァンゲレ、インパール、アグラなど8都市に拡大しました。
- したがって、このような開発により、予測期間中、市場の屋外モニター部門に推進力を与えると予想されます。
市場を独占する中国
- World Air Quality Report 2021によると、世界で最も汚染されている上位10カ国のうち、5カ国がアジア太平洋でした。汚染上位20カ国のうち、8カ国がアジア太平洋の国でした。
- 2022年現在、World Air Quality Reportによると、中国は人口で加重平均したPM2.5濃度が30.6μg/m3で25位に位置しています。世界大気質報告書によると、2022年、東アジアで最も汚染された18の地方都市は中国でした。中国では毎年100万人以上が大気汚染が原因で死亡していると推定されています。しかし現在、中国は革新的な解決策で反撃しています。
- 1970年代にいくつかの都市で大気質のモニタリングを開始し、1980年代には最初の国家モニタリングシステムを立ち上げました。2,000年には、NO2、PM10、SO2のモニタリングデータによる日次大気汚染指数(API)が国内で導入され、42都市の大気質が評価されました。
- 近年、中国政府は大気の質のモニタリング範囲を大幅に改善しました。中国全土の連邦大気モニタリング局の数は、2012~2020年の間に661ヵ所から1,800ヵ所に増加しました。これは、地方政府によって管理され、資金提供されている数千の大気モニタリングステーションに加えてのことです。
- 近年、中国の大気汚染に関する広範な懸念から、大気質モニタリングに注目が集まっています。中国の大気質モニタリング産業は近年、予想以上のスピードで成長しています。
- しかし、この技術は主に最も必要とされる都市部に集中しています。国民の関心と規制機関が大気質の改善に注力していることから、中国の大気質モニタリング市場は予測期間中、明るい展望が期待されます。
アジア太平洋の大気質モニタリング産業概要
アジア太平洋の大気質モニタリング市場は、半固有の性質を持っています。市場の主要企業(順不同)には、SiemensAG、Thermo Fisher Scientific、3M、Honeywell International Inc.、Teledyne Technologies Inc.などがあります。
2022年2月、Honeywellは室内大気質(IAQ)モニターを発売しました。このモニターは、建物の所有者や運営者に潜在的な問題を警告し、室内大気質を積極的に向上させることで、空気中の汚染物質を伝播するリスクを潜在的に低減します。Make in India製品であるこのコンパクトなタッチスクリーン対応機器は、相対湿度、温度、室内空気汚染物質などの主要なIAQパラメーターを測定します。測定値に基づいてIAQ指数を記載しています。
その他の特典
- エクセル形式の市場予測(ME)シート
- 3ヶ月のアナリストサポート
目次
第1章 イントロダクション
- 調査範囲
- 市場の定義
- 調査の前提
第2章 エグゼクティブサマリー
第3章 調査手法
第4章 市場概要
- イントロダクション
- 2028年までの市場規模と需要予測(単位:米ドル)
- 最近の動向と開発
- 政府の規制と施策
- 市場力学
- 促進要因
- 大気汚染を抑制するための意識向上と政府施策・非政府イニシアチブの促進
- 抑制要因
- 大気質モニタリングシステムの高コスト
- 促進要因
- サプライチェーン分析
- ポーターのファイブフォース分析
- 供給企業の交渉力
- 消費者の交渉力
- 新規参入業者の脅威
- 代替品の脅威
- 競争企業間の敵対関係の強さ
第5章 市場セグメンテーション
- 製品タイプ
- インドアモニター
- 屋外モニター
- サンプリング方式
- 連続
- 手動
- 断続
- 汚染物質タイプ
- 化学汚染物質
- 物理的汚染物質
- 生物汚染物質
- エンドユーザー
- 住宅と商業施設
- 発電
- 石油化学
- その他
- 地域
- 中国
- インド
- 日本
- シンガポール
- その他のアジア太平洋
第6章 競合情勢
- M&A、合弁事業、提携、協定
- 主要企業の戦略
- 企業プロファイル
- Siemens AG
- Thermo Fisher Scientific Inc.
- Horiba Ltd
- Emerson Electric Co.
- 3M Co.
- Honeywell International Inc.
- Teledyne Technologies Inc.
- TSI Inc.
- Merck KGaA
- Agilent Technologies Inc.
- Aeroqual Limited
第7章 市場機会と今後の動向
- 大気質モニタリングシステムにおける技術進歩の増加
The Asia Pacific Air Quality Monitoring Market size is estimated at USD 80.92 million in 2025, and is expected to reach USD 101.08 million by 2030, at a CAGR of 4.55% during the forecast period (2025-2030).
Key Highlights
- Over the medium term, increasing awareness and favorable government policies and non-government initiatives for curbing air pollution are expected to drive the market's growth.
- On the other hand, the high costs of air quality monitoring systems are expected to hamper the growth of the Asia Pacific air quality monitoring market during the forecast period. \
- Nevertheless, increasing technological advancements in air quality monitoring systems will likely create lucrative growth opportunities for the Asia Pacific air quality monitoring market in the forecast period.
Asia Pacific Air Quality Monitoring Market Trends
Outdoor Segment to Witness Significant Growth
- The outdoor air quality monitoring systems measure the concentration levels of pollutants, suspended particles, humidity, and temperature in outside air, i.e., in open spaces. They detect the levels of pollutants like CO2, O3, NO2, SO2, formaldehyde (HCHO), total volatile organic compounds (TVOC), etc.
- Pakistan had an average PM2.5 concentration of 70.9 micrograms per cubic meter of air (µg/m3) in 2022, making it one of the most polluted country in the world. This was almost 18 µg/m3 more than the average PM2.5 concentrations in India.
- Air quality monitoring systems are majorly deployed by the respective governments in cities and public spaces of a particular state or country. These devices are weather-resistant and must meet certain environmental tests and simulations to be confided by some building certifications.
- The outdoor monitors are further segmented into portable outdoor monitors, fixed outdoor monitors, dust and particulate monitors, and AQM stations. Portable outdoor monitors are the most widely deployed globally due to their operational advantage and easy deployment.
- With the increasing urbanization and more people moving to urban areas, the air pollution levels in urban areas have increased. It is estimated that by 2050, 2.5 billion more people will live in urban areas. The high population density and diverse pollution sources like industrial facilities, municipal waste generation, and transport congestion lead to an urge for better air quality monitoring and addressal systems.
- In April 2022, Oizom stated that the company installed 129 air quality monitors across nine smart cities in India. The Government launched the 100 Smart Cities program in 2015, for which Oizom has pioneered in providing robust, accurate, and compact solutions for air quality monitoring. Oizom initiated its installation in Kakinada Smart City in 2017 and eventually expanded to eight other cities over five years, such as Varanasi, Gandhinagar, Surat, Itanagar, Davangere, Imphal, and Agra.
- Therefore, owing to such developments are expected to give a thrust to the outdoor monitor segment of the market during the forecast period.
China to Dominate the Market
- According to the World Air Quality Report 2021, among the top 10 most polluted countries in the world, five were from the Asia-Pacific region. Among the top 20 polluted countries, eight were from the region.
- As of 2022, China stands at 25th position with an average of 30.6 µg/m3 PM2.5 concentration weighted by population according to the World Air Quality Report. According to the world air quality report, in 2022, the 18 most polluted regional cities in East Asia were from China. Over a million people are estimated to die annually from air pollution in China. However, currently, the country is fighting back with innovative solutions.
- China has a long history of using air quality monitoring systems; the country started monitoring air quality in a few cities in the 1970s and set up an initial national monitoring system in the 1980s. In 2000, the daily Air Pollution Index (API) based on NO2, PM10, and SO2 monitoring data was introduced in the country to assess air quality in 42 cities.
- In recent years, the Government of China has significantly improved air quality monitor coverage. The number of federal air monitoring stations across China increased from 661 to 1,800 between 2012 and 2020. This is in addition to thousands of air monitoring stations being managed and funded by the local governments.
- In recent years, air quality monitoring has drawn attention due to the extensive concerns regarding air pollution in China. China's air quality monitoring industry has grown faster than expected in recent years.
- However, this technology has been concentrated mainly in urban where it is most required. As public interest and regulatory bodies focus on improving air quality, the Chinese air quality monitoring market is expected to have a positive outlook during the forecast period.
Asia Pacific Air Quality Monitoring Industry Overview
The Asia Pacific air quality monitoring market is semi-consolidated in nature. Some of the major players in the market (in no particular order) include Siemens AG, Thermo Fisher Scientific Inc., 3M Co., Honeywell International Inc., and Teledyne Technologies Inc., among others.
In February 2022, Honeywell launched its Indoor Air Quality (IAQ) monitor, which forewarns building owners and operators of potential issues to proactively enhance indoor air quality, thereby potentially reducing the risk of transmitting airborne contaminants. A Make in India product, the compact, touchscreen-enabled device measures key IAQ parameters, including relative humidity, temperature, and indoor air pollutants. It provides an IAQ index based on the readings.
Additional Benefits:
- The market estimate (ME) sheet in Excel format
- 3 months of analyst support
TABLE OF CONTENTS
1 INTRODUCTION
- 1.1 Scope of the Study
- 1.2 Market Definition
- 1.3 Study Assumptions
2 EXECUTIVE SUMMARY
3 RESEARCH METHODOLOGY
4 MARKET OVERVIEW
- 4.1 Introduction
- 4.2 Market Size and Demand Forecast in USD, till 2028
- 4.3 Recent Trends and Developments
- 4.4 Government Policies and Regulations
- 4.5 Market Dynamics
- 4.5.1 Drivers
- 4.5.1.1 Increasing Awareness and Favorable Government Policies and Non-government Initiatives for Curbing Air Pollution
- 4.5.2 Restraints
- 4.5.2.1 High Costs of Air Quality Monitoring Systems
- 4.5.1 Drivers
- 4.6 Supply Chain Analysis
- 4.7 Porter's Five Forces Analysis
- 4.7.1 Bargaining Power of Suppliers
- 4.7.2 Bargaining Power of Consumers
- 4.7.3 Threat of New Entrants
- 4.7.4 Threat of Substitute Products and Services
- 4.7.5 Intensity of Competitive Rivalry
5 MARKET SEGMENTATION
- 5.1 Product Type
- 5.1.1 Indoor Monitor
- 5.1.2 Outdoor Monitor
- 5.2 Sampling Method
- 5.2.1 Continuous
- 5.2.2 Manual
- 5.2.3 Intermittent
- 5.3 Pollutant Type
- 5.3.1 Chemical Pollutants
- 5.3.2 Physical Pollutants
- 5.3.3 Biological Pollutants
- 5.4 End User
- 5.4.1 Residential and Commercial
- 5.4.2 Power Generation
- 5.4.3 Petrochemicals
- 5.4.4 Other End Users
- 5.5 Geography
- 5.5.1 China
- 5.5.2 India
- 5.5.3 Japan
- 5.5.4 Singapore
- 5.5.5 Rest of Asia-Pacific
6 COMPETITIVE LANDSCAPE
- 6.1 Mergers and Acquisitions, Joint Ventures, Collaborations, and Agreements
- 6.2 Strategies Adopted by Leading Players
- 6.3 Company Profiles
- 6.3.1 Siemens AG
- 6.3.2 Thermo Fisher Scientific Inc.
- 6.3.3 Horiba Ltd
- 6.3.4 Emerson Electric Co.
- 6.3.5 3M Co.
- 6.3.6 Honeywell International Inc.
- 6.3.7 Teledyne Technologies Inc.
- 6.3.8 TSI Inc.
- 6.3.9 Merck KGaA
- 6.3.10 Agilent Technologies Inc.
- 6.3.11 Aeroqual Limited
7 MARKET OPPORTUNITIES AND FUTURE TRENDS
- 7.1 Increasing Technological Advancements in Air Quality Monitoring Systems
