|
|
市場調査レポート
商品コード
1910601
危険物物流:市場シェア分析、業界動向と統計、成長予測(2026年~2031年)Hazardous Goods Logistics - Market Share Analysis, Industry Trends & Statistics, Growth Forecasts (2026 - 2031) |
||||||
|
|||||||
カスタマイズ可能
適宜更新あり
|
|||||||

| 危険物物流:市場シェア分析、業界動向と統計、成長予測(2026年~2031年) |
|
出版日: 2026年01月12日
発行: Mordor Intelligence
ページ情報: 英文 150 Pages
納期: 2~3営業日
|

概要
危険物物流市場は、2025年の2,748億米ドルから2026年には2,913億3,000万米ドルへ成長し、2026年から2031年にかけてCAGR6.01%で推移し、2031年までに3,898億9,000万米ドルに達すると予測されております。

この上昇傾向は、化学・石油化学製品の貿易量拡大、リチウムイオン電池の需要増加、ならびに道路・鉄道・航空・海上ネットワーク全体で専門的な取り扱いが必要な温度管理型生物製剤の需要に支えられています。IoTセンサー、ブロックチェーンを活用した管理連鎖ツール、AI駆動型ルーティングを中心としたデジタル化の進展は、運用可視性を強化すると同時に、事業者が厳格化する世界の安全規制に対応するのを支援しています。北米、欧州連合、アジア太平洋地域の規制機関は、包装、表示、リアルタイムデータ共有に関する基準の統一を進めており、これにより運送事業者はユーロ6規格またはゼロエミッションパワートレイン、消火技術を備えた車両への近代化を迫られています。一方、保険料の上昇や国境を越えたコンプライアンスコストの増加による持続的な圧力により、大規模事業者が規模の経済を追求する中で業界再編が促進されています。
世界の危険物物流市場の動向と洞察
世界の化学品・石油製品貿易の拡大
世界の製造業者は現在、特殊化学品、肥料、精製製品など、クラス別の包装、換気、分離を必要とする製品をより大量に輸送しています。米国だけでも2024年には1日あたり120万件の危険物貨物を扱い、これは全貨物トンマイルの12%に相当します。化学品は2024年の危険物物流市場における総収益の36%を占め、加圧タンク車やISOタンクコンテナといった大規模資産の必要性を示しています。クラス3の引火性液体とクラス8の腐食性物質が鉄道輸送の大部分を占め、運送業者は99.99%の事故ゼロ配送率を誇り、これにより一般市民や規制当局の信頼を維持しています。パイプライン、ターミナル、鉄道事業者は、積載サイクルを45分に短縮する積載センサーの導入を加速しており、安全性を損なうことなくより大きな処理能力を実現しています。メキシコ湾岸およびアジア太平洋地域の港湾における容量拡張が継続しており、荷主は付加価値サービス契約内で危険液体バルク貨物をコンテナ化された危険物と組み合わせることを促進しています。これらの複合的な要因が相まって、危険物物流市場における潜在的な需要を拡大しています。
厳格化するマルチモーダル安全規制と監査
各国政府は規制違反に対する罰則を強化しており、物流事業者は認証機器の導入と従業員研修への投資を迫られています。PHMSA(米国パイプライン・危険物安全局)は2025年より民事罰金を1日あたり10万米ドル以上に引き上げ、鉄道事業者はFAST法(危険物輸送安全強化法)の義務に基づき、緊急対応機関へ電子編成データを提出する必要があります。この10年間の総費用は1,770万米ドルと見積もられています。国連モデル規則との越境調和により、荷主は年間5,000万~1億3,000万米ドルの書類作業を削減できると同時に、クラス7放射性物質の通関時間を短縮できます。欧州のADR 2023では、テトラメチルアンモニウム水酸化物および再生プラスチック製IBCに対する規制が強化され、輸送事業者はコンテナ内張り材とガスケットの更新を迫られています。主要メーカーによる衛星追跡システムとATEX認証センサーの導入により、700基のタンクコンテナにおける温度・圧力データの継続的記録が確保され、コンプライアンスがさらに強化されています。監督体制が強化される中、リスク管理プロトコルを組み込んだ企業は、危険物物流市場全体で競争優位性を獲得しています。
管轄区域を跨ぐコンプライアンスの複雑性
各国ごとの規制のパッチワークにより、運送業者は複数の書類制度、訓練スケジュール、包装コードを習得せざるを得ません。米国は国連基準に準拠しつつも、自国固有のタンク車仕様を維持しており、外国のフリートには改造コストが追加されます。中国のGB 6944-2012分類はADRと異なるため、深センからロッテルダムへの輸送時には包装の変換が必要となります。欧州で検討中のPFAS規制は、企業が代替化学物質を急いで探す中、半導体やプリント基板のサプライチェーンを混乱させる可能性があります。運転手の危険物取扱資格時間、書類の言語規則、緊急連絡手順の差異は、滞留料金やバッファ在庫の増加につながります。そのため物流事業者は並行してコンプライアンスチームを維持しており、これが間接費を膨らませ、危険物物流市場内での新規貿易ルートの導入を遅らせています。
セグメント分析
輸送は依然として中核を担い、2025年の危険物物流市場収益の66.42%を占めます。事業者は専用タンクローリー、ステンレス製ISOタンク、耐圧式鉄道車両、特殊貨物航空機を運用し、これらによりクラス1爆発物、クラス2ガス、クラス3可燃物の輸送をほぼ完璧な安全実績で保証しています。輸送量の伸びは安定している一方、荷主企業は点対点輸送を超えた統合サービスの需要を増加させています。この変化が、付加価値セグメントが2031年までにCAGR7.56%を記録する理由であり、現場でのラベル貼付、キット組立、通関業務、規制コンサルティングへの需要を反映しています。例えば医療企業は、GDP検査を満たすデータロガー記録機能を備えたエンドツーエンドのコールドチェーン経路を必要とします。化学メーカーも同様に、SDS更新や多言語危険文書作成を外部委託し、中核的な生産業務に集中しています。IoTセンサーパッケージ、ブロックチェーンタイムスタンプ、AIリスクスコアリングエンジンはプレミアム契約に組み込まれ、可視性の向上と積極的な例外管理を実現します。分離ベイ、防爆型空調設備、不活性ガス消火システムを備えた専門倉庫への投資は、反応性貨物の長期保管を可能にします。これらの機能の統合により、顧客の定着率が向上し、危険物物流市場における持続的な収益成長を支えています。
倉庫・流通サービスは、互換性のない品目を同一施設内で法令準拠保管することで輸送を補完します。施設にはLIDAR搭載のロボットパレット搬送機を導入し火花発生を防止。リアルタイムガス検知器が蒸気濃度がOSHA基準値に近づくと自動換気を作動させます。地域配送モデルは最終配送距離を短縮し、厳密な温度管理を要する生物製剤にとって不可欠です。運送業者は予測分析を活用し、需要集積地に近い在庫配置を実現。これにより廃棄リスク低減とリードタイム短縮を達成しています。鉄道会社はタンク車到着から中間バルクコンテナ(IBC)への充填を接続するバルクトランスロードハブを推進し、冗長な長距離道路輸送を排除しています。顧客がスコープ3の炭素削減目標を追求する中、物流プロバイダーは製造段階から出荷までの埋め込み排出量を定量化するライフサイクルアセスメントダッシュボードを導入しています。これらの指標はサステナビリティ報告書に反映され、ベンダー選定基準に影響を与えます。これらの動向が相まって付加価値サービスの成長を支え、危険物物流市場が単なる輸送業務から高収益・データ豊富なソリューションへと進化し続けることを保証しています。
地域別分析
北米は規制対象パイプライン330万マイル、統合された鉄道網、高度な緊急対応インフラを背景に、危険物物流市場で最大のシェアを占めております。BNSFやユニオン・パシフィックなどの主要鉄道会社は、99.999%の事故ゼロ記録を維持し、安全投資と予防保全の文化を体現しております。米国とカナダの回廊では、調和されたプラカードコードと共有データポータルを活用し通関を迅速化しています。一方、米国とメキシコの回廊では、三カ国間貿易円滑化プログラムのもと優先的なアップグレードが進められています。運送事業者は自動化予算を線路沿いの欠陥検出装置、予知保全AI、連邦鉄道局(FRA)承認のブレーキ健全性分析に配分し、これらを総合的に活用することでダウンタイムを削減しています。立法府は港湾におけるゼロエミッション・ドレイジトラックへの助成金を推進し、荷主が危険物輸送の規制適合性を損なうことなくカーボンフットプリントを縮小できるよう支援しております。
欧州は第二の主要地域として、厳格なADR規定と低炭素マルチモーダル回廊推進政策によって形成されています。鉄道貨物事業者は、煩雑な行政手続きを伴わない国境を越えた機関車交換を可能にする「単一欧州鉄道圏」構想を活用しています。ロッテルダムやアントワープなどの港湾ではクラス7同位体専用バンカーを提供し、内陸水路では蒸気回収装置を備えた二重船殻バージでクラス3液体を輸送しています。欧州グリーンディールは道路から鉄道・内陸水路へのモーダルシフトを促進しており、運送事業者は両プラットフォームに対応する45フィートスワップボディへの投資で対応しています。DSVによるシェンカー社143億ユーロ(157億8,000万米ドル)の買収は、90カ国に及ぶネットワーク密度を強化し、多国籍荷主への広範なサービス提供を保証します。事業者らはまた、ユーロVII規制案への適合を目指し、水素燃料の幹線輸送トラックの試験運用を進めており、危険物物流市場における欧州の技術インキュベーターとしての役割を示しています。
アジア太平洋地域は中国、東南アジア、インドにおける産業拡大に牽引され、最も速い成長ペースを示しています。中国は規制体制の近代化を継続し、第2種ボンベ輸送車へのテレマティクス搭載義務化を実施するとともに、危険物輸送ルート沿いに分離型サービスエリアを整備しています。インドは滞留時間を短縮した危険物列車と電化牽引に対応する専用貨物回廊に投資。日本の港湾では防爆バッテリー搭載の無人搬送車(AGV)が導入され、船舶のターンアラウンド時間を短縮しています。製造業者は供給拠点を多様化し、電子機器や電池生産の一部をベトナムやタイへ移転させており、これが地域における適合物流の需要を加速させています。オーストラリアと韓国は、化学工業団地をオンプレミス消防隊やデジタルツインシミュレーションでアップグレードし、対応能力を強化しています。これらの取り組みが相まって、アジア太平洋地域の参加企業の競争力を強化し、危険物物流市場への総収益貢献を拡大しています。
その他の特典:
- エクセル形式の市場予測(ME)シート
- アナリストによる3ヶ月間のサポート
よくあるご質問
目次
第1章 イントロダクション
- 調査の前提条件と市場の定義
- 調査範囲
第2章 調査手法
第3章 エグゼクティブサマリー
第4章 市場情勢
- 市場概要
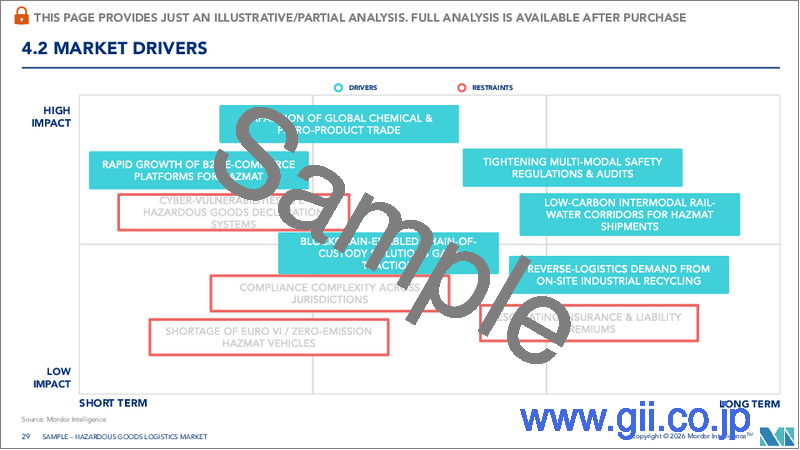
- 市場促進要因
- 世界の化学品・石油製品貿易の拡大
- 厳格化するマルチモーダル輸送の安全規制と監査
- 危険物向けB2B電子商取引プラットフォームの急速な成長
- ブロックチェーンを活用した管理連鎖ソリューションが注目を集めております
- 危険物輸送のための低炭素型鉄道・水路複合輸送回廊
- 産業現場におけるリサイクルからのリバースロジスティクス需要
- 市場抑制要因
- 管轄区域を跨いだコンプライアンスの複雑性
- 保険および賠償責任保険料の急騰
- ユーロ6/ゼロエミッション危険物輸送車両の不足
- 電子危険物申告システムにおけるサイバー脆弱性
- バリュー/サプライチェーン分析
- 規制情勢
- テクノロジーの展望
- 利害関係者マッピング(3PL事業者、通関業者、運送会社、アドバイザー)
- 書類及び許可要件
- 機器・付属品(IBC、UNドラム、追跡センサー)
- 危険物輸送におけるリスク評価
- 包装に関する知見
- 市場における地政学的イベントの影響
- ポーターのファイブフォース
- 供給企業の交渉力
- 買い手の交渉力
- 新規参入業者の脅威
- 代替品の脅威
- 競争企業間の敵対関係
第5章 市場規模と成長予測
- サービス別
- 交通機関
- 道路
- 鉄道
- 航空
- 海上および内陸水路
- 倉庫保管・配送
- 付加価値サービス(ラベリング、キッティング、コンサルティング)
- 交通機関
- 目的地別
- 国内
- 国際/越境
- 最終用途産業別
- 石油・ガス
- 化学品・石油化学製品
- ヘルスケア・製薬
- 農業・肥料
- 鉱業・金属
- エネルギー・公益事業
- 製造業(電子機器、自動車など)
- 廃棄物管理・リサイクル
- その他
- 地域
- 北米
- 米国
- カナダ
- メキシコ
- 南米
- ブラジル
- ペルー
- チリ
- アルゼンチン
- その他南米
- アジア太平洋地域
- インド
- 中国
- 日本
- オーストラリア
- 韓国
- 東南アジア(シンガポール、マレーシア、タイ、インドネシア、ベトナム、フィリピン)
- その他アジア太平洋地域
- 欧州
- 英国
- ドイツ
- フランス
- スペイン
- イタリア
- ベネルクス(ベルギー、オランダ、ルクセンブルク)
- 北欧諸国(デンマーク、フィンランド、アイスランド、ノルウェー、スウェーデン)
- その他欧州地域
- 中東・アフリカ
- アラブ首長国連邦
- サウジアラビア
- 南アフリカ
- ナイジェリア
- その他中東・アフリカ地域
- 北米
第6章 競合情勢
- 市場集中度
- 戦略的動向
- 市場シェア分析
- 企業プロファイル
- Deutsche Post DHL Group
- DSV
- CEVA Logistics
- Bollore Logistics
- DGD Transport
- Toll Group
- YRC Worldwide(USF HazMat)
- Hellmann Worldwide Logistics
- Kuehne+Nagel
- XPO Logistics
- GEODIS
- Rhenus Logistics
- FedEx Custom Critical
- UPS Healthcare/Hazmat
- C.H. Robinson
- Nippon Express
- Sinotrans
- Kintetsu World Express
- GXO Logistics
- SNCF Geodis Rail Freight*

