|
|
市場調査レポート
商品コード
1570614
危険物ロジスティクス市場、機会、成長促進要因、産業動向分析と予測、2024年~2032年Hazardous Goods Logistics Market, Opportunity, Growth Drivers, Industry Trend Analysis and Forecast, 2024-2032 |
||||||
カスタマイズ可能
|
|||||||
| 危険物ロジスティクス市場、機会、成長促進要因、産業動向分析と予測、2024年~2032年 |
|
出版日: 2024年08月03日
発行: Global Market Insights Inc.
ページ情報: 英文 240 Pages
納期: 2~3営業日
|
全表示
- 概要
- 目次
世界の危険物ロジスティクス市場の2023年の市場規模は2,373億米ドルで、2024年から2032年までのCAGRは5.6%以上で成長すると予測されています。
この成長は、世界貿易と国際サプライチェーンの拡大によるところが大きいです。企業がますます世界化し、多様な国から材料を調達するようになるにつれて、国境を越えた危険物の輸送は近年顕著に増加しています。
さらに、危険物の輸送と取り扱いをめぐる厳しい規制が市場を大きく後押ししています。米国の運輸省(DOT)、欧州連合(EU)のADR、国際海事機関(IMO)などの規制機関がガイドラインを制定しています。これらは、危険物の安全な取り扱い、保管、輸送を確保し、潜在的な事故や環境への害を防ぐことを目的としています。ロジスティクス・プロバイダーにとって、これらの規制を遵守することは最も重要です。それは危険物の効率的な管理を保証するだけでなく、より安全で持続可能なロジスティクスを促進します。
危険物ロジスティクス産業は、輸送モード、サービス、製品クラス、オペレーションタイプ、エンドユーザー、地域に分けられます。
輸送形態に基づく市場セグメントには、鉄道貨物、航空貨物、海上貨物、道路が含まれます。2023年には、海上貨物部門が約1,550億米ドルを占めています。海上貨物部門の成長は、世界貿易の急増に大きく牽引されています。費用対効果の高いソリューションを提供する海上貨物は、大量の危険物を長距離輸送するのに適しています。世界経済の拡大と国際貿易の激化に伴い、海上貨物サービスの需要が高まっています。この動向は、危険物を日常的に管理する化学、石油・ガス、医薬品などの分野で特に顕著です。
市場は、事業を国内セグメントと国際セグメントに分類しています。2032年までに、国内セグメントは2,730億米ドルを超えると予測されています。サプライチェーン、特に危険物を含むサプライチェーンを扱うには、高度なロジスティクス・ソリューションが必要となります。このプロセスに不可欠なのは、メーカー、輸送業者、規制当局間の調整です。企業は追跡システムを採用し、文書を綿密に管理し、さまざまな地域の規制を確実に遵守しています。こうした業務を円滑化し、危険物のスムーズな輸送を確保するため、多くの企業が専用のソフトウェア・ソリューションに注目しています。
北米は危険物ロジスティクス市場をリードし、2023年には約34%のシェアを占めました。この地域の優位性は、米国運輸省(DOT)や環境保護庁(EPA)のような極めて重要な機関による厳しい規制によるところが大きいです。これらの規制は、危険物の安全な輸送、取り扱い、保管を優先し、公衆衛生と環境の保護を強調しています。その結果、ロジスティクス・プロバイダーは高度な安全プロトコルと技術の採用を余儀なくされています。さらに、貿易協定、特に北米自由貿易協定(NAFTA)とその後継協定である米国・メキシコ・カナダ協定(USMCA)は、国境を越えた貿易を強化し、地域内の危険物輸送をさらに増大させています。
目次
第1章 調査手法と調査範囲
第2章 エグゼクティブサマリー
第3章 業界洞察
- エコシステム分析
- サプライヤーの状況
- 危険物メーカー
- ロジスティクス・プロバイダー
- 技術プロバイダー
- エンドユーザー
- 利益率分析
- 技術とイノベーションの展望
- 特許分析
- 主要ニュースとイニシアチブ
- 規制状況
- 影響要因
- 促進要因
- 世界貿易と国際サプライチェーンの拡大
- 危険物輸送に関する厳しい規制
- ロジスティクス業界の技術進歩
- eコマースの拡大
- 業界の潜在的リスク&課題
- 危険物に関連する安全リスク
- 高い保険料と賠償責任費用
- 促進要因
- 成長可能性分析
- ポーター分析
- PESTEL分析
第4章 競合情勢
- イントロダクション
- 企業シェア分析
- 競合のポジショニング・マトリックス
- 戦略展望マトリックス
第5章 市場推計・予測:輸送モード別、2021年~2032年
- 主要動向
- 鉄道貨物
- 航空貨物
- 海上貨物
- 道路貨物
第6章 市場推計・予測:サービス別、2021年~2032年
- 主要動向
- 倉庫・保管
- 輸送
- 規制対応
- パッケージング
- その他
第7章 市場推計・予測:製品クラス別、2021年~2032年
- 主要動向
- 可燃性ガス
- 可燃性液体
- 可燃性固体
- 酸化性物質
- 放射性物質
- 腐食性物質
- その他
第8章 市場推計・予測:オペレーションタイプ別、2021年~2032年
- 主要動向
- 国内
- 海外
第9章 市場推計・予測:エンドユーザー別、2021年~2032年
- 主要動向
- 航空宇宙・防衛
- バイオ医薬品・ライフサイエンス
- 鉱業
- 自動車
- 化学
- エネルギー・電力
- その他
第10章 市場推計・予測:地域別、2021年~2032年
- 主要動向
- 北米
- 米国
- カナダ
- 欧州
- 英国
- ドイツ
- フランス
- イタリア
- スペイン
- ロシア
- 北欧
- その他欧州
- アジア太平洋
- 中国
- インド
- 日本
- 韓国
- ニュージーランド
- 東南アジア
- その他アジア太平洋地域
- ラテンアメリカ
- ブラジル
- メキシコ
- アルゼンチン
- その他ラテンアメリカ
- 中東・アフリカ
- 南アフリカ
- サウジアラビア
- アラブ首長国連邦
- その他中東・アフリカ
第11章 企業プロファイル
- Agility Logistics
- CMA CGM Group
- Dangerous Goods International
- DB SCHENKER
- DHL Group
- DSV
- Hazardous Good Logistics
- Hellmann Worldwide Logistics
- Kerry Logistics
- Kuehne+Nagel
- Rhenus Group
- SEKO Logistics
- United Parcel Service of America, Inc.
- XPO, Inc.
- YCH Group
- YUSEN LOGISTICS CO., LTD.
The Global Hazardous Goods Logistics Market was valued at USD 237.3 billion in 2023 and is projected to grow at a CAGR of over 5.6% from 2024 to 2032. This growth is largely attributed to the expansion of global trade and international supply chains. As companies increasingly globalize and source materials from diverse countries, the transportation of hazardous goods across borders has seen a notable uptick in recent years.
Furthermore, the market is significantly propelled by stringent regulations surrounding the transportation and handling of hazardous goods. Regulatory bodies, including the Department of Transportation (DOT) in the U.S., the European Union's ADR, and the International Maritime Organization (IMO), have established guidelines. These aim to ensure the safe handling, storage, and transportation of hazardous materials, thus preventing potential accidents and environmental harm. For logistics providers, adhering to these regulations is paramount. It not only ensures efficient management of hazardous goods but also promotes a safer and more sustainable logistics landscape.
The hazardous goods logistics industry is divided into transportation mode, service, product class, type of operation, end user, and region.
The market segments based on transportation mode include rail freight, air, sea, and road. In 2023, the sea freight segment accounted for approximately USD 155 billion. The sea freight sector's growth is significantly driven by the surge in global trade. Offering a cost-effective solution, sea freight is preferred for transporting large volumes of hazardous materials over extended distances. With the expansion of global economies and the intensification of international trade, the demand for sea freight services has risen. This trend is especially pronounced in sectors like chemicals, oil and gas, and pharmaceuticals, which routinely manage hazardous materials.
The market categorizes operations into domestic and international segments. By 2032, the domestic segment is projected to surpass USD 273 billion. Handling supply chains, particularly those involving hazardous goods, necessitates sophisticated logistics solutions. Essential to this process is the coordination between manufacturers, transporters, and regulatory entities. Companies are adopting tracking systems, managing documentation meticulously, and ensuring compliance with varied regional regulations. To facilitate these operations and ensure a smooth transit of hazardous materials, many firms are turning to specialized software solutions.
North America led the hazardous goods logistics market, commanding roughly 34% share in 2023. The region's dominance is largely due to stringent regulations from pivotal agencies like the U.S. Department of Transportation (DOT) and the Environmental Protection Agency (EPA). These regulations prioritize the safe transportation, handling, and storage of hazardous materials, underscoring the protection of public health and the environment. Consequently, logistics providers are compelled to adopt advanced safety protocols and technologies. Moreover, trade agreements, notably the North American Free Trade Agreement (NAFTA) along with its successor, the United States-Mexico-Canada Agreement (USMCA), have bolstered cross-border trade, further amplifying the transportation of hazardous materials within the region.
Table of Contents
Chapter 1 Methodology and Scope
- 1.1 Research design
- 1.1.1 Research approach
- 1.1.2 Data collection methods
- 1.2 Base estimates and calculations
- 1.2.1 Base year calculation
- 1.2.2 Key trends for market estimation
- 1.3 Forecast model
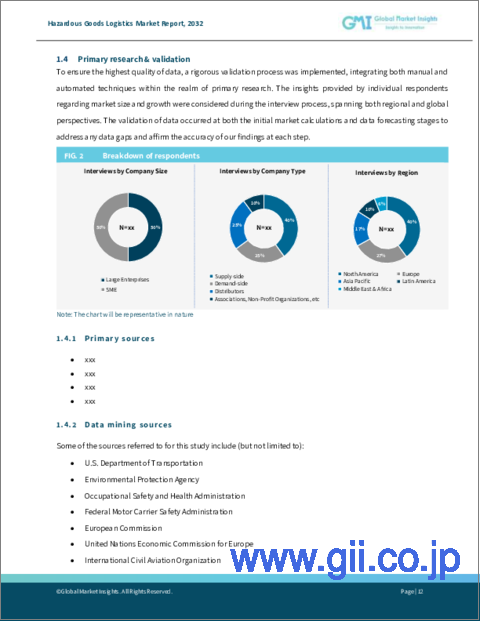
- 1.4 Primary research and validation
- 1.4.1 Primary sources
- 1.4.2 Data mining sources
- 1.5 Market scope and definition
Chapter 2 Executive Summary
- 2.1 Industry 360° synopsis, 2021 - 2032
Chapter 3 Industry Insights
- 3.1 Industry ecosystem analysis
- 3.2 Supplier landscape
- 3.2.1 Hazardous goods manufacturers
- 3.2.2 Logistics providers
- 3.2.3 Technology providers
- 3.2.4 End-user
- 3.3 Profit margin analysis
- 3.4 Technology and innovation landscape
- 3.5 Patent analysis
- 3.6 Key news and initiatives
- 3.7 Regulatory landscape
- 3.8 Impact forces
- 3.8.1 Growth drivers
- 3.8.1.1 Expansion of global trade and international supply chains
- 3.8.1.2 Stringent regulations governing the transportation of hazardous goods
- 3.8.1.3 Technological advancements in the logistics industry
- 3.8.1.4 Expansion of E-commerce
- 3.8.2 Industry pitfalls and challenges
- 3.8.2.1 Safety risks associated with hazardous goods
- 3.8.2.2 High insurance and liability costs
- 3.8.1 Growth drivers
- 3.9 Growth potential analysis
- 3.10 Porter's analysis
- 3.11 PESTEL analysis
Chapter 4 Competitive Landscape, 2023
- 4.1 Introduction
- 4.2 Company market share analysis
- 4.3 Competitive positioning matrix
- 4.4 Strategic outlook matrix
Chapter 5 Market Estimates and Forecast, By Transportation Mode, 2021 - 2032 ($Bn, 000' tons)
- 5.1 Key trends
- 5.2 Rail freight
- 5.3 Air freight
- 5.4 Sea freight
- 5.5 Road freight
Chapter 6 Market Estimates and Forecast, By Service, 2021 - 2032 ($Bn, 000' tons)
- 6.1 Key trends
- 6.2 Warehousing and storage
- 6.3 Transportation
- 6.4 Regulatory compliance
- 6.5 Packaging
- 6.6 Others
Chapter 7 Market Estimates and Forecast, By Product Class, 2021 - 2032 ($Bn, 000' tons)
- 7.1 Key trends
- 7.2 Flammable gases
- 7.3 Flammable liquids
- 7.4 Flammable solids
- 7.5 Oxidizing substances
- 7.6 Radioactive substances
- 7.7 Corrosives
- 7.8 Others
Chapter 8 Market Estimates and Forecast, By Type of Operation, 2021 - 2032 ($Bn, 000' tons)
- 8.1 Key trends
- 8.2 Domestic
- 8.3 International
Chapter 9 Market Estimates and Forecast, By End User, 2021 - 2032 ($Bn, 000' tons)
- 9.1 Key trends
- 9.2 Aerospace and defense
- 9.3 Biopharma and life sciences
- 9.4 Mining
- 9.5 Automotive
- 9.6 Chemicals
- 9.7 Energy and power
- 9.8 Others
Chapter 10 Market Estimates and Forecast, By Region, 2021 - 2032 ($Bn, 000' tons)
- 10.1 Key trends
- 10.2 North America
- 10.2.1 U.S.
- 10.2.2 Canada
- 10.3 Europe
- 10.3.1 UK
- 10.3.2 Germany
- 10.3.3 France
- 10.3.4 Italy
- 10.3.5 Spain
- 10.3.6 Russia
- 10.3.7 Nordics
- 10.3.8 Rest of Europe
- 10.4 Asia Pacific
- 10.4.1 China
- 10.4.2 India
- 10.4.3 Japan
- 10.4.4 South Korea
- 10.4.5 ANZ
- 10.4.6 Southeast Asia
- 10.4.7 Rest of Asia Pacific
- 10.5 Latin America
- 10.5.1 Brazil
- 10.5.2 Mexico
- 10.5.3 Argentina
- 10.5.4 Rest of Latin America
- 10.6 MEA
- 10.6.1 South Africa
- 10.6.2 Saudi Arabia
- 10.6.3 UAE
- 10.6.4 Rest of MEA
Chapter 11 Company Profiles
- 11.1 Agility Logistics
- 11.2 CMA CGM Group
- 11.3 Dangerous Goods International
- 11.4 DB SCHENKER
- 11.5 DHL Group
- 11.6 DSV
- 11.7 Hazardous Good Logistics
- 11.8 Hellmann Worldwide Logistics
- 11.9 Kerry Logistics
- 11.10 Kuehne+Nagel
- 11.11 Rhenus Group
- 11.12 SEKO Logistics
- 11.13 United Parcel Service of America, Inc.
- 11.14 XPO, Inc.
- 11.15 YCH Group
- 11.16 YUSEN LOGISTICS CO., LTD.


