
シェールガス-市場シェア分析、産業動向・統計、成長予測(2025年~2030年)
Shale Gas - Market Share Analysis, Industry Trends & Statistics, Growth Forecasts (2025 - 2030)- 発行日
- ページ情報
- 英文 125 Pages
- 納期
- 2~3営業日
- 商品コード
- 1630309
- カスタマイズ可能 お客様のご希望に応じて、既存データの加工や未掲載情報(例:国別セグメント)の追加などの対応が可能です。詳細はお問い合わせください。
- 適宜更新あり 本レポートは最新情報反映のため適宜更新し、内容構成変更を行う場合があります。ご検討の際はお問い合わせください。
- 翻訳ツール提供対象 PDF対応AI翻訳ツールの無料貸し出しサービスのご利用が可能です
概要
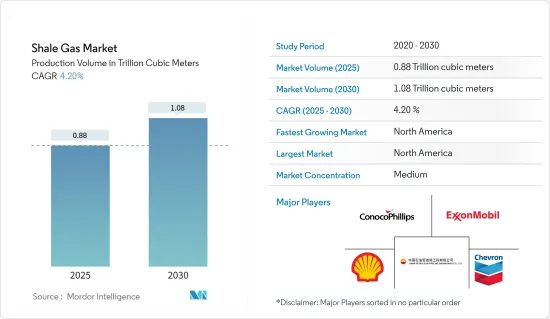
生産量ベースのシェールガス市場規模は、2025年の8,800億立方メートルから2030年には1兆800億立方メートルに拡大し、予測期間中(2025~2030年)のCAGRは4.2%と予測されます。
主要ハイライト
- 中期的には、証明されたシェールガスの埋蔵量や、水平掘削や水圧破砕における最近の技術介入といった要因が、長期的には市場を牽引すると予想されます。
- 一方、価格がシェールガスの生産コストを下回る石油市場の不安定さと探査コストの高さは、市場の2つの重大な抑制要因です。
- 新たなシェールガスの埋蔵量が発見されれば、将来的に市場にいくつかの機会が生まれると予想されます。
- 北米は、シェールガスの大規模生産により、予測期間中最大の市場になると予想されます。米国が同地域のシェールガス生産をリードすると予想されます。
シェールガス市場動向
環境問題の高まりが市場を抑制
- 掘削プロセスにおけるメタンガスの排出は、潜在的な大気汚染リスクをもたらします。さらに、水圧破砕作業で使用される大量の化学処理水の不適切な廃棄は、深刻な地表水汚染を引き起こす可能性があります。このことは、世界中の環境保護団体やNGOから批判を集めています。健康や農業への影響から、地元の農業従事者や住民は繰り返し水圧破砕に反対してきました。
- さらに、典型的な水圧破砕坑井では、水圧破砕作業中に約200万~1,000万ガロンの水を必要とするため、特に干ばつに見舞われやすい地域では、水供給にさらなる負担がかかります。
- 2022年、北米とアジア太平洋は、世界で最も二酸化炭素排出量が多い地域となりました。一方、欧州、中東・アフリカの二酸化炭素排出量は最も少ないです。化石燃料と産業からの世界の二酸化炭素排出量は、2022年には合計371億5,000万トンになります。2023年の排出量は1.1%増加し、過去最高の375億5,000万トンに達すると予測されています。1990年以来、世界のCO2排出量は60%以上増加しています。
- 最近、パーミアン盆地(米国でシェールガスの成長を牽引すると期待されている)のある米国西部テキサス州では、シェールガス会社が水不足による農業従事者からの反対や批判に直面しました。
- 米国地質調査所(USGS)は、石油・ガス採掘で有名な米国中東部の一部地域で最近地震が増加しているのはシェールガス活動のせいだと非難しました。
- このように、環境問題への懸念の高まりが、予測期間中の市場を抑制すると予想されます。
市場を独占する北米
- 米国は世界最大のシェールガス生産国です。ブラジル、カナダ、中国、アルゼンチンなど、さまざまな国がアメリカのシェールブームを模倣しようとしているが、成功には至っていないです。しかし、中国では大きな進展があったが、不安定な貯留層がもたらす困難のため、シェールガスの生産量は予測期間中にわずかな増加にとどまる可能性があります。
- 米国エネルギー情報局(EIA)によると、2022年の米国のシェール層からのドライ天然ガス生産量は約28兆5,000億立方フィート(Tcf)で、米国のドライ天然ガス生産量全体の約80%に相当します。
- カナダは在来型ガスの埋蔵量が多いことで知られ、最近のシェールブームが起こるまで、数十年にわたり米国への天然ガスの主要供給国でした。しかし、在来型の天然ガス源が減少しているため、カナダの産業はシェールガスを含む非在来型の天然ガス源に目を向けています。現在、多くの石油・ガス会社がアルバータ州、ブリティッシュ・コロンビア州、ケベック州、ニューブランズウィック州でシェールガス資源の探査・開発を進めており、近い将来、シェールガス生産量の差は均衡する可能性があります。
- エネルギー情報機関(EIA)の推定予測によると、この地域の現在のシナリオは、予測期間中により多くの天然ガス供給を必要とする可能性があり、それがシェールガスの探査・生産への投資を呼び込む可能性があります。
- したがって、北米大陸でのシェールガスの圧倒的な生産量により、北米が市場を独占すると予想されます。
シェールガス産業概要
シェールガス市場は半セグメント化しています。この市場の主要企業(順不同)には、Chesapeake Energy Corporation、Shell PLC、Exxon Mobil Corporation、PetroChina Company Limited、ConocoPhillips Companyなどがあります。
その他の特典
- エクセル形式の市場予測(ME)シート
- 3ヶ月間のアナリストサポート
目次
第1章 イントロダクション
- 調査範囲
- 市場の定義
- 調査の前提
第2章 調査手法
第3章 エグゼクティブサマリー
第4章 市場概要
- イントロダクション
- 2029年までのシェールガス生産量と予測
- 最近の動向と開発
- 政府の規制と施策
- 市場力学
- 促進要因
- 実績のあるシェールガス埋蔵量
- 水平掘削と水圧破砕の技術進歩
- 抑制要因
- 高い探査コスト
- 促進要因
- サプライチェーン分析
- ポーターファイブフォース
- 供給企業の交渉力
- 消費者の交渉力
- 新規参入業者の脅威
- 代替品の脅威
- 競争企業間の敵対関係の強さ
第5章 市場セグメンテーション
- 地域
- 北米
- 米国
- カナダ
- その他の北米
- 南米
- ブラジル
- アルゼンチン
- チリ
- コロンビア
- その他の南米
- アジア太平洋
- 中国
- インド
- 日本
- オーストラリア
- マレーシア
- タイ
- インドネシア
- ベトナム
- その他のアジア太平洋
- 欧州
- ドイツ
- フランス
- 英国
- イタリア
- スペイン
- ノルディック
- トルコ
- ロシア
- その他の欧州
- 中東・アフリカ
- アラブ首長国連邦
- サウジアラビア
- カタール
- 南アフリカ
- ナイジェリア
- エジプト
- 北米
第6章 競合情勢
- M&A、合弁事業、提携、協定
- 主要企業の戦略
- 企業プロファイル
- Antero Resources Corp.
- Southwestern Energy Company
- EQT Corporation
- Equinor ASA
- Repsol SA
- China Petroleum & Chemical Corporation(SINOPEC)
- Chesapeake Energy Corporation
- Shell PLC
- Exxon Mobil Corporation
- Chevron Corporation
- PetroChina Company Limited
- ConocoPhillips Company
- Pioneer Natural Resources
- Market Player Ranking
第7章 市場機会と今後の動向
- 新たなシェールガス埋蔵量の発見
目次
Product Code: 67285
The Shale Gas Market size in terms of production volume is expected to grow from 0.88 trillion cubic meters in 2025 to 1.08 trillion cubic meters by 2030, at a CAGR of 4.2% during the forecast period (2025-2030).
Key Highlights
- Over the medium term, factors such as proved shale gas reserves and the recent technological interventions in horizontal drilling and hydraulic fracturing are expected to drive the market in the long term.
- On the other hand, volatility in the oil market with prices below the shale gas production cost and high exploration cost are two critical restraints in the market.
- Nevertheless, the discovery of new shale gas reserves are expected to create several opportunities for the market in the future.
- North America is expected to be the largest market in the forecast period, owing to its large-scale production of shale gas in the region. The United States is expected to lead shale gas production in the area.
Shale Gas Market Trends
Increasing Environmental Concerns to Restrain the Market
- Methane gas emissions during the drilling process pose potential air pollution risks. Additionally, incorrect disposal of large volumes of chemically treated water used in hydraulic fracturing operations can potentially cause severe surface water contamination. This has attracted criticism from environmental protection bodies and NGOs around the world. Due to its impact on health and farming, local farmers and residents have repeatedly opposed hydraulic fracturing.
- Additionally, a typical fracking well requires approximately 2-10 million gallons of water during fracking operations, which puts additional strain on the water supply, particularly in drought-prone regions.
- In 2022, North America and Asia-Pacific recorded the world's highest carbon dioxide emissions. While Europe, the Middle East, and Africa tend to have the lowest emission. The global carbon dioxide emissions from fossil fuels and industry totaled 37.15 billion metric tons in 2022. Emissions are projected to increase by 1.1 percent in 2023 to reach a record high of 37.55 billion metric tons. Since 1990, global CO2 emissions have increased by more than 60 percent.
- Recently in West Texas of the United States, where the Permian Basin (expected to drive the growth of shale gas activities in the United States) is located, shale gas companies faced opposition and criticism from the farmers due to the water shortage.
- The United States Geological Survey (USGS) blamed shale gas activities for the increase in earthquakes in recent times in certain parts of the Central and Eastern United States that are well-known for oil and gas extraction.
- Thus, the increasing environmental concerns are expected to restrain the market during the forecast period.
North America to Dominate the Market
- The United States is the largest producer of shale gas in the world. Different countries, such as Brazil, Canada, China, and Argentina, have tried to emulate the American shale boom but have not been able to succeed. However, large progress has been made in China, but due to the difficulties posed by the unstable reservoirs, shale gas production may only rise slightly in the forecast period.
- According to U.S. Energy Information Administration (EIA) in 2022, U.S. dry natural gas production from shale formations was about 28.5 trillion cubic feet (Tcf) and equal to about 80% of total U.S. dry natural gas production in 2022.Shale gas production may increase further due to new wells being drilled across the country.
- While Canada is known to have significant conventional gas reserves, and the country was a key supplier of natural gas to the United States for decades until the recent shale boom in the country. However, with conventional natural gas sources in decline, Canada's industry is turning to unconventional sources, including shale gas. Many oil and gas companies are now exploring and developing shale gas resources in Alberta, British Columbia, Quebec, and New Brunswick, which may balance the difference in shale gas production in the coming future.
- An Energy Information Agency (EIA) estimation shows that the current scenario of the region may demand more natural gas supply during the forecast period, which may attract investment in the exploration and production of shale gas.
- Hence, North America is expected to dominate the market due to the overwhelming production of shale on the continent.
Shale Gas Industry Overview
The shale gas market is semi fragmented. Some of the key players in this market (in no particular order) includes Chesapeake Energy Corporation, Shell PLC, Exxon Mobil Corporation, PetroChina Company Limited, and ConocoPhillips Company, among others.
Additional Benefits:
- The market estimate (ME) sheet in Excel format
- 3 months of analyst support
TABLE OF CONTENTS
1 INTRODUCTION
- 1.1 Scope of the Study
- 1.2 Market Definition
- 1.3 Study Assumptions
2 RESEARCH METHODOLOGY
3 EXECUTIVE SUMMARY
4 MARKET OVERVIEW
- 4.1 Introduction
- 4.2 Shale Gas Production and Forecast, until 2029
- 4.3 Recent Trends and Developments
- 4.4 Government Policies and Regulations
- 4.5 Market Dynamics
- 4.5.1 Drivers
- 4.5.1.1 Proven Shale Gas Reserves
- 4.5.1.2 Technological Advancement in Horizontal Drilling and Hydraulic Fracturing
- 4.5.2 Restraints
- 4.5.2.1 High Exploration Cost
- 4.5.1 Drivers
- 4.6 Supply Chain Analysis
- 4.7 Porter Five Forces
- 4.7.1 Bargaining Power of Suppliers
- 4.7.2 Bargaining Power of Consumers
- 4.7.3 Threat of New Entrants
- 4.7.4 Threat of Substitutes Products and Services
- 4.7.5 Intensity of Competitive Rivalry
5 MARKET SEGMENTATION
- 5.1 Geography
- 5.1.1 North America
- 5.1.1.1 United States
- 5.1.1.2 Canada
- 5.1.1.3 Rest of North America
- 5.1.2 South America
- 5.1.2.1 Brazil
- 5.1.2.2 Argentina
- 5.1.2.3 Chile
- 5.1.2.4 Colombia
- 5.1.2.5 Rest of South America
- 5.1.3 Asia-Pacific
- 5.1.3.1 China
- 5.1.3.2 India
- 5.1.3.3 Japan
- 5.1.3.4 Australia
- 5.1.3.5 Malaysia
- 5.1.3.6 Thailand
- 5.1.3.7 Indonesia
- 5.1.3.8 Vietnam
- 5.1.3.9 Rest of Asia-Pacific
- 5.1.4 Europe
- 5.1.4.1 Germany
- 5.1.4.2 France
- 5.1.4.3 United Kingdom
- 5.1.4.4 Italy
- 5.1.4.5 Spain
- 5.1.4.6 NORDIC
- 5.1.4.7 Turkey
- 5.1.4.8 Russia
- 5.1.4.9 Rest of Europe
- 5.1.5 Middle-East and Africa
- 5.1.5.1 United Arab Emirates
- 5.1.5.2 Saudi Arabia
- 5.1.5.3 Qatar
- 5.1.5.4 South Africa
- 5.1.5.5 Nigeria
- 5.1.5.6 Egypt
- 5.1.1 North America
6 COMPETITIVE LANDSCAPE
- 6.1 Mergers and Acquisitions, Joint Ventures, Collaborations, and Agreements
- 6.2 Strategies Adopted by Leading Players
- 6.3 Company Profiles
- 6.3.1 Antero Resources Corp.
- 6.3.2 Southwestern Energy Company
- 6.3.3 EQT Corporation
- 6.3.4 Equinor ASA
- 6.3.5 Repsol SA
- 6.3.6 China Petroleum & Chemical Corporation (SINOPEC)
- 6.3.7 Chesapeake Energy Corporation
- 6.3.8 Shell PLC
- 6.3.9 Exxon Mobil Corporation
- 6.3.10 Chevron Corporation
- 6.3.11 PetroChina Company Limited
- 6.3.12 ConocoPhillips Company
- 6.3.13 Pioneer Natural Resources
- 6.4 Market Player Ranking
7 MARKET OPPORTUNITIES AND FUTURE TRENDS
- 7.1 Discovery of New Shale Gas Reserves
シェールガス-市場シェア分析、産業動向・統計、成長予測(2025年~2030年)
- 発行日
- 発行
- Mordor Intelligence
- ページ情報
- 英文 125 Pages
- 納期
- 2~3営業日