
|
市場調査レポート
商品コード
1445505
グーズベリー: 市場シェア分析、業界動向と統計、成長予測(2024~2029)Global Gooseberry - Market Share Analysis, Industry Trends & Statistics, Growth Forecasts (2024 - 2029) |
||||||
カスタマイズ可能
適宜更新あり
|
|||||||
| グーズベリー: 市場シェア分析、業界動向と統計、成長予測(2024~2029) |
|
出版日: 2024年02月15日
発行: Mordor Intelligence
ページ情報: 英文 70 Pages
納期: 2~3営業日
|

全表示
- 概要
- 目次
概要
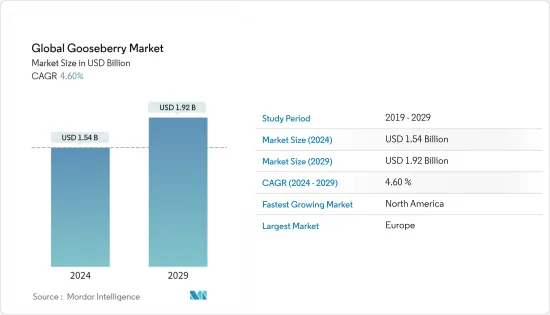
世界のグーズベリー市場規模は、2024年に15億4,000万米ドルと推定され、2029年までに19億2,000万米ドルに達すると予測されており、予測期間(2024年から2029年)中に4.60%のCAGRで成長します。
主なハイライト
- 健康意識の高まりにより、グーズベリーの需要が高まっています。これは、食品・飲料、化粧品・パーソナルケア、栄養補助食品食品業界における新鮮なグーズベリーの広範な使用と相まって、市場の成長を支えています。
- 人々の健康意識の高まりが生のグーズベリーの成長の主な原動力となっています。タンパク質、カリウム、マグネシウム、銅、マンガン、鉄、ビタミンB6など、新鮮なベリーに含まれるさまざまな栄養素の需要が高まっています。一部のベリーには繊維が豊富に含まれており、血糖値の制御に役立ち、消化器系の機能を強化します。新鮮なグーズベリーにはさまざまな健康上の利点があるため、その消費量が増加しています。たとえば、グーズベリーは2型糖尿病の治療に役立ちます。
- さらに、ナチュラルおよびオーガニック化粧品およびパーソナルケアの市場価値は急速に増加しており、化粧品業界におけるグーズベリーの使用量はさらに増加すると予想されています。
グーズベリー市場動向
健康上の利点のためにスグリの消費量が増加
- グーズベリーには、タンパク質、カリウム、マグネシウム、銅、マンガン、鉄、ビタミンB6などの栄養成分が豊富に含まれています。楕円形のグーズベリーは白、赤、黄、緑で、通常はとげのある表面や毛深い表面を持っています。グーズベリーは、幅広い生理活性成分を含むため、食物繊維の豊富な供給源でもあります。ビタミン、繊維、ミネラルの他に、フェノール類、タンニン、フラボノイドなどの生理活性化合物もベリーに含まれています。人々の健康意識と健康維持への欲求の高まりが、ベリーに関連する多くの健康上の利点と相まって、ベリー市場の成長を促進しています。
- グーズベリーの実は健康上の利点があり、がんや心臓病などのさまざまな慢性疾患を予防します。グーズベリーには抗酸化物質が豊富に含まれていますが、ベリーは抗酸化物質のレベルを高め、肥満や2型糖尿病などの代謝性疾患のリスクを軽減します。
- さらに、消費者はより自然で本物のオーガニックで加工度の低い食品を好み、オーガニックベリーの需要が高まっています。有機ベリーの栄養上の利点と、インスタントドリンク(RTD)およびインスタントイート(RTE)製品での使用法についての消費者の意識の高まりが、市場の成長を大きく刺激しています。
欧州が市場を独占
- 欧州はグーズベリーの主要市場であり、世界生産シェアの90%を占めています。欧州およびアメリカのグーズベリー品種は、この地域で広く生産され、消費されています。
- 国内需要と輸出の増加により、生産量は年々増加しています。たとえば、食糧農業機関(FAO)によると、2019年のグーズベリーの生産量は8万512トンで、2021年には90,904.3トンに増加しました。この地域の生産量はロシア、ウクライナ、英国が独占しており、ロシアもその生産量を占めています。 87%に貢献しています。この生産量の増加は輸出につながります。ロシアからのグーズベリーの主な輸出先はウクライナ、カザフスタン、モンゴルであり、総輸出量の99%を占めていました。
- さらに、国内の消費者の健康への懸念も高まっています。国立医学図書館は、ベリー類が体にビタミンCを供給するのに大きく貢献していると述べています。100gの新鮮な果物を食事に含めると、カリウム(アプリコット、グーズベリー、チェリー、ブラックカラント)、マグネシウム(リンゴ、サクランボ、イチゴ)、食物繊維を推奨食事摂取量の約10%が摂取できます。
その他の特典
- エクセル形式の市場予測(ME)シート
- 3か月のアナリストサポート
目次
第1章 イントロダクション
- 調査の前提条件と市場の定義
- 調査範囲
第2章 調査手法
第3章 エグゼクティブサマリー
第4章 市場力学
- 市場概要
- 市場促進要因
- 市場抑制要因
- バリューチェーン/サプライチェーン分析
第5章 市場セグメンテーション
- 地域
- 北米
- 米国
- 生産分析
- 消費分析(量と価値)
- 輸入市場分析(量と金額)
- 輸出市場分析(量と金額)
- 価格動向分析
- カナダ
- 生産分析
- 消費分析(量と価値)
- 輸入市場分析(量と金額)
- 輸出市場分析(量と金額)
- 価格動向分析
- 欧州
- トルコ
- 生産分析
- 消費分析(量と価値)
- 輸入市場分析(量と金額)
- 輸出市場分析(量と金額)
- 価格動向分析
- ドイツ
- 生産分析
- 消費分析(量と価値)
- 輸入市場分析(量と金額)
- 輸出市場分析(量と金額)
- 価格動向分析
- スペイン
- 生産分析
- 消費分析(量と価値)
- 輸入市場分析(量と金額)
- 輸出市場分析(量と金額)
- 価格動向分析
- フランス
- 生産分析
- 消費分析(量と価値)
- 輸入市場分析(量と金額)
- 輸出市場分析(量と金額)
- 価格動向分析
- イタリア
- 生産分析
- 消費分析(量と価値)
- 輸入市場分析(量と金額)
- 輸出市場分析(量と金額)
- 価格動向分析
- アジア太平洋
- オーストラリア
- 生産分析
- 消費分析(量と価値)
- 輸入市場分析(量と金額)
- 輸出市場分析(量と金額)
- 価格動向分析
- ニュージーランド
- 生産分析
- 消費分析(量と価値)
- 輸入市場分析(量と金額)
- 輸出市場分析(量と金額)
- 価格動向分析
- インド
- 生産分析
- 消費分析(量と価値)
- 輸入市場分析(量と金額)
- 輸出市場分析(量と金額)
- 価格動向分析
- インドネシア
- 生産分析
- 消費分析(量と価値)
- 輸入市場分析(量と金額)
- 輸出市場分析(量と金額)
- 価格動向分析
- 南米
- コロンビア
- 生産分析
- 消費分析(量と価値)
- 輸入市場分析(量と金額)
- 輸出市場分析(量と金額)
- 価格動向分析
- エクアドル
- 生産分析
- 消費分析(量と価値)
- 輸入市場分析(量と金額)
- 輸出市場分析(量と金額)
- 価格動向分析
- ブラジル
- 生産分析
- 消費分析(量と価値)
- 輸入市場分析(量と金額)
- 輸出市場分析(量と金額)
- 価格動向分析
- アフリカ
- 南アフリカ
- 生産分析
- 消費分析(量と価値)
- 輸入市場分析(量と金額)
- 輸出市場分析(量と金額)
- 価格動向分析
- ケニア
- 生産分析
- 消費分析(量と価値)
- 輸入市場分析(量と金額)
- 輸出市場分析(量と金額)
- 価格動向分析
- 北米
第6章 市場機会と将来の動向
目次
Product Code: 68084
The Global Gooseberry Market size is estimated at USD 1.54 billion in 2024, and is expected to reach USD 1.92 billion by 2029, growing at a CAGR of 4.60% during the forecast period (2024-2029).
Key Highlights
- The demand for gooseberry is growing due to increasing health awareness. This, coupled with the wide usage of fresh gooseberries in food &beverage, cosmetic &personal care, and dietary supplements industries, supports market growth.
- An increase in health consciousness among people is the key growth driver of fresh gooseberries. Various nutrients in fresh berries, such as protein, potassium, magnesium, copper, manganese, iron, and vitamin B6, are increasing in demand. Some berries are rich in fiber, which helps in blood sugar control and enhances the function of the digestive system. Fresh gooseberries offer various health benefits, due to which their consumption is increasing. For instance, gooseberry helps in curing Type-2 diabetes.
- Additionally, the market value for natural and organic cosmetics and personal care is increasing faster, which is expected to increase the usage of gooseberries in the cosmetics industry even more.
Gooseberry Market Trends
Incresaing Gooseberry Consumption for Health Benefits
- Gooseberries are high in the nutritional content of protein, potassium, magnesium, copper, manganese, iron, and vitamin B6. The oval gooseberries are white, red, yellow, or green, usually with a prickly or hairy surface. Gooseberries are also rich sources of dietary fiber as they possess a wide array of bioactive components. Apart from vitamins, fibers, and minerals, these bioactive compounds, such as phenolics, tannins, and flavonoids, are also present in berries. An increase in health consciousness and desire to stay fit among people, coupled with many health benefits associated with the berries, is fueling the growth of the berries market.
- The gooseberry berries have health benefits and prevent various chronic illnesses like cancer and heart diseases. Gooseberries are rich in antioxidants, whereas berries increase antioxidant levels and reduce the risk of metabolic diseases, including obesity and type-2 diabetes.
- Additionally, consumers prefer more natural, authentic, organic, and less processed food, increasing the demand for organic berries. The increasing awareness among consumers about the nutritional benefits of organic berries and their usage in ready-to-drink (RTD) and ready-to-eat (RTE) products has significantly stimulated market growth.
Europe Dominates the Market
- Europe is the major market for gooseberries, accounting for 90% of the global share in production. European and American gooseberry varieties are widely produced and consumed in the region.
- Due to the increased domestic demand and exports, production has increased over the years. For instance, according to Food and Agriculture Organization (FAO), the production of gooseberries in 2019 was 80,512 Metric tons and increased to 90,904.3 metric tons in 2021. Russia, Ukraine, and the United Kingdom dominate the production in the region, to which Russia contributes 87%. This increased production leads to exports. Ukraine, Kazakhstan, and Mongolia were the main destinations of gooseberry exports from Russia, comprising 99% of total exports.
- Further, health concerns among consumers in the country are increasing. The National Library of Medicine states that Berries make a significant contribution to providing the body with vitamin C. Including 100 g of fresh fruit in the diet provides about 10% of the recommended dietary intake for potassium (apricot, gooseberry, cherry, and black currant), magnesium (apple, cherry, strawberry) and dietary fiber.
Additional Benefits:
- The market estimate (ME) sheet in Excel format
- 3 months of analyst support
TABLE OF CONTENTS
1 INTRODUCTION
- 1.1 Study Assumptions and Market Definition
- 1.2 Scope of the Study
2 RESEARCH METHODOLOGY
3 EXECUTIVE SUMMARY
4 MARKET DYNAMICS
- 4.1 Market Overview
- 4.2 Market Drivers
- 4.3 Market Restraints
- 4.4 Value Chain/Supply Chain Analysis
5 MARKET SEGMENTATION
- 5.1 Geography
- 5.1.1 North America
- 5.1.1.1 United States
- 5.1.1.1.1 Production Analysis
- 5.1.1.1.2 Consumption Analysis (Volume and Value)
- 5.1.1.1.3 Import Market Analysis (Volume and Value)
- 5.1.1.1.4 Export Market Analysis (Volume and Value)
- 5.1.1.1.5 Price Trend Analysis
- 5.1.1.2 Canada
- 5.1.1.2.1 Production Analysis
- 5.1.1.2.2 Consumption Analysis (Volume and Value)
- 5.1.1.2.3 Import Market Analysis (Volume and Value)
- 5.1.1.2.4 Export Market Analysis (Volume and Value)
- 5.1.1.2.5 Price Trend Analysis
- 5.1.2 Europe
- 5.1.2.1 Turkey
- 5.1.2.1.1 Production Analysis
- 5.1.2.1.2 Consumption Analysis (Volume and Value)
- 5.1.2.1.3 Import Market Analysis (Volume and Value)
- 5.1.2.1.4 Export Market Analysis (Volume and Value)
- 5.1.2.1.5 Price Trend Analysis
- 5.1.2.2 Germany
- 5.1.2.2.1 Production Analysis
- 5.1.2.2.2 Consumption Analysis (Volume and Value)
- 5.1.2.2.3 Import Market Analysis (Volume and Value)
- 5.1.2.2.4 Export Market Analysis (Volume and Value)
- 5.1.2.2.5 Price Trend Analysis
- 5.1.2.3 Spain
- 5.1.2.3.1 Production Analysis
- 5.1.2.3.2 Consumption Analysis (Volume and Value)
- 5.1.2.3.3 Import Market Analysis (Volume and Value)
- 5.1.2.3.4 Export Market Analysis (Volume and Value)
- 5.1.2.3.5 Price Trend Analysis
- 5.1.2.4 France
- 5.1.2.4.1 Production Analysis
- 5.1.2.4.2 Consumption Analysis (Volume and Value)
- 5.1.2.4.3 Import Market Analysis (Volume and Value)
- 5.1.2.4.4 Export Market Analysis (Volume and Value)
- 5.1.2.4.5 Price Trend Analysis
- 5.1.2.5 Italy
- 5.1.2.5.1 Production Analysis
- 5.1.2.5.2 Consumption Analysis (Volume and Value)
- 5.1.2.5.3 Import Market Analysis (Volume and Value)
- 5.1.2.5.4 Export Market Analysis (Volume and Value)
- 5.1.2.5.5 Price Trend Analysis
- 5.1.3 Asia-Pacific
- 5.1.3.1 Australia
- 5.1.3.1.1 Production Analysis
- 5.1.3.1.2 Consumption Analysis (Volume and Value)
- 5.1.3.1.3 Import Market Analysis (Volume and Value)
- 5.1.3.1.4 Export Market Analysis (Volume and Value)
- 5.1.3.1.5 Price Trend Analysis
- 5.1.3.2 New Zealand
- 5.1.3.2.1 Production Analysis
- 5.1.3.2.2 Consumption Analysis (Volume and Value)
- 5.1.3.2.3 Import Market Analysis (Volume and Value)
- 5.1.3.2.4 Export Market Analysis (Volume and Value)
- 5.1.3.2.5 Price Trend Analysis
- 5.1.3.3 India
- 5.1.3.3.1 Production Analysis
- 5.1.3.3.2 Consumption Analysis (Volume and Value)
- 5.1.3.3.3 Import Market Analysis (Volume and Value)
- 5.1.3.3.4 Export Market Analysis (Volume and Value)
- 5.1.3.3.5 Price Trend Analysis
- 5.1.3.4 Indonesia
- 5.1.3.4.1 Production Analysis
- 5.1.3.4.2 Consumption Analysis (Volume and Value)
- 5.1.3.4.3 Import Market Analysis (Volume and Value)
- 5.1.3.4.4 Export Market Analysis (Volume and Value)
- 5.1.3.4.5 Price Trend Analysis
- 5.1.4 South America
- 5.1.4.1 Colombia
- 5.1.4.1.1 Production Analysis
- 5.1.4.1.2 Consumption Analysis (Volume and Value)
- 5.1.4.1.3 Import Market Analysis (Volume and Value)
- 5.1.4.1.4 Export Market Analysis (Volume and Value)
- 5.1.4.1.5 Price Trend Analysis
- 5.1.4.2 Ecuador
- 5.1.4.2.1 Production Analysis
- 5.1.4.2.2 Consumption Analysis (Volume and Value)
- 5.1.4.2.3 Import Market Analysis (Volume and Value)
- 5.1.4.2.4 Export Market Analysis (Volume and Value)
- 5.1.4.2.5 Price Trend Analysis
- 5.1.4.3 Brazil
- 5.1.4.3.1 Production Analysis
- 5.1.4.3.2 Consumption Analysis (Volume and Value)
- 5.1.4.3.3 Import Market Analysis (Volume and Value)
- 5.1.4.3.4 Export Market Analysis (Volume and Value)
- 5.1.4.3.5 Price Trend Analysis
- 5.1.5 Africa
- 5.1.5.1 South Africa
- 5.1.5.1.1 Production Analysis
- 5.1.5.1.2 Consumption Analysis (Volume and Value)
- 5.1.5.1.3 Import Market Analysis (Volume and Value)
- 5.1.5.1.4 Export Market Analysis (Volume and Value)
- 5.1.5.1.5 Price Trend Analysis
- 5.1.5.2 Kenya
- 5.1.5.2.1 Production Analysis
- 5.1.5.2.2 Consumption Analysis (Volume and Value)
- 5.1.5.2.3 Import Market Analysis (Volume and Value)
- 5.1.5.2.4 Export Market Analysis (Volume and Value)
- 5.1.5.2.5 Price Trend Analysis
- 5.1.1 North America

