
|
市場調査レポート
商品コード
1444687
グアー:市場シェア分析、業界動向と統計、成長予測(2024~2029年)Guar - Market Share Analysis, Industry Trends & Statistics, Growth Forecasts (2024 - 2029) |
||||||
カスタマイズ可能
適宜更新あり
|
|||||||
| グアー:市場シェア分析、業界動向と統計、成長予測(2024~2029年) |
|
出版日: 2024年02月15日
発行: Mordor Intelligence
ページ情報: 英文 100 Pages
納期: 2~3営業日
|

全表示
- 概要
- 目次
概要
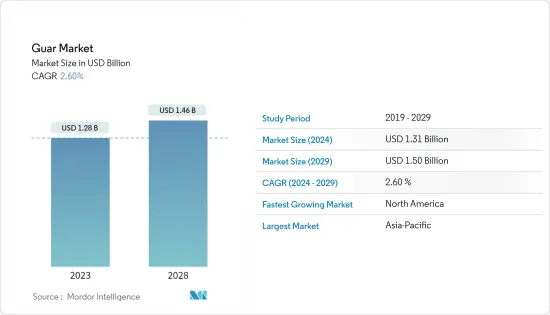
グアー市場規模は2024年に13億1,000万米ドルと推定され、2029年までに15億米ドルに達すると予想されており、予測期間(2024年から2029年)中に2.60%のCAGRで成長します。
主なハイライト
- グアーの需要は、食品および飲料業界で原料として、主に食品添加物として、特に増粘剤、安定剤、結合剤などの機能として広範囲に使用されているため、需要が高まっています。製薬業界や化粧品業界におけるガウルガムの応用と調査の増加、および石油・ガス井の刺激への応用が市場の成長を支えると予想されます。
- 水圧破砕は依然としてグアー製品の最大の最終用途産業の1つです。アジア太平洋は、生産量と他国への輸出量が多いため、予測期間中引き続きグアー市場を独占すると予想されます。
- インドはグアーガムの最大の生産国であり、総生産量のほぼ80%を占めています。この製品はインドの農産物輸出総額の約3分の1を占めています。したがって、輸出による外貨獲得を奨励する政府の取り組みが増えれば、市場に利益をもたらすことが期待されます。
グアー市場動向
エンドユーザーからの高い需要
- グアーガムは、栄養乳化剤、食品添加物、増粘剤、その他のグアーガム製品を作成する際の重要な成分です。グアー産業は、家庭での使用から産業への応用の発見へと発展してきました。新しい技術革新のおかげで、グアーの天然ガム特性は食品、製薬、石油産業でいくつかの用途に利用されています。
- 食品業界では、増粘剤として機能し、水を結合するのに役立つグアーガムの特性により、グアーガムが最もよく使用されます。たとえば、グアーガムは、パン屋、プロセスチーズ、スープ、肉など、食品業界のさまざまな分野で使用されています。化粧品や医薬品では、コンディショナー、シャンプーの増粘剤、錠剤の結合剤としてグアーガムの使用が増加しています。
- したがって、グアーガムの需要が高いため、さまざまな産業で使用できるようになりました。このニーズにより、予想される期間中にグアーガム生産に対する高い需要が生じることが予想されます。
アジア太平洋が世界の生産を独占
- アジア太平洋は世界のグアー生産の大半を占めており、インドが主要生産国となっています。インドはグアー最大の生産国であり、世界のグアーガム生産量の80%以上を占めています。インドにおけるグアーの収穫面積はここ10年近く変化がありませんが、生産性の向上によりグアーの生産量は大幅に増加しました。
- たとえば、インドは2021年から2022年に4億4,680万米ドル相当の32万1,395トンのグアーを輸出しました。グアーガムの他の主要輸入国は、イタリア、南アフリカ、ロシア、オーストラリア、オランダ、日本、ブラジル、ベルギー、カナダです。現在、インドはグアーガムを90カ国以上に輸出しています。したがって、高い輸出可能性により、調査期間中、アジア太平洋地域はグアーガムの最大の生産国および輸出国となった。
- 2021年、米国はインドからのグアーガム最大の輸入国であり、年間輸入量は約19万2,837トンで、インドからのグアーガム輸出総額の約60%を占めました。中国とドイツもインドからのグアーガムの主要輸入国です。両国はそれぞれ約250,68.8トンと9,320トンを輸入しており、インドからのグアーガム総輸出量の7.8%と2.9%を占めています。
その他の特典
- エクセル形式の市場予測(ME)シート
- 3か月のアナリストサポート
目次
第1章 イントロダクション
- 調査の前提条件と市場の定義
- 調査範囲
第2章 調査手法
第3章 エグゼクティブサマリー
第4章 市場力学
- 市場概要
- 市場促進要因
- 市場抑制要因
- バリューチェーン/サプライチェーン分析
第5章 市場セグメンテーション
- 地域(生産分析、消費分析、量と金額による輸入分析、量と金額による輸出分析、価格動向分析)
- 北米
- 米国
- カナダ
- 欧州
- ドイツ
- フランス
- ロシア
- スペイン
- アジア太平洋
- インド
- 中国
- 日本
- オーストラリア
- 南米
- ブラジル
- アルゼンチン
- アフリカ
- マラウイ
- スーダン
- 北米
第6章 市場機会と将来の動向
目次
Product Code: 53074
The Guar Market size is estimated at USD 1.31 billion in 2024, and is expected to reach USD 1.5 billion by 2029, growing at a CAGR of 2.60% during the forecast period (2024-2029).
Key Highlights
- The demand for guar is escalating because of its vast applications in the food and beverage industry as an ingredient, mainly as a food additive, especially for functions like thickener, stabilizer, and binder. Increasing application and research on gaur gum in drug manufacturing and cosmetic industries and their application in oil and gas well stimulation are expected to support the market's growth.
- Fracking remains one of the biggest end-use industries for guar products. Asia-Pacific will continue to dominate the guar market over the forecast period due to high production and high export to other countries.
- India is the largest producer of guar gum, accounting for nearly 80% of the total production. The product accounts for approximately one-third of the total agricultural exports in India. Hence, a growing number of government initiatives to encourage exports to gain foreign currency are expected to benefit the market.
Guar Market Trends
High Demand by End-users
- Guar Gum is an important ingredient in creating nourishment emulsifiers, food additives, thickeners, and other guar gum items. The guar industry has developed from being used in households to discovering applications for it in industries. Attributable to new innovations, the natural gum property of guar has several applications in the food, pharmaceutical, and oil industries.
- The food industry most uses guar gum due to its properties helping it to act as a thickener and bind the water. For instance, guar gum is used by the food industry's different segments, such as bakeries, processed cheese, soups, and meat. Cosmetics and pharmaceuticals are witnessing growth in the use of guar gum as it is used in conditioners, thicker in shampoos, and binder in tablets.
- Hence, the high demand for guar gum has enabled it to be used in various industries. This need is anticipated to lead to high demand for guar gum production during the anticipated period.
Asia-Pacific Dominates Global Production
- Asia-Pacific dominates global guar production, with India being a major producer. India is the largest producer of guar and contributes over 80% of the global guar gum production. Although the area harvested for guar in India has stayed the same for almost 10 years, the production of guar has increased significantly due to higher productivity.
- For instance, India exported 321,395 metric tons of guar worth USD 446.8 million in 2021-2022. Other major importers of guar gum are Italy, South Africa, Russia, Australia, Netherlands, Japan, Brazil, Belgium, and Canada. Presently, India exports guar gum to more than 90 countries. Therefore, high export potential has helped the Asia-Pacific region to be the largest producer and exporter of guar gum during the study period.
- In 2021, The United States was the largest importer of guar gum from India, with an annual import of about 192,837 metric tons representing about 60% of the total guar gum exports from India. China and Germany are the other major importers of guar gum from India. They import about 250,68.8 metric tons and 9,320 metric tons, respectively, which accounts for 7.8% and 2.9% of the total guar gum export from India.
Additional Benefits:
- The market estimate (ME) sheet in Excel format
- 3 months of analyst support
TABLE OF CONTENTS
1 INTRODUCTION
- 1.1 Study Assumptions and Market Definition
- 1.2 Scope of the Study
2 RESEARCH METHODOLOGY
3 EXECUTIVE SUMMARY
4 MARKET DYNAMICS
- 4.1 Market Overview
- 4.2 Market Drivers
- 4.3 Market Restraints
- 4.4 Value Chain / Supply Chain Analysis
5 MARKET SEGMENTATION
- 5.1 Geography(Production Analysis, Consumption Analysis, Import Analysis by Volume and Value, Export Analysis by Volume and Value and Price Trend Analysis)
- 5.1.1 North America
- 5.1.1.1 United States
- 5.1.1.2 Canada
- 5.1.2 Europe
- 5.1.2.1 Germany
- 5.1.2.2 France
- 5.1.2.3 Russia
- 5.1.2.4 Spain
- 5.1.3 Asia-Pacific
- 5.1.3.1 India
- 5.1.3.2 China
- 5.1.3.3 Japan
- 5.1.3.4 Australia
- 5.1.4 South America
- 5.1.4.1 Brazil
- 5.1.4.2 Argentina
- 5.1.5 Africa
- 5.1.5.1 Malawi
- 5.1.5.2 Sudan
- 5.1.1 North America

