
|
市場調査レポート
商品コード
1685907
飼料用フィトジェニックス-市場シェア分析、産業動向・統計、成長予測(2025年~2030年)Feed Phytogenics - Market Share Analysis, Industry Trends & Statistics, Growth Forecasts (2025 - 2030) |
||||||
カスタマイズ可能
適宜更新あり
|
|||||||
| 飼料用フィトジェニックス-市場シェア分析、産業動向・統計、成長予測(2025年~2030年) |
|
出版日: 2025年03月18日
発行: Mordor Intelligence
ページ情報: 英文 372 Pages
納期: 2~3営業日
|

全表示
- 概要
- 目次
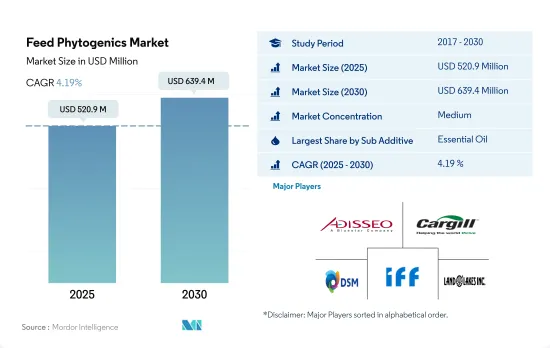
飼料用フィトジェニックス市場規模は、2025年には5億2,090万米ドルと推定され、2030年には6億3,940万米ドルに達すると予測され、予測期間(2025年~2030年)のCAGRは4.19%で成長する見込みです。
- 動物の飼料に抗生物質が使用されるようになり、動物の健康が懸念されるようになり、その結果、代替ソリューションへの需要が高まっています。フィトジェニックス(植物由来物質)は抗生物質の潜在的な代替物質であり、パフォーマンスを向上させるために動物の飼料に使用されることが増えています。2022年には、植物遺伝子は飼料添加物市場の1.4%を占めていました。フィトジェニックスは、抗生物質と比較して耐性と腸内効率が改善されているため人気があります。世界の飼料用フィトジェニックス市場は、予測期間中にCAGR 4.2%を記録する見込みです。
- 費用対効果に優れ、消化分泌物の産生を高め、血液循環を刺激するエッセンシャルオイルは、2022年の飼料用フィトジェニックスの世界市場で3億米ドルを占めました。
- アジア太平洋は、約50万トンという高い飼料生産量と高い動物人口により、2022年には31.3%を占め、世界の飼料用フィトジェニック市場で最大のシェアを占めました。同年、北米は市場の25.3%、欧州は23.7%を占めました。北米は飼料用フィトジェニックスの市場として最も急成長しており、予測期間中のCAGRは5%と予測されます。米国は2022年にCAGR 5.5%で最も急成長した国であり、これは畜産における新技術の採用によるものです。
- 抗生物質の禁止と抗生物質の代替ソリューションへの需要の高まりが、予測期間中のCAGR 4.2%で飼料用植物遺伝子の世界市場を牽引すると予想されます。
- 主にアジア太平洋で消費される飼料用植物原薬の世界市場は、近年大幅な成長を遂げました。2017年から2022年の間に、畜産業が急速に開発され、食肉および食肉製品の地域的需要が増加したため、市場は40%増加しました。その結果、アジア太平洋における飼料用植物原薬の需要は、予測期間中に4.2%のCAGRで推移すると予想されます。
- 2022年、アジア太平洋で飼料植物原薬の消費量が最も多かったのは、畜産の増加により飼料生産量が増加したためです。この地域の2021年の家畜頭数は172億5,000万頭で、世界市場の51.7%を占めています。北米と欧州も飼料用植物原体の主要地域で、それぞれ市場の25.3%と23.7%を占めています。北米の飼料生産量は2017年の2億1,550万トンから2022年には2億8,120万トンと大幅に増加しました。
- 2022年には、米国と中国が飼料用フィトジェニックス市場の主要国で、それぞれ市場の17.7%と13.7%を占めています。米国や欧州諸国などで飼料用抗生物質の使用が禁止される中、植物生薬はAGPに代わる重要な選択肢となっています。
- 世界市場における高品質な肉と牛乳への需要の高まりと新興経済諸国における可処分所得の増加により、動物飼料における天然成分への嗜好が高まっており、飼料用植物生成物市場に数多くの収益機会を生み出しています。その結果、動物人口の増加と動物用の高品質飼料への需要により、市場は予測期間中CAGR 4.1%を記録し続けると予想されます。
世界の飼料用フィトジェニックス市場動向
家禽部門への投資の増加に伴う、卵などの動物性タンパク質や家禽製品への高い需要により、家禽人口が増加しています。
- 家禽の飼育頭数は近年大幅に増加しており、その主な理由は世界的に日常食における鶏肉と卵の需要が増加しているためです。鶏肉製品へのシフトは、米国における豚肉など他の食肉の価格上昇によってもたらされました。欧州の鶏卵消費量は2017年から2021年にかけて4.6%増加し、2021年には6,135トンに達します。
- アジア太平洋は最大の食鳥生産国で、2022年の生産量は2017年比で6.6%の増加を記録します。鶏肉生産量の増加は、豚肉供給量を減少させたアフリカ豚熱の発生後、動物性タンパク質への需要が高まっているためです。世界の生産量の40%を占める中国には9億羽以上の採卵鶏がおり、最大のレイヤー養鶏センターでは年間6,000万羽のヒナを孵化させることができます。中東もまた、予測期間(2023年~2029年)に鶏肉生産の成長が見込まれます。サウジアラビアのAlmaraiのような企業がこの産業に多額の投資を行っており、生産拡大のための新農場設立に11億2,000万米ドルを投じています。
- 鶏肉製品の需要増加と鶏肉産業への投資の増加は、飼料生産を強化すると予想されます。このことが、予測期間中の世界市場における飼料添加物の需要を促進すると予想されます。世界の鶏肉産業は、鶏肉製品へのシフトの高まりと同産業への投資の増加により、今後数年間で大きく成長する構えです。
アジア太平洋と南米における水産物の消費需要の増加と政府の取り組みにより、養殖種用の飼料生産が増加しています。
- 養殖業の拡大により飼料需要が急増しており、配合飼料生産の成長を牽引しています。2022年、配合飼料生産量は前年比13.1%増、養魚飼料生産量は2017年から2022年にかけて46.3%増。魚用飼料の消費量の増加は、水産物の需要増に対応するため、水産動物の性能を維持・向上させ、生産性を高める必要があることが背景にあります。
- 魚類はアジア太平洋で多く消費・生産されているため、2022年の世界飼料市場の73.2%を魚類飼料が占めました。世界市場では魚類に次いでエビやその他の水生種が多く、エビは欧州諸国や米国が他地域から大量に輸入しています。各国は水産物の需要増に対応するため、養殖生産の拡大に力を入れています。例えば、インドは漁業省への予算配分を2020年の1億1,410万米ドルから2021年には1億6,880万米ドルに増やし、生産量を増やしており、予測期間中に飼料需要を押し上げると予想されます。
- 南米も飼料生産量の増加を記録しており、養殖の拡大に伴い2022年には2017年から46.4%増の510万トンに達しました。同地域は主要な水産物消費地域の1つであり、水産物需要の増加が養殖生産の成長を牽引しています。増大する需要に対応するために養殖業が拡大し続ける中、この産業の開発と拡大への注力が飼料生産を促進すると予想されます。このような水産種向けの飼料生産の増加は、予測期間中の水産養殖セグメントの成長を助けると予想されます。
飼料用フィトジェニックス産業の概要
飼料用フィトジェニックス市場は適度に統合されており、上位5社で59.28%を占めています。この市場の主要企業は以下の通りです。 Adisseo, Cargill Inc., DSM Nutritional Products AG, IFF(Danisco Animal Nutrition)and Land O'Lakes(sorted alphabetically).
その他の特典
- エクセル形式の市場予測(ME)シート
- 3ヶ月のアナリストサポート
目次
第1章 エグゼクティブサマリーと主な調査結果
第2章 レポートのオファー
第3章 イントロダクション
- 調査の前提条件と市場定義
- 調査範囲
- 調査手法
第4章 主要産業動向
- 動物頭数
- 家禽
- 反芻動物
- 豚
- 飼料生産
- 水産養殖
- 家禽
- 反芻動物
- 養豚
- 規制の枠組み
- オーストラリア
- ブラジル
- カナダ
- 中国
- フランス
- ドイツ
- インド
- イタリア
- 日本
- メキシコ
- オランダ
- フィリピン
- ロシア
- 南アフリカ
- スペイン
- タイ
- トルコ
- 英国
- 米国
- ベトナム
- バリューチェーンと流通チャネル分析
第5章 市場セグメンテーション
- サブ添加物
- エッセンシャルオイル
- ハーブ&スパイス
- その他の植物性食品
- 動物
- 水産養殖
- サブアニマル別
- 魚類
- エビ
- その他の養殖種
- 家禽類
- 小動物別
- ブロイラー
- レイヤー
- その他の鳥類
- 反芻動物
- 小動物別
- 肉牛
- 乳牛
- その他の反芻動物
- 豚
- その他の動物
- 水産養殖
- 地域
- アフリカ
- 国別
- エジプト
- ケニア
- 南アフリカ
- その他のアフリカ
- アジア太平洋
- 国別
- オーストラリア
- 中国
- インド
- インドネシア
- 日本
- フィリピン
- 韓国
- タイ
- ベトナム
- その他のアジア太平洋
- 欧州
- 国別
- フランス
- ドイツ
- イタリア
- オランダ
- ロシア
- スペイン
- トルコ
- 英国
- その他の欧州
- 中東
- 国別
- イラン
- サウジアラビア
- その他の中東
- 北米
- 国別
- カナダ
- メキシコ
- 米国
- その他の北米地域
- 南米
- 国別
- アルゼンチン
- ブラジル
- チリ
- その他の南米諸国
- アフリカ
第6章 競合情勢
- 主要な戦略動向
- 市場シェア分析
- 企業情勢
- 企業プロファイル.
- Adisseo
- Alltech, Inc.
- Borregaard AS
- Cargill Inc.
- DSM Nutritional Products AG
- IFF(Danisco Animal Nutrition)
- Kemin Industries
- Land O'Lakes
- Marubeni Corporation(Orffa International Holding B.V.)
- Prinova Group LLC
第7章 CEOへの主な戦略的質問
第8章 付録
- 世界概要
- 概要
- ファイブフォース分析フレームワーク
- 世界のバリューチェーン分析
- 世界市場規模とDRO
- 情報源と参考文献
- 図表リスト
- 主要洞察
- データパック
- 用語集
The Feed Phytogenics Market size is estimated at 520.9 million USD in 2025, and is expected to reach 639.4 million USD by 2030, growing at a CAGR of 4.19% during the forecast period (2025-2030).
- The use of antibiotics in animal diets led to concerns about animal health, resulting in a growing demand for alternative solutions. Phytogenics, or plant-derived substances, are potential alternatives to antibiotics and are increasingly used in animal diets to improve performance. In 2022, phytogenics accounted for 1.4% of the feed additives market. Phytogenics are popular due to their improved resistance and gut efficiency compared to antibiotics. The global feed phytogenics market is expected to record a CAGR of 4.2% during the forecast period.
- Essential oils, which are cost-effective, enhance the production of digestive secretions, and stimulate blood circulation, accounted for USD 0.3 billion of the global feed phytogenics market in 2022.
- Asia-Pacific held the largest share of the global feed phytogenic market, accounting for 31.3% in 2022, due to the higher feed production of around 0.5 million metric tons and a higher animal population. In the same year, North America and Europe accounted for 25.3% and 23.7% of the market, respectively. North America is the fastest-growing market for feed phytogenics, recording a projected CAGR of 5% during the forecast period. The United States was the fastest-growing country in 2022, with a CAGR of 5.5%, due to the adoption of new technologies in animal farming.
- The ban on antibiotics and the growing demand for alternative solutions to antibiotics are expected to drive the global feed phytogenics market at a CAGR of 4.2% during the forecast period.
- The global market for feed phytogenics, which is primarily consumed in the Asia-Pacific region, experienced substantial growth in recent years. Between 2017 and 2022, the market increased by 40% due to the rapidly developing livestock industry and an increase in regional demand for meat and meat products. As a result, the demand for feed phytogenics in the Asia-Pacific region is expected to register a CAGR of 4.2% during the forecast period.
- In 2022, the largest consumption of feed phytogenics in the Asia-Pacific region was due to the increase in livestock farming, which led to a boost in feed production. The region had 17.25 billion animals in 2021, accounting for 51.7% of the global market. North America and Europe were also major regions for feed phytogenics, accounting for 25.3% and 23.7% of the market, respectively. Feed production in North America increased significantly, from 215.5 million metric tons in 2017 to 281.2 million metric tons in 2022.
- In 2022, the United States and China were the leading countries in the feed phytogenics market, occupying 17.7% and 13.7% of the market, respectively. With a ban on the use of feed antibiotics in the United States, European countries, and other countries, phytogenics have become an important alternative to AGPs.
- The growing demand for quality meat and milk in the global market and rising disposable income in developed economies are increasing the preference for natural ingredients in animal feed, creating numerous profitable opportunities for the feed phytogenics market. As a result, the market is expected to continue registering a CAGR of 4.1% during the forecast period due to the growing animal population and the demand for quality feed for animals.
Global Feed Phytogenics Market Trends
High demand for animal protein and poultry products such as eggs with increasing investment in poultry sector is increasing poultry population
- The poultry population has witnessed a significant increase over recent years, primarily due to the growing demand for chicken meat and eggs in daily diets globally. The shift toward poultry products has been driven by the increasing prices of other meat, such as pig meat, in the United States. The consumption of eggs in Europe increased by 4.6% between 2017 and 2021, amounting to 6,135 metric tons in 2021.
- Asia-Pacific is the largest producer of poultry birds, with production registering a 6.6% increase in 2022 compared to 2017. The rise in poultry production is due to the growing demand for animal protein following the outbreak of African Swine Fever, which reduced the pork meat supply. China, which accounts for 40% of global production, has more than 900 million stock-laying hens, and the largest layer poultry farming center can hatch 60 million chicks per year. The Middle East is also expected to witness growth in poultry production during the forecast period (2023-2029). Companies such as Almarai in Saudi Arabia have invested heavily in the industry, with USD 1.12 billion spent on establishing new farms to expand production.
- The increasing demand for poultry products and rising investments in the poultry industry are expected to strengthen feed production. This, in turn, is expected to drive the demand for feed additives in the global market during the forecast period. The global poultry industry is poised for significant growth over the coming years, driven by the increasing shift toward poultry products and increasing investments in the industry.
The growing demand for seafood consumption in Asia-Pacific and South America, and government initiatives is increasing the feed production for aquaculture species
- The demand for feed is rapidly increasing due to the expansion of aquaculture, which is driving the growth of compound feed production. In 2022, compound feed production increased by 13.1% over the previous year, and fish feed production increased by 46.3% between 2017 and 2022. The rise in consumption of fish feed is driven by the need to maintain and improve the performance of aquatic animals and increase productivity to meet the growing demand for seafood.
- Fish feed accounted for 73.2% of the global feed market in 2022, as fish is highly consumed and produced in the Asia-Pacific region. Fish was followed by shrimp and other aquatic species in the global market, with shrimp being highly imported by European countries and the United States from other regions. Countries are focusing on expanding aquaculture production to meet the growing demand for seafood. For instance, India increased its budget allocation to the Department of Fisheries from USD 114.1 million in 2020 to USD 168.8 million in 2021 to increase production, which is expected to boost the demand for feed during the forecast period.
- South America is also recording increased feed production, which rose by 46.4% in 2022 from 2017 to reach 5.1 million metric ton, in line with the expansion of aquaculture farming. The region is one of the major seafood-consuming regions, and the increasing demand for seafood is driving the growth of aquaculture production. As aquaculture continues to expand to meet the growing demand, the development of the industry and a focus on its expansion are expected to fuel feed production. This increase in feed production for aquatic species is expected to aid in the growth of the aquaculture segment during the forecast period.
Feed Phytogenics Industry Overview
The Feed Phytogenics Market is moderately consolidated, with the top five companies occupying 59.28%. The major players in this market are Adisseo, Cargill Inc., DSM Nutritional Products AG, IFF(Danisco Animal Nutrition) and Land O'Lakes (sorted alphabetically).
Additional Benefits:
- The market estimate (ME) sheet in Excel format
- 3 months of analyst support
TABLE OF CONTENTS
1 EXECUTIVE SUMMARY & KEY FINDINGS
2 REPORT OFFERS
3 INTRODUCTION
- 3.1 Study Assumptions & Market Definition
- 3.2 Scope of the Study
- 3.3 Research Methodology
4 KEY INDUSTRY TRENDS
- 4.1 Animal Headcount
- 4.1.1 Poultry
- 4.1.2 Ruminants
- 4.1.3 Swine
- 4.2 Feed Production
- 4.2.1 Aquaculture
- 4.2.2 Poultry
- 4.2.3 Ruminants
- 4.2.4 Swine
- 4.3 Regulatory Framework
- 4.3.1 Australia
- 4.3.2 Brazil
- 4.3.3 Canada
- 4.3.4 China
- 4.3.5 France
- 4.3.6 Germany
- 4.3.7 India
- 4.3.8 Italy
- 4.3.9 Japan
- 4.3.10 Mexico
- 4.3.11 Netherlands
- 4.3.12 Philippines
- 4.3.13 Russia
- 4.3.14 South Africa
- 4.3.15 Spain
- 4.3.16 Thailand
- 4.3.17 Turkey
- 4.3.18 United Kingdom
- 4.3.19 United States
- 4.3.20 Vietnam
- 4.4 Value Chain & Distribution Channel Analysis
5 MARKET SEGMENTATION (includes market size in Value in USD and Volume, Forecasts up to 2030 and analysis of growth prospects)
- 5.1 Sub Additive
- 5.1.1 Essential Oil
- 5.1.2 Herbs & Spices
- 5.1.3 Other Phytogenics
- 5.2 Animal
- 5.2.1 Aquaculture
- 5.2.1.1 By Sub Animal
- 5.2.1.1.1 Fish
- 5.2.1.1.2 Shrimp
- 5.2.1.1.3 Other Aquaculture Species
- 5.2.2 Poultry
- 5.2.2.1 By Sub Animal
- 5.2.2.1.1 Broiler
- 5.2.2.1.2 Layer
- 5.2.2.1.3 Other Poultry Birds
- 5.2.3 Ruminants
- 5.2.3.1 By Sub Animal
- 5.2.3.1.1 Beef Cattle
- 5.2.3.1.2 Dairy Cattle
- 5.2.3.1.3 Other Ruminants
- 5.2.4 Swine
- 5.2.5 Other Animals
- 5.2.1 Aquaculture
- 5.3 Region
- 5.3.1 Africa
- 5.3.1.1 By Country
- 5.3.1.1.1 Egypt
- 5.3.1.1.2 Kenya
- 5.3.1.1.3 South Africa
- 5.3.1.1.4 Rest of Africa
- 5.3.2 Asia-Pacific
- 5.3.2.1 By Country
- 5.3.2.1.1 Australia
- 5.3.2.1.2 China
- 5.3.2.1.3 India
- 5.3.2.1.4 Indonesia
- 5.3.2.1.5 Japan
- 5.3.2.1.6 Philippines
- 5.3.2.1.7 South Korea
- 5.3.2.1.8 Thailand
- 5.3.2.1.9 Vietnam
- 5.3.2.1.10 Rest of Asia-Pacific
- 5.3.3 Europe
- 5.3.3.1 By Country
- 5.3.3.1.1 France
- 5.3.3.1.2 Germany
- 5.3.3.1.3 Italy
- 5.3.3.1.4 Netherlands
- 5.3.3.1.5 Russia
- 5.3.3.1.6 Spain
- 5.3.3.1.7 Turkey
- 5.3.3.1.8 United Kingdom
- 5.3.3.1.9 Rest of Europe
- 5.3.4 Middle East
- 5.3.4.1 By Country
- 5.3.4.1.1 Iran
- 5.3.4.1.2 Saudi Arabia
- 5.3.4.1.3 Rest of Middle East
- 5.3.5 North America
- 5.3.5.1 By Country
- 5.3.5.1.1 Canada
- 5.3.5.1.2 Mexico
- 5.3.5.1.3 United States
- 5.3.5.1.4 Rest of North America
- 5.3.6 South America
- 5.3.6.1 By Country
- 5.3.6.1.1 Argentina
- 5.3.6.1.2 Brazil
- 5.3.6.1.3 Chile
- 5.3.6.1.4 Rest of South America
- 5.3.1 Africa
6 COMPETITIVE LANDSCAPE
- 6.1 Key Strategic Moves
- 6.2 Market Share Analysis
- 6.3 Company Landscape
- 6.4 Company Profiles (includes Global Level Overview, Market Level Overview, Core Business Segments, Financials, Headcount, Key Information, Market Rank, Market Share, Products and Services, and Analysis of Recent Developments).
- 6.4.1 Adisseo
- 6.4.2 Alltech, Inc.
- 6.4.3 Borregaard AS
- 6.4.4 Cargill Inc.
- 6.4.5 DSM Nutritional Products AG
- 6.4.6 IFF(Danisco Animal Nutrition)
- 6.4.7 Kemin Industries
- 6.4.8 Land O'Lakes
- 6.4.9 Marubeni Corporation (Orffa International Holding B.V.)
- 6.4.10 Prinova Group LLC
7 KEY STRATEGIC QUESTIONS FOR FEED ADDITIVE CEOS
8 APPENDIX
- 8.1 Global Overview
- 8.1.1 Overview
- 8.1.2 Porter's Five Forces Framework
- 8.1.3 Global Value Chain Analysis
- 8.1.4 Global Market Size and DROs
- 8.2 Sources & References
- 8.3 List of Tables & Figures
- 8.4 Primary Insights
- 8.5 Data Pack
- 8.6 Glossary of Terms

