
|
市場調査レポート
商品コード
1852173
有機過酸化物:市場シェア分析、産業動向、統計、成長予測(2025年~2030年)Organic Peroxide - Market Share Analysis, Industry Trends & Statistics, Growth Forecasts (2025 - 2030) |
||||||
カスタマイズ可能
適宜更新あり
|
|||||||
| 有機過酸化物:市場シェア分析、産業動向、統計、成長予測(2025年~2030年) |
|
出版日: 2025年09月09日
発行: Mordor Intelligence
ページ情報: 英文 120 Pages
納期: 2~3営業日
|

概要
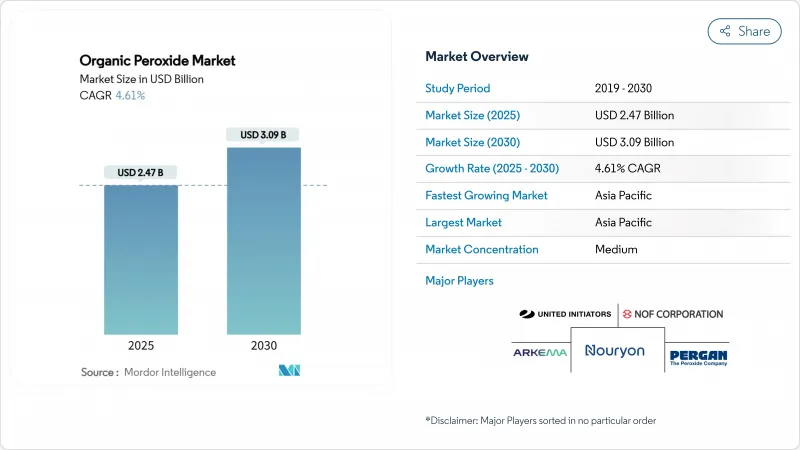
有機過酸化物市場規模は2025年に24億7,000万米ドル、2030年には30億9,000万米ドルに達すると推定・予測され、予測期間(2025-2030年)のCAGRは4.61%です。
高度なポリエチレンやポリプロピレングレードの使用の増加、EVA太陽電池封止材の急速な普及、VOCフリーの粉体塗装システムへのシフトが需要の伸びを支えています。生産者は、厳しい仕様管理を必要とするポリマーや複合材料の顧客に対応するため、アジア太平洋地域で生産能力を拡大する一方、安全性を重視したペーストやエマルジョンの形態が広く受け入れられるようになっています。同時に、不安定な原料価格と貯蔵施設の保険料上昇が利幅を圧迫し続けており、メーカーは再生可能な原料やより安全なハンドリングソリューションに舵を切っています。アジア太平洋地域は、販売量と需要増の両面で大きな柱となっており、北米と欧州では、持続可能性に関する規制が製品の代替を加速させています。
世界の有機過酸化物市場の動向と洞察
高度なPEおよびPPグレードへのシフト
レオロジーコントロールされたポリプロピレンと高融点PPのパッケージングと自動車部品への要求が高まり、アジア太平洋地域で有機過酸化物の消費が増加。LyondellBasell社は、2024年のリサイクルおよび再生可能ベースのポリマー生産量を65%増の20万トン以上に引き上げ、2030年までに年間200万トンを目標に掲げ、分子量と分岐を微調整する有機過酸化物の必要性を高めています。加工業者の報告によると、ジクミルペルオキシドをチェーンブレーカーとして使用した場合、PPの加工効率が18%向上し、PerkadoxとTrigonox(R)グレードを使用した分岐PPはフォーム特性が30%向上します。地域の樹脂メーカーが特殊能力を拡大するにつれて、有機過酸化物市場は安定した需要基盤を獲得しています。
EVA太陽電池封止材への有機過酸化物の採用
急成長する太陽光発電設備は、Luperox TBECのような過酸化物で架橋されたEVA封止シートによってゲル含有率を75%以上に高め、モジュールの耐久性を高めています。EVAシートの生産量は中国が圧倒的に多く、欧州のモジュールメーカーも電力損失を抑えるために高純度の過酸化物システムにアップグレードしています。これらの動向は、特に分解プロファイルの狭い高圧重合グレードにおいて、当面の有機過酸化物市場の着実な数量増につながります。
貯蔵施設の保険料
2025年1月1日に改正ADRの枠組みが施行され、有機過酸化物倉庫の分類と検査の厳格化が進みます。欧州のアンダーライターは大容量の施設の保険料を引き上げ、運営コストを引き上げ、拡張プロジェクトを遅らせています。生産者は在庫レベルを最適化し、小規模のサテライトデポに投資することで対応しているが、固定費の増加は有機過酸化物市場のマージン拡大を抑制しています。
セグメント分析
2024年の有機過酸化物市場における過酸化ベンゾイルの売上シェアは24%でした。フリーラジカル重合は依然としてスチレン系およびアクリル系の高スループット重合ルートであるため、工業用グレードの販売量が大半を占めています。とはいえ、一部の消費者向け製品ではベンゼン汚染に対する懸念が高まっており、製品改良に拍車がかかっています。
環境に優しく、洗浄剤としても広く利用できるパーカーボネートは、CAGR 4.74%で最も急成長しているサブセグメントです。廃水浄化のための過炭酸塩ベースの高度酸化プロセスの商業化は、顧客ミックスの幅を広げ、将来のシェア拡大を支えます。
重合開始剤は2024年に有機過酸化物市場シェアの65%を占め、2030年までのCAGRは5.22%と予測されます。LDPEとPPの高スループット設備では、分解速度が予測しやすいことから、tert-ブチルパーオキシ-2-エチルヘキサノエートのような特性良好な開始剤が好まれます。架橋剤は次に大きなカテゴリーで、電線・ケーブルの被覆、発泡断熱材、高温での寸法安定性を必要とする複合部品に使用されます。硬化・硬化剤は、量は少ないが、3Dプリンティングや高圧RTMコンポジット用の高度な樹脂化学で重要性を増しています。
地域分析
アジア太平洋地域は2024年に有機過酸化物市場の39%を占め、CAGR 4.89%で成長しています。中国がこの地域の需要を支配しており、Nouryonの寧波における2024年11月の拡張は、Perkadox 14とTrigonox 101の生産量を6,000トンに倍増させ、制御型レオロジー改質剤に対する現地の意欲を裏付けています。
北米は、自動車用複合材料、ヘルスケア、高純度半導体ポリマーなど、成熟しつつも付加価値の高い需要が特徴です。メーカー各社はより安全な配合を重視しており、過酸化物のバルク輸送に関する運輸省の厳しいガイドラインに沿ったエマルジョンベースの開始剤を導入しているところもあります。
欧州は、VOC排出を制限し、より安全な危険物輸送を義務付ける環境法制によって成長を牽引され、僅差で追随しています。2025年に発効するADRの更新は、より厳しい貯蔵隔離と訓練要件を課し、運転コストを増加させるが、ペースト状やポリマー結合型の採用を促進します。
その他の特典:
- エクセル形式の市場予測(ME)シート
- 3ヶ月のアナリストサポート
よくあるご質問
目次
第1章 イントロダクション
- 調査の前提条件と市場の定義
- 調査範囲
第2章 調査手法
第3章 エグゼクティブサマリー
第4章 市場情勢
- 市場概要
- 市場促進要因
- アジア太平洋地域におけるポリマー需要の高度PE・PPグレードへのシフト
- 有機過酸化物の急速な普及
- 欧州におけるVOCフリーUV硬化型粉体塗料の成長
- 自動車軽量化、繊維強化複合材料の用途拡大
- コーティング用途での利用急増
- 市場抑制要因
- EUにおける大規模貯蔵施設の高い保険料
- 原料の供給逼迫
- 有機過酸化物のコスト上昇
- バリューチェーン分析
- ポーターのファイブフォース
- 供給企業の交渉力
- 買い手の交渉力/消費者
- 新規参入業者の脅威
- 代替製品・サービスの脅威
- 競合の程度
第5章 市場規模と成長予測
- タイプ別
- ジアシルペルオキシド
- ジアルキルペルオキシド
- ケトンペルオキシド
- ハイドロペルオキシド
- 過炭酸塩
- ベンゾイルペルオキシド
- ペルオキシエステル
- その他
- 機能別
- 重合開始剤
- 架橋剤
- 硬化剤
- 形態別
- 液体
- 固体
- ペースト/エマルジョン
- 用途別
- ポリマー・ゴム
- コーティングと接着剤
- 紙・テキスタイル
- 化粧品
- ヘルスケア
- その他の用途
- 地域別
- アジア太平洋地域
- 中国
- インド
- 日本
- 韓国
- ASEAN
- その他アジア太平洋地域
- 北米
- 米国
- カナダ
- メキシコ
- 欧州
- ドイツ
- 英国
- フランス
- イタリア
- スペイン
- 北欧諸国
- その他欧州地域
- 南米
- ブラジル
- アルゼンチン
- その他南米
- 中東・アフリカ
- サウジアラビア
- 南アフリカ
- その他の中東・アフリカ
- アジア太平洋地域
第6章 競合情勢
- 市場集中度
- 戦略的な動き(M&A、JV、能力増強)
- 市場シェア(%)/ランキング分析
- 企業プロファイル
- ADEKA CORPORATION
- AKPA Kimya
- Arkema
- BASF
- Dow
- Evonik Industries AG
- Hanwha Group
- Jiangsu qiangsheng chemical co. LTD
- Kawaguchi Chemical Industry Co., LTD.
- Lianyungang Hualun Chemical Co.,Ltd.
- MITSUBISHI GAS CHEMICAL COMPANY, INC.
- MPI Chemie BV
- NOF CORPORATION
- Nouryon
- Novichem Sp. z o.o.
- PERGAN GmbH
- Plasti Pigments Pvt. Ltd.
- Shenzhen Bailingwei Technology Co., Ltd.
- Solvay
- United Chemicals
- United Initiators GmbH

