
|
市場調査レポート
商品コード
1687304
生鮮リンゴ- 市場シェア分析、産業動向、成長予測(2025~2030年)Fresh Apple - Market Share Analysis, Industry Trends & Statistics, Growth Forecasts (2025 - 2030) |
||||||
カスタマイズ可能
適宜更新あり
|
|||||||

価格
| 生鮮リンゴ- 市場シェア分析、産業動向、成長予測(2025~2030年) |
|
出版日: 2025年03月18日
発行: Mordor Intelligence
ページ情報: 英文 143 Pages
納期: 2~3営業日
|

- 全表示
- 概要
- 目次
概要
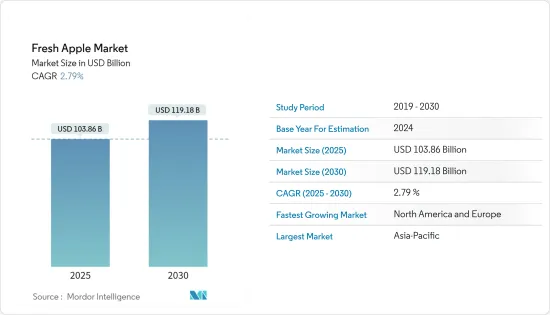
生鮮リンゴ市場規模は2025年に1,038億6,000万米ドルと推定され、予測期間(2025~2030年)のCAGRは2.79%で、2030年には1,191億8,000万米ドルに達すると予測されます。
主要ハイライト
- 世界的に栽培されている食用果物であるリンゴは、低カロリーでありながら食物繊維、ビタミンC、抗酸化物質がたっぷり含まれています。その低カロリーと低脂肪は体重管理と健康全般に役立つため、消費者の間で人気が高く、医療専門家からも定番の推奨品となっています。
- 最近の動向では、新興国や開発途上国における生鮮食品の需要の高まりにより、生鮮リンゴ市場が大きく成長しています。健康効果に対する意識の高まり、新しいハイブリッド品種の導入、契約栽培の増加などの要因が、この世界市場の拡大に貢献しています。米国農務省によると、リンゴの生産量は8,370万トンで、前年比1%増となっています。特筆すべきは、この2カ国がEUとトルコの生産不足を補ったことです。
- アジア太平洋は生鮮リンゴの生産と消費で世界をリードしており、今後もその優位性を維持する構えです。その原動力となっているのは、堅調な流通チャネルに支えられた生産量と消費量の増加です。この地域のリンゴの主要市場には、中国、インド、韓国、日本、オーストラリア、ニュージーランドなどがあります。中国は、世界の生鮮リンゴの消費量において圧倒的な地位を占めています。中国の生鮮リンゴ消費に拍車をかけている要因には、所得の増加、健康意識の高まり、食生活の嗜好の変化、革新的なマーケティング戦略、コールドチェーン物流の進歩などがあります。さらに、eコマースとチェーン果物店の台頭が果物購入を合理化し、中国の第3、4級都市での消費を押し上げています。
生鮮リンゴ市場の動向
有機リンゴへの需要の高まり
- 北米では、健康とウェルネスへの関心の高まりから、消費者の有機リンゴへの関心が高まっています。例えば、米国農務省(USDA)の報告によると、2022年の米国における1人当たりの年間生鮮リンゴ消費量は7.15Kgでした。さらに米国農務省のデータによると、有機リンゴは全米のリンゴ消費量の16%を占め、リンゴ栽培専用地の30%を占めています。米国以外では、カナダでも有機リンゴの需要が急増しています。有機リンゴは、プラクティス栽培のリンゴや他の果物に比べ、糖度が低く、食物繊維が豊富です。この違いが、カナダにおける有機リンゴの需要を大きく高めています。ITC貿易マップのデータによると、2023年にカナダが輸入した有機リンゴは2,800万米ドルを超え、主にガラ、グラニースミス、ハニークリスプなどの品種が輸入されました。
- 欧州では、高所得層が有機リンゴを健康への投資とみなし、プレミアムを支払って購入する傾向が強まっています。欧州では最近、リンゴの栽培面積と生産量が減少しているにもかかわらず、有機リンゴの需要が急増し、有機リンゴ部門が急成長しています。現在、独自調査の統計によると、イタリアの有機リンゴ市場は、国内のリンゴ総生産量の5~10%を占めています。このシェアは長期的に安定しているもの、有機栽培に特化した面積は増加傾向にあります。イッツ・ビオプロジェクトの焦点であるベネルクス市場は、有機リンゴの旺盛な需要を目の当たりにしています。IFOAMオーガニックス欧州の予測によると、ベネルクス市場は2027年までにCAGR10%以上で拡大するといいます。従来のリンゴの収量は有機品種の収量を上回っているが、有機リンゴは農業従事者から卸売、小売に至るサプライチェーン全体を通じて一貫してプレミアム価格で取引されています。
アジア太平洋がリンゴ消費をリード
- アジア太平洋では、中国が世界一のリンゴ生産国として際立っています。リンゴは中国で最も好まれる果物として君臨しています。中国国家統計局の報告によると、2023年の中国のリンゴ生産量は4,960万トンで、前年から4%増加しました。民間部門の投資の急増は、リンゴ栽培における企業や専門農場の急速な出現に道を開いた。これらの経営者は、生産性と品質の両方を高めるために、近代的な生産モデルと技術を採用するようになってきています。
- ITC Trademapのデータによると、ニュージーランドは世界のリンゴ輸出国上位10に入り、輸出額は2023年に5億3,300万米ドルに達します。米国農務省は、2024年の同国のリンゴ生産量は56万トンに増加すると予測しています。ホークスベイ、タスマン、セントラルオタゴなどの主要産地は、冬の十分な冷え込み、暖かい春、夏の長い日照時間、乾燥した栽培地域など、リンゴ栽培に最適な条件を提供しています。その結果、生産量も輸出量も今後数年間で増加すると予想されます。
- ITC Trademapのデータによると、2023年のインドの生鮮リンゴ輸入量は46万9,000トンに達し、2022年から7万7,000トン増加しました。インドの人口が増加するにつれ、より健康的な食品に対する食欲も高まり、リンゴの消費量が継続的に増加しています。米国農務省(USDA)は、2024年のインド国内のリンゴ生産量が6%増加すると予測しており、その理由として主要なリンゴ栽培地域の天候が良好であることを挙げています。さらに、米国農務省は2024年のリンゴの輸入量が10%急増すると予測しており、高級品質のリンゴに対する需要によって市場が拡大していることを裏付けています。
その他の特典
- エクセル形式の市場予測(ME)シート
- 3ヶ月間のアナリストサポート
目次
第1章 イントロダクション
- 調査の前提条件と市場定義
- 調査範囲
第2章 調査手法
第3章 エグゼクティブサマリー
第4章 市場力学
- 市場概要
- 市場促進要因
- 新品種の開発
- 有機リンゴに対する需要の高まり
- 食品加工産業への需要
- 市場抑制要因
- 天候不順による生産量の変動
- 病害虫の発生
- バリューチェーン分析
第5章 市場セグメンテーション
- 地域
- 北米
- 米国
- 生産量分析
- 金額・数量別消費分析
- 輸入の分析:金額と数量
- 輸出分析:金額・数量
- 卸売価格の動向分析
- カナダ
- 生産量別分析
- 金額と数量による消費分析
- 輸入金額と数量による分析
- 輸出金額・数量分析
- 卸売価格の動向分析
- メキシコ
- 生産量別分析
- 金額・数量別消費分析
- 輸入の金額と数量による分析
- 輸出金額・数量分析
- 卸売価格の動向分析
- 欧州
- ドイツ
- 生産量別分析
- 金額と数量による消費分析
- 輸入の分析:金額と数量
- 金額と数量による輸出分析
- 卸売価格の動向分析
- 英国
- 生産量別分析
- 金額と数量による消費分析
- 輸入金額と数量による分析
- 輸出金額・数量別分析
- 卸売価格の動向分析
- ポーランド
- 生産量別分析
- 消費分析:金額・数量
- 輸入の金額と数量分析
- 輸出金額・数量分析
- 卸売価格の動向分析
- イタリア
- 生産量別分析
- 金額と数量による消費分析
- 金額と数量による輸入分析
- 輸出金額・数量分析
- 卸売価格の動向分析
- フランス
- 生産量別分析
- 金額・数量別消費分析
- 輸入の金額と数量分析
- 輸出金額・数量分析
- 卸売価格の動向分析
- トルコ
- 生産量別分析
- 金額・数量別消費分析
- 輸入の金額と数量分析
- 輸出金額・数量分析
- 卸売価格の動向分析
- アジア太平洋
- 中国
- 生産量別分析
- 金額と数量による消費分析
- 輸入分析:金額と数量
- 輸出分析:金額と数量
- 卸売価格の動向分析
- ニュージーランド
- 生産量別分析
- 金額と数量による消費分析
- 金額と数量による輸入分析
- 輸出金額・数量分析
- 卸売価格の動向分析
- 日本
- 生産量別分析
- 消費金額・数量別分析
- 輸入の金額と数量による分析
- 輸出金額・数量分析
- 卸売価格の動向分析
- インド
- 生産量別分析
- 金額・数量別消費分析
- 輸入の金額と数量による分析
- 輸出金額・数量分析
- 卸売価格の動向分析
- 南米
- ブラジル
- 生産量別分析
- 消費分析:金額・数量
- 輸入の分析:金額と数量
- 金額と数量による輸出分析
- 卸売価格の動向分析
- アルゼンチン
- 生産量別分析
- 消費分析:金額・数量
- 輸入の金額と数量分析
- 輸出金額・数量分析
- 卸売価格の動向分析
- チリ
- 生産量別分析
- 消費分析:金額・数量
- 輸入の金額と数量分析
- 輸出の金額と数量分析
- 卸売価格の動向分析
- 中東・アフリカ
- 南アフリカ
- 生産量別分析
- 金額・数量別消費分析
- 輸入:金額・数量分析
- 輸出の金額と数量による分析
- 卸売価格の動向分析
- エジプト
- 生産量別分析
- 金額・数量別消費分析
- 輸入の金額と数量分析
- 輸出金額・数量分析
- 卸売価格の動向分析
- 北米
第6章 市場機会と今後の動向
目次
Product Code: 60940
The Fresh Apple Market size is estimated at USD 103.86 billion in 2025, and is expected to reach USD 119.18 billion by 2030, at a CAGR of 2.79% during the forecast period (2025-2030).
Key Highlights
- Apples, a globally cultivated edible fruit, are packed with fiber, Vitamin C, and antioxidants, all while being low in calories. Their low calorie and fat content aids in weight management and overall health, making them a favorite among consumers and a staple recommendation from health professionals.
- In recent years, the fresh apple market has seen significant growth, driven by a rising demand for fresh produce in emerging and developing nations. Factors such as heightened awareness of health benefits, the introduction of new hybrid varieties, and an uptick in contract farming have all contributed to this global market expansion. The United States Department of Agriculture reports the production of apples at 83.7 million metric tons, which has increased by 1% as compared to the previous year, largely due to a production surge in the U.S. and China. Notably, these two nations have compensated for production shortfalls in the European Union and Turkey.
- The Asia-Pacific region leads the world in fresh apple production and consumption and is poised to maintain its dominance. This is driven by rising production and consumption levels, bolstered by robust distribution channels. Some of the key markets of apples in the region include China, India, South Korea, Japan, Australia, New Zealand, etc, amongst others. China stands as the dominant player in the global fresh apple in terms of consumption. Factors fueling China's fresh apple consumption include rising incomes, heightened health awareness, evolving dietary preferences, innovative marketing strategies, and advancements in cold-chain logistics. Moreover, the rise of e-commerce, and chain fruit stores, has streamlined fruit purchasing, boosting consumption in China's third and fourth-tier cities.
Fresh Apple Market Trends
Increasing Demand for Organic Apples
- Across North America, consumers increasingly gravitate towards organic apples, driven by heightened health and wellness concerns. For example, the United States Department of Agriculture (USDA) reported that in 2022, the annual per capita consumption of fresh apples in the U.S. stood at 7.15 Kg. Furthermore, USDA data reveals that organic apples make up 16% of the nation's total apple consumption and occupy 30% of the land dedicated to apple cultivation. Apart from the United States, Canada as well has been witnessing a surge in demand for organic apples. Organic apples, when compared to their conventionally grown counterparts and other fruits, boast naturally lower sugar content and higher fiber levels. This distinction has fueled a significant demand for organic apples in Canada. Data from the ITC Trade Map indicates that in 2023, Canada imported organic apples valued at over USD 28 million, predominantly featuring varieties like Gala, Granny Smith, and Honey Crisp.
- In Europe, higher-income groups are increasingly willing to pay a premium for organic apples, viewing it as an investment in their health. Despite a recent decline in apple acreage and production across Europe, the demand for organic apples has surged, leading to a burgeoning organic apple sector. Currently, statistics from independent research show that Italy's organic apple market represents 5-10% of the nation's total apple production. While this share has remained stable over time, the area dedicated to organic production is on the rise. The Benelux market, a focus of the It's Bio project, is witnessing robust demand for organic apples. Projections from IFOAM Organics Europe suggest Benelux market will expand at a compound annual growth rate (CAGR) of over 10% by 2027. Although conventional apple yields surpass those of organic varieties, organic apples consistently fetch a price premium throughout the supply chain, from farm-gate to wholesale and retail.
Asia-Pacific Leads Apple Consumption
- Within Asia-Pacific, China stands out as the globe's top apple producer. Apples reign as the most favored fruit in China. In 2023, China produced 49.6 million metric tons of apples, marking a 4% increase from the previous year, as reported by the National Bureau of Statistics of China. The surge in private sector investments has paved the way for the rapid emergence of corporate and specialized farms in apple cultivation. These operations are increasingly adopting modern production models and technologies to boost both productivity and quality.
- New Zealand ranks among the world's top ten largest apple exporters, with export value reaching USD 533 million in 2023, according to ITC Trademap data. The United States Department of Agriculture forecasts an increase in apple production in the country to 560,000 metric tons for 2024. Key growing regions such as Hawke's Bay, Tasman, and Central Otago provide optimal conditions for apple cultivation, including adequate winter chilling, warm springs, extended summer sunshine hours, and dry growing areas. Consequently, both production and exports are expected to rise in the coming years.
- Data from ITC Trademap reveals that India's fresh apple imports reached 469 thousand metric tons in 2023, marking a 77 thousand metric tons increase from 2022. As India's population grows, so does its appetite for healthier foods, driving a continuous rise in apple consumption. The United States Department of Agriculture (USDA) forecasts a 6 percent boost in India's domestic apple production for the marketing year 2024, attributing this to favorable weather in key apple-growing areas. Furthermore, USDA anticipates a 10 percent surge in apple imports for 2024, underscoring the expanding market driven by a demand for premium-quality apples.
Additional Benefits:
- The market estimate (ME) sheet in Excel format
- 3 months of analyst support
TABLE OF CONTENTS
1 INTRODUCTION
- 1.1 Study Assumptions and Market Definition
- 1.2 Scope of the Study
2 RESEARCH METHODOLOGY
3 EXECUTIVE SUMMARY
4 MARKET DYNAMICS
- 4.1 Market Overview
- 4.2 Market Drivers
- 4.2.1 Development of Newer Varieties
- 4.2.2 Rising Demand for Organic Apples
- 4.2.3 Demand for Food Processing Industry
- 4.3 Market Restraints
- 4.3.1 Production Fluctuations Due To Climatic Adversities
- 4.3.2 Pest and Disease Outbreaks
- 4.4 Value Chain Analysis
5 MARKET SEGMENTATION
- 5.1 Geography
- 5.1.1 North America
- 5.1.1.1 United States
- 5.1.1.1.1 Production Analysis by Volume
- 5.1.1.1.2 Consumption Analysis by Value and Volume
- 5.1.1.1.3 Import Analysis by Value and Volume
- 5.1.1.1.4 Export Analysis by Value and Volume
- 5.1.1.1.5 Wholesale Price Trend Analysis
- 5.1.1.2 Canada
- 5.1.1.2.1 Production Analysis by Volume
- 5.1.1.2.2 Consumption Analysis by Value and Volume
- 5.1.1.2.3 Import Analysis by Value and Volume
- 5.1.1.2.4 Export Analysis by Value and Volume
- 5.1.1.2.5 Wholesale Price Trend Analysis
- 5.1.1.3 Mexico
- 5.1.1.3.1 Production Analysis by Volume
- 5.1.1.3.2 Consumption Analysis by Value and Volume
- 5.1.1.3.3 Import Analysis by Value and Volume
- 5.1.1.3.4 Export Analysis by Value and Volume
- 5.1.1.3.5 Wholesale Price Trend Analysis
- 5.1.2 Europe
- 5.1.2.1 Germany
- 5.1.2.1.1 Production Analysis by Volume
- 5.1.2.1.2 Consumption Analysis by Value and Volume
- 5.1.2.1.3 Import Analysis by Value and Volume
- 5.1.2.1.4 Export Analysis by Value and Volume
- 5.1.2.1.5 Wholesale Price Trend Analysis
- 5.1.2.2 United Kingdom
- 5.1.2.2.1 Production Analysis by Volume
- 5.1.2.2.2 Consumption Analysis by Value and Volume
- 5.1.2.2.3 Import Analysis by Value and Volume
- 5.1.2.2.4 Export Analysis by Value and Volume
- 5.1.2.2.5 Wholesale Price Trend Analysis
- 5.1.2.3 Poland
- 5.1.2.3.1 Production Analysis by Volume
- 5.1.2.3.2 Consumption Analysis by Value and Volume
- 5.1.2.3.3 Import Analysis by Value and Volume
- 5.1.2.3.4 Export Analysis by Value and Volume
- 5.1.2.3.5 Wholesale Price Trend Analysis
- 5.1.2.4 Italy
- 5.1.2.4.1 Production Analysis by Volume
- 5.1.2.4.2 Consumption Analysis by Value and Volume
- 5.1.2.4.3 Import Analysis by Value and Volume
- 5.1.2.4.4 Export Analysis by Value and Volume
- 5.1.2.4.5 Wholesale Price Trend Analysis
- 5.1.2.5 France
- 5.1.2.5.1 Production Analysis by Volume
- 5.1.2.5.2 Consumption Analysis by Value and Volume
- 5.1.2.5.3 Import Analysis by Value and Volume
- 5.1.2.5.4 Export Analysis by Value and Volume
- 5.1.2.5.5 Wholesale Price Trend Analysis
- 5.1.2.6 Turkey
- 5.1.2.6.1 Production Analysis by Volume
- 5.1.2.6.2 Consumption Analysis by Value and Volume
- 5.1.2.6.3 Import Analysis by Value and Volume
- 5.1.2.6.4 Export Analysis by Value and Volume
- 5.1.2.6.5 Wholesale Price Trend Analysis
- 5.1.3 Asia-Pacific
- 5.1.3.1 China
- 5.1.3.1.1 Production Analysis by Volume
- 5.1.3.1.2 Consumption Analysis by Value and Volume
- 5.1.3.1.3 Import Analysis by Value and Volume
- 5.1.3.1.4 Export Analysis by Value and Volume
- 5.1.3.1.5 Wholesale Price Trend Analysis
- 5.1.3.2 New Zealand
- 5.1.3.2.1 Production Analysis by Volume
- 5.1.3.2.2 Consumption Analysis by Value and Volume
- 5.1.3.2.3 Import Analysis by Value and Volume
- 5.1.3.2.4 Export Analysis by Value and Volume
- 5.1.3.2.5 Wholesale Price Trend Analysis
- 5.1.3.3 Japan
- 5.1.3.3.1 Production Analysis by Volume
- 5.1.3.3.2 Consumption Analysis by Value and Volume
- 5.1.3.3.3 Import Analysis by Value and Volume
- 5.1.3.3.4 Export Analysis by Value and Volume
- 5.1.3.3.5 Wholesale Price Trend Analysis
- 5.1.3.4 India
- 5.1.3.4.1 Production Analysis by Volume
- 5.1.3.4.2 Consumption Analysis by Value and Volume
- 5.1.3.4.3 Import Analysis by Value and Volume
- 5.1.3.4.4 Export Analysis by Value and Volume
- 5.1.3.4.5 Wholesale Price Trend Analysis
- 5.1.4 South America
- 5.1.4.1 Brazil
- 5.1.4.1.1 Production Analysis by Volume
- 5.1.4.1.2 Consumption Analysis by Value and Volume
- 5.1.4.1.3 Import Analysis by Value and Volume
- 5.1.4.1.4 Export Analysis by Value and Volume
- 5.1.4.1.5 Wholesale Price Trend Analysis
- 5.1.4.2 Argentina
- 5.1.4.2.1 Production Analysis by Volume
- 5.1.4.2.2 Consumption Analysis by Value and Volume
- 5.1.4.2.3 Import Analysis by Value and Volume
- 5.1.4.2.4 Export Analysis by Value and Volume
- 5.1.4.2.5 Wholesale Price Trend Analysis
- 5.1.4.3 Chile
- 5.1.4.3.1 Production Analysis by Volume
- 5.1.4.3.2 Consumption Analysis by Value and Volume
- 5.1.4.3.3 Import Analysis by Value and Volume
- 5.1.4.3.4 Export Analysis by Value and Volume
- 5.1.4.3.5 Wholesale Price Trend Analysis
- 5.1.5 Middle East and Africa
- 5.1.5.1 South Africa
- 5.1.5.1.1 Production Analysis by Volume
- 5.1.5.1.2 Consumption Analysis by Value and Volume
- 5.1.5.1.3 Import Analysis by Value and Volume
- 5.1.5.1.4 Export Analysis by Value and Volume
- 5.1.5.1.5 Wholesale Price Trend Analysis
- 5.1.5.2 Egypt
- 5.1.5.2.1 Production Analysis by Volume
- 5.1.5.2.2 Consumption Analysis by Value and Volume
- 5.1.5.2.3 Import Analysis by Value and Volume
- 5.1.5.2.4 Export Analysis by Value and Volume
- 5.1.5.2.5 Wholesale Price Trend Analysis
- 5.1.1 North America