
|
市場調査レポート
商品コード
1444172
ブドウのバリューチェーン分析:市場シェア分析、業界動向と統計、成長予測(2024-2029年)Grapes Value Chain Analysis - Market Share Analysis, Industry Trends & Statistics, Growth Forecasts (2024 - 2029) |
||||||
カスタマイズ可能
適宜更新あり
|
|||||||
| ブドウのバリューチェーン分析:市場シェア分析、業界動向と統計、成長予測(2024-2029年) |
|
出版日: 2024年02月15日
発行: Mordor Intelligence
ページ情報: 英文 70 Pages
納期: 2~3営業日
|

全表示
- 概要
- 目次
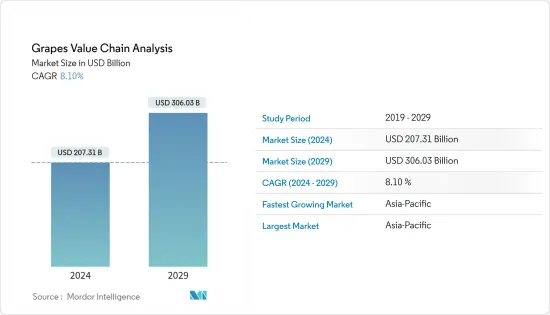
ブドウ市場規模は2024年に2,073億1,000万米ドルと推定され、2029年までに3,060億3,000万米ドルに達すると予測されており、予測期間(2024年から2029年)中に8.10%のCAGRで成長します。
主なハイライト
- ブドウは最大の果樹作物の1つであり、2021年には世界中で約6,729,198ヘクタールの面積が収穫されました。米国農務省の報告書によると、2021年の世界の生食用ブドウ生産量は約2,550万トン(MMT)に達しました。生食用ブドウとワイン用ブドウは、世界中で栽培されている2つの主要な種類のブドウであり、そのうち生食用ブドウは生で消費可能です。
- 農家はブドウのバリューチェーンにおける主要な利害関係者であり、ブドウの生産プロセスに関与します。農家には、種子、人件費、トラクター、輸送費など、さまざまなコストがかかります。集積業者/農業協同組合は、ブドウのバリューチェーンにおいて農家に次ぐ利害関係者です。
- 集積業者/農業協同組合の輸出業者がその役割を担うようになってからは、ブドウの主要輸出国は米国、ペルー、チリ、オランダとなります。輸出業者が負担するコストには、人件費、輸送費、諸経費、バルク梱包費、肥料、作物保護費、保険料などが含まれます。また、輸出業者は、ある港から別の港への輸送中に不利な状況が発生した場合でも、投資した資本を保護するために、輸出する商品や車両の価値に対して保険を支払います。
- チェーンが進むと、輸出業者の次に輸入業者、卸売業者が登場します。そして、ブドウのバリューチェーンにおける最後の利害関係者は小売業者です。小売業者が負担するコストには、輸送費、諸経費、梱包費などが含まれます。
- 新鮮なブドウの新しい品種を開発するには、多大な投資と実験が必要です。研究開発活動と立ち上げ。ブドウ品種の結びつきを新たに生産することは、ブドウ市場の将来の発展のために官民の企業によって世界中で主に行われています。たとえば、最近、エンブラパ、ブラジル農業調査公社、セミアリドは、ブラジル北東部での生産専用に品種改良された初の食用ブドウ品種BRSタイナを発表しました。 BRSタイナは、サンフランシスコバレーの生育条件に合わせて開発された、「中立的で心地よい風味」を持つ白色の種なし品種です。また、成長が早く、活発な品種でもあり、生産サイクルごとにヘクタールあたり平均25トンの収量があり、房の重さは約270g、大きさは15cm x 10cmの中型です。
ブドウのバリューチェーン分析市場動向
消費者の需要と意識の高まりによる生産量の増加
ブドウの消費に伴う健康上の利点に対する消費者の意識の高まりにより、主要生産国は消費者の需要の高まりに応えるために生産量を年々増加させています。ブドウに含まれる栄養素には、抗炎症効果があることが示されています。新鮮なブドウを摂取することも血圧の調整に役立ちます。
慢性疾患の治療に役立つ高レベルの抗酸化物質、ビタミンC、Kなどのブドウの栄養上の利点により、需要が増加しています。その後、生のブドウの生産量が増加しました。たとえば、FAOによると、インドのブドウ生産量は2018年の2,920,000ヘクタールから2021年には3,358,000ヘクタールに増加しており、将来のブドウ市場の潜在的な成長を示しています。
カリフォルニア生食用ブドウ委員会によると、ブドウには食用の日焼け止めとして機能するポリフェノールなどの天然化合物が含まれているため、毎日約2~2.25カップの新鮮なブドウを摂取すると、紫外線によって引き起こされる病気から皮膚を守ることができます。その後、消費者のブドウに対する需要が増加し、全体の消費量が急増しています。
さらに、FAOが公開したデータベースによると、中国やトルコなどの国々がブドウの主要生産国であり、2021年のブドウ生産量はそれぞれ1,126万9,900トンと367万トンを占めています。さらに、ブラジル、米国などの国も、州とウズベキスタンも世界的にブドウの主要生産国であると考えられています。
カリフォルニア生食用ブドウ委員会によると、2020年、米国の重要な買い物客の46%が生のブドウを家庭の必需品と認識しており、2019年の32%から増加しました。また、別の35%はブドウが家庭で頻繁に購入されていると主張しています。これは、国内のブドウの消費者が増加していることを示しており、この地域でのビーガン傾向の高まりにより、今後数年間でさらに増加すると予想されています。
したがって、健康志向の高まりにより、世界中でブドウの消費量が増加すると予想され、それによって予測期間中に市場が急増すると予想されます。
中国がブドウの生産を独占
中国は世界のブドウ生産量を独占しています。中国は約1,130万トンのブドウを生産し、2021年も引き続きアジア太平洋および世界最大のブドウ生産国であり、2021年に世界中で生産されたブドウ総量の約15.3%を占めました。
この国の生産は主に新疆、河北、山東、クラウド南、河南、遼寧などの地域に集中しています。中国の多くの農家は伝統的なブドウ品種を、より収益性の高い品種に置き換えています。巨峰、レッドグローブ、マスカットが依然として主要な品種ですが、サマーブラック、シャインマスカット、ジャンボマスカット、ゴールドフィンガー、クリムゾンシードレスなどの他の品種の栽培も国内で盛んになっています。
さらに、ブドウはワインの生産に使用される主要な果物であるため、国内のワイン産業は年々拡大しており、ブドウの生産にプラスの影響を与えています。中国南部では、ブドウ生産者は果実の品質を向上させたり、供給期間を延長したりするために、生産設備へのさらなる投資に積極的です。温室ブドウ畑または雨よけ施設を備えたブドウ畑は、ブドウ総面積の約25%を占め、成長していると推定されています。したがって、投資の増加はブドウの生産量の増加をもたらし、その結果、予測期間中に調査された市場の全体的な成長につながります。
その他の特典
- エクセル形式の市場予測(ME)シート
- 3か月のアナリストサポート
目次
第1章 イントロダクション
- 調査の前提条件と市場の定義
- 調査範囲
第2章 調査手法
第3章 エグゼクティブサマリー
第4章 バリューチェーン分析
- バリューチェーンの概要
- バリューチェーンの価格値上げ
- バリューチェーンの利害関係者
- バリューチェーンの問題と課題
第5章 サプライチェーン分析
- サプライチェーンの概要
- サプライチェーンの価格値上げ
- サプライチェーンの利害関係者
- サプライチェーンの問題と課題
第6章 市場機会と将来の動向
The Grapes Market size is estimated at USD 207.31 billion in 2024, and is expected to reach USD 306.03 billion by 2029, growing at a CAGR of 8.10% during the forecast period (2024-2029).
Key Highlights
- Grapes are one of the largest fruit crops, with approximately 6,729,198 hectares of area harvested worldwide in 2021. According to a United States Department of Agriculture report, global table grape production in 2021 reached about 25.5 million metric tons (MMT). Table grapes and wine grapes are the two major types of grapes grown worldwide, out of which table grapes are freshly consumable.
- The Farmers are the primary stakeholder in the grape value chain, and they involve in the process of production of grapes. Farmers incur various costs, including seed, labor, tractor, and transportation. Aggregators/farmer co-operatives are the stakeholders in the grape value chain next to farmers.
- After aggregators/farmer co-operatives exporters come into the role, the major exporters of grapes are the United States, Peru, Chile, and the Netherlands. The costs incurred by exporters include labor, transportation, overheads, bulk packaging, fertilizer, crop protection, and insurance charges. Exporters also pay insurance for the value of the commodity and vehicle they are exporting to safeguard the capital invested, despite the adverse situations during transport from one port to another.
- Moving forward in the chain, importers, and wholesalers come next to exporters. And the final stakeholders in the grape value chain are retailers. Costs incurred by the retailers include transportation, overheads, and packaging costs.
- Developing new varieties of fresh grapes requires significant investment and experimentation. The R&D activities and launching of. It produces grapes varieties tiesfreshmanainly being carried out around the globe by public and private firms for future development in the grape market. For instance, recently, Embrapa, the Brazilian Agricultural Research Corporation, Semiarido unveiled the first table grape variety BRS Taina to be bred exclusively for production in the northeast of Brazil. BRS Taina is a white seedless variety with a 'neutral and pleasant flavor,' developed to suit the growing conditions in the Sao Francisco Valley. It is also a fast-growing, vigorous variety with an average yield of 25 tonnes per hectare per production cycle,' medium-sized bunches weighing around 270g and measuring 15cm x 10cm.
Grapes Value Chain Analysis Market Trends
Increased Production Due to Rise in Consumer Demand and Awareness
The increased awareness among consumers regarding the health benefits associated with the consumption of grapes has led major producing countries to increase their production year-on-year to meet the rising consumer demand. Nutrients found in grapes have been shown to have anti-inflammatory benefits. Consuming fresh grapes can also help regulate blood pressure.
Due to the nutritional benefits of grapes, such as higher levels of antioxidants, vitamin C, K, etc., that help cure chronic diseases, the demand is increasing. Subsequently, the production of fresh grapes increased. For instance, according to FAO, the production of grapes in India increased from 2,920,000 hectares in 2018 to 3,358,000 hectares in 2021, indicating the potential growth of the grapes market in the future.
According to the California Table Grape Commission, consuming about 2-2.25 cups of fresh grapes daily can protect the skin against diseases caused by ultraviolet rays, as grapes contain natural compounds such as polyphenols that act as edible sunscreen. Subsequently, the demand for grapes among consumers is increasing, thereby spiraling the overall consumption.
Furthermore, according to the database published by FAO, countries such as China and Turkey are the primary producers of grapes, accounting for 11,269,900 metric ton and 3,670,000 metric ton of grapes production, respectively, in 2021. Moreover, countries such as Brazil, the United States, and Uzbekistan are also considered to be the primary producers of grapes globally.
As per California Table Grape Commission, in 2020, 46% of significant shoppers in the United States perceived fresh grapes to be a staple in their household, rising from 32% in 2019. Another 35% claim grapes are frequently purchased in their homes. This points out that grapes consumers in the country are growing, which is further expected to increase in the coming years due to the rising veganism trend in the region.
Therefore, due to rising health consciousness, the consumption of grapes around the globe is expected to increase, thereby surging the market during the forecast period.
China Dominates the Production of Grapes
China dominates the production of grapes in the world. China produced approximately 11.3 million metric ton of grapes and remained the largest grape-producing country in Asia-Pacific and the world in 2021, comprising approximately 15.3% of the total volume of grapes produced around the globe in 2021.
The country has its production mainly concentrated in regions such as Xinjiang, Hebei, Shandong, Yunnan, Henan, and Liaoning, among others. Many farmers in China have been replacing traditional grape varieties with more profitable cultivars. Although kyoho, red globe, and muscat remain the dominant varieties, the cultivation of other varieties such as summer black, shine muscat, jumbo muscat, gold finger, and crimson seedless is also gaining momentum in the country.
Furthermore, the wine industry expanding year on year in the country positively impacts the production of grapes as grapes are the primary fruits used in the production of wines. In Southern China, Grape producers are willing to invest more in production facilities to improve fruit quality or lengthen the supply season. It is estimated that greenhouse vineyards or vineyards with rain shield facilities account for around 25% of total grape acreage and are growing. Therefore, Rising investment results in increased production of grapes which results in the overall growth of the market studied during the forecast period.
Additional Benefits:
- The market estimate (ME) sheet in Excel format
- 3 months of analyst support
TABLE OF CONTENTS
1 INTRODUCTION
- 1.1 Study Assumptions and Market Definition
- 1.2 Scope of the Study
2 RESEARCH METHODOLOGY
3 EXECUTIVE SUMMARY
4 VALUE CHAIN ANALYSIS
- 4.1 Value Chain Overview
- 4.2 Price Markups in the Value Chain
- 4.3 Stakeholders in the Value Chain
- 4.4 Issues and Challenges in the Value Chain
5 SUPPLY CHAIN ANALYSIS
- 5.1 Supply Chain Overview
- 5.2 Price Markups in the Supply Chain
- 5.3 Stakeholders in the Supply Chain
- 5.4 Issues and Challenges in the Supply Chain

