
|
市場調査レポート
商品コード
1693517
リン酸肥料:市場シェア分析、産業動向・統計、成長予測(2025年~2030年)Phosphatic Fertilizer - Market Share Analysis, Industry Trends & Statistics, Growth Forecasts (2025 - 2030) |
||||||
カスタマイズ可能
適宜更新あり
|
|||||||
| リン酸肥料:市場シェア分析、産業動向・統計、成長予測(2025年~2030年) |
|
出版日: 2025年03月18日
発行: Mordor Intelligence
ページ情報: 英文 321 Pages
納期: 2~3営業日
|

全表示
- 概要
- 目次
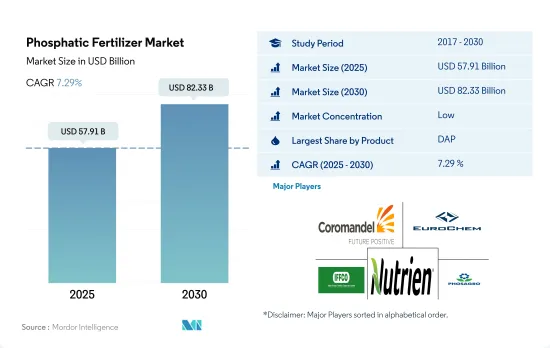
リン酸肥料市場規模は2025年に579億1,000万米ドルと推定され、2030年には823億3,000万米ドルに達すると予測され、予測期間中(2025~2030年)のCAGRは7.29%で成長する見込みです。
土壌中のリン含有量の減少と作物生育におけるリン元素の必要性が市場を牽引する可能性
- リン酸二アンモニウム(DAP)は2022年のリン酸肥料市場を席巻し、3,090万トンに相当する41.3%の世界消費シェアを獲得しました。DAPの人気は、リン酸46.0%、アンモニウム18.0%という組成が窒素源として機能することに起因しています。このため、DAPは世界中の農家にとって最良の選択肢となっています。DAPの市場価値は2022年に233億米ドルに達しました。
- リン酸一アンモニウム(MAP)は、DAPに次いで2番目に好まれるリン酸肥料として浮上しました。MAPの世界市場は2022年に113億米ドルと評価され、消費量は1,530万トンに達しました。特筆すべきは、MAPの水溶性リン酸含量が約90%で、作物の生育要件を上回っていることです。
- トリプル過リン酸塩(TSP)は、リン酸含有率が46.0%と最も高い純粋なリン酸塩ベースの肥料で、2022年の世界のリン酸肥料消費量の21.1%を占めました。TSP市場は、特にマメ科作物の栽培面積の拡大とともに成長する見込みです。
- 単一過リン酸塩(SSP)は2022年の世界のリン酸肥料消費量の16.7%を占めました。SSPは、食用油に重要な硫黄微量要素や酸性土壌でのカルシウム栄養素を供給する役割を果たすため、油糧作物で重要な用途を見出しています。これらの要因は、今後数年間でSSPの使用量が増加する可能性を示しています。
- リン酸肥料市場は堅調な成長が見込まれ、2023年から2030年までのCAGRは7.0%と推定されます。この成長の主因は、作物収量の向上を目指す農家が増えるにつれてリン酸肥料の需要が世界的に高まっていることです。
生産性を向上させる必要性とリン酸欠乏症に対処する需要の高まりが市場の成長を促進すると予想されます。
- アジア太平洋地域は世界のリン酸肥料市場を独占し、市場全体の約58.6%を占め、2022年には約328億米ドルを計上しました。2022年、DAPはアジア太平洋のリン酸肥料市場で49.8%の市場シェアを占めました。この地域でDAPの需要が大きいのは、TSPやSSPといった他のリン酸肥料よりも効率が高いためです。
- 中国は世界有数のリン肥料の生産国で、2022年のリン肥料の世界市場における金額シェアは約10.3%でした。その輸出は世界の輸出の約25.3%を占めています。中国からの輸入上位国はインドネシア、オーストラリア、イランです。
- 北米は10.6%で第2位の市場シェアを確保しました。リン酸肥料は窒素肥料に次いで作物にとって重要な栄養源です。北米では、リン酸一アンモニウム(MAP)が66.3%、リン酸二アンモニウム(DAP)が30.9%のシェアを占めています。MAPはリン酸塩含有量が高く、需要を牽引しました。
- 2022年、南米のリン酸肥料市場は世界市場の20.3%のシェアを占め、2023~2030年のCAGRは6.9%と予測されます。
- 世界のリン酸肥料市場は、主にCOVID-19の大流行による混乱に起因する2020年の落ち込みを除けば、金額・数量ともに一貫した上昇軌道をたどっています。しかし、2023年から2030年にかけては、世界の耕作面積の減少によって、市場規模は回復すると予想されます。
世界のリン酸肥料市場動向
増大する食糧需要を満たすための農業への圧力の高まりにより、畑作物の栽培面積が増加すると予想される
- 世界の農業セクターは多くの課題に取り組んでいます。国連は、2050年までに世界人口が90億人を突破すると予測しており、すでに労働力不足や都市化による畑の縮小に悩まされている農業に負担をかける可能性があります。国連食糧農業機関は、2050年までに世界人口の70%が都市部に居住するようになると予測しています。世界中で耕地が減少するなか、農家は食糧需要の増加に対応するため、作物の収量を増やす肥料への依存を強めています。
- アジア太平洋地域は世界有数の農業生産地であり、その労働力の約20%を農業が占めています。畑作が主流で、この地域の作付面積の95%以上を占めています。米、小麦、トウモロコシは、2022年の作付面積の24.3%を占め、この地域の主要な畑作物です。
- 北米は世界第2位の耕作可能地域であり、畑作物を中心とした多様な作物ポートフォリオを誇っています。特に、トウモロコシ、綿花、米、大豆、小麦が中心となっていることは、米国農務省が強調しているとおりです。2022年、米国は北米の作物栽培面積の46.2%を占めました。しかし、テキサスやヒューストンのような地域での大洪水を含む悪環境が、2017年から2019年にかけて同国の作物栽培面積を大幅に減少させ、気候変動に対する農業生産の脆弱性を浮き彫りにしました。
キャノーラはカリウム肥料の施用量が世界的に最も多く、平均施用量は248.6kg/haです。
- トウモロコシ、菜種、綿花、ソルガム、米、小麦、大豆は、養分要求量が高いことで知られる世界的に著名な作物です。2022年のこれらの作物の平均一次養分施用量は、トウモロコシ(230.57 kg/ha)、菜種(255.75 kg/ha)、綿(172.70 kg/ha)、ソルガム(158.46 kg/ha)、米(154.49 kg/ha)、小麦(135.35 kg/ha)、大豆(120.97 kg/ha)でした。一次栄養素は作物にとって不可欠であり、代謝プロセスを促進し、細胞、細胞膜、クロロフィルなど、植物に不可欠な組織の形成に寄与します。特に、リンは高品質な作物の栽培に不可欠であり、カリウムは植物の成長に必要な酵素の活性化に極めて重要な役割を果たしています。
- 世界規模では、畑作物の窒素、カリウム、リンの平均養分施用量は164.31kg/haです。最も広く使用されている主要養分としては窒素がトップで、施用量は224.6 kg/ha、次いでカリウムが150.3 kg/haです。リンは第3位で、2022年の消費量は117.9kg/haです。
- 2022年の窒素施用量は菜種が最も多く347.4kg/haでした。リンの施用量はトウモロコシが156.3 kg/haでトップ、カリウムの施用量はキャノーラが248.6 kg/haでトップです。
- 畑作物の栽培は世界的に増加しており、南米とアジア太平洋での伸びが顕著です。これらの地域は肥料の主要市場として台頭してきています。欧州や北米のような開発先進地域は、栄養不足に悩む地域とともに、その有効性を求めて特殊肥料に目を向けるようになっています。このような力学は、今後数年間、主栄養肥料市場を活性化させると思われます。
リン酸肥料産業の概要
リン酸肥料市場は断片化されており、上位5社で13.55%を占めています。この市場の主要企業は以下の通りです。 Coromandel International Ltd., EuroChem Group, Indian Farmers Fertiliser Cooperative Limited, Nutrien Ltd. and PhosAgro Group of Companies(アルファベット順)
その他の特典
- エクセル形式の市場予測(ME)シート
- 3ヶ月のアナリストサポート
目次
第1章 エグゼクティブサマリーと主な調査結果
第2章 レポートのオファー
第3章 イントロダクション
- 調査の前提条件と市場定義
- 調査範囲
- 調査手法
第4章 主要産業動向
- 主要作物の作付面積
- 畑作物
- 園芸作物
- 平均養分施用率
- 主要養分
- 畑作物
- 園芸作物
- 主要養分
- 灌漑設備のある農地
- 規制の枠組み
- バリューチェーンと流通チャネル分析
第5章 市場セグメンテーション
- タイプ
- ストレート
- リン系
- DAP
- MAP
- SSP
- TSP
- その他
- ストレート
- 施肥モード
- 施肥
- 葉面散布
- 土壌
- 作物タイプ
- 畑作物
- 園芸作物
- 芝・観賞用
- 地域
- アジア太平洋
- オーストラリア
- バングラデシュ
- 中国
- インド
- インドネシア
- 日本
- パキスタン
- フィリピン
- タイ
- ベトナム
- その他アジア太平洋地域
- 欧州
- フランス
- ドイツ
- イタリア
- オランダ
- ロシア
- スペイン
- ウクライナ
- 英国
- その他欧州
- 中東・アフリカ
- ナイジェリア
- サウジアラビア
- 南アフリカ
- トルコ
- その他中東とアフリカ
- 北米
- カナダ
- メキシコ
- 米国
- その他北米地域
- 南米
- アルゼンチン
- ブラジル
- その他南米
- アジア太平洋
第6章 競合情勢
- 主要な戦略動向
- 市場シェア分析
- 企業情勢
- 企業プロファイル
- Coromandel International Ltd.
- EuroChem Group
- Indian Farmers Fertiliser Cooperative Limited
- K+S Aktiengesellschaft
- Koch Industries Inc.
- Nutrien Ltd.
- PhosAgro Group of Companies
- SABIC Agri-Nutrients Co.
第7章 CEOへの主な戦略的質問
第8章 付録
- 世界概要
- 概要
- ファイブフォース分析フレームワーク
- 世界のバリューチェーン分析
- 市場力学(DROs)
- 情報源と参考文献
- 図表一覧
- 主要洞察
- データパック
- 用語集
The Phosphatic Fertilizer Market size is estimated at 57.91 billion USD in 2025, and is expected to reach 82.33 billion USD by 2030, growing at a CAGR of 7.29% during the forecast period (2025-2030).
Reducing phosphorous content in the soils and the need for the element in crop growth may drive the market
- Diammonium phosphate (DAP) dominated the phosphatic fertilizer market in 2022, capturing a significant 41.3% global consumption share, equivalent to 30.9 million metric tons. Its popularity stems from its composition, with 46.0% phosphate and 18.0% ammonium, serving as a nitrogen source. This made DAP the top choice for farmers worldwide. The market value of DAP reached USD 23.3 billion in 2022.
- Monoammonium phosphate (MAP) emerged as the second most favored phosphatic fertilizer, trailing behind DAP. The global MAP market, valued at USD 11.3 billion in 2022, witnessed a consumption volume of 15.3 million metric tons. Notably, MAP boasts a water-soluble P content of around 90%, surpassing the crop growth requirements.
- Triple superphosphate (TSP), a pure phosphate-based fertilizer with the highest phosphate content of 46.0%, accounted for 21.1% of global phosphate fertilizer consumption in 2022. The TSP market is poised for growth, especially with the expansion of legume crop cultivation areas.
- Single superphosphate (SSP) constituted 16.7% of global phosphatic fertilizer consumption in 2022. SSP finds significant usage in oilseed crops, owing to its role in providing crucial sulfur trace elements for edible oils and calcium nutrients in acidic soils. These factors indicate a potential uptick in SSP usage in the coming years.
- The phosphatic fertilizer market is projected to witness robust growth, with an estimated CAGR of 7.0% from 2023 to 2030. This growth is primarily driven by the escalating global demand for phosphatic fertilizers as more farmers seek to enhance their crop yields.
The need to improve productivity and rising demand to address the phosphate deficiency are expected to fuel the growth of the market
- The Asia-Pacific region dominated the global phosphatic fertilizer market and accounted for about 58.6% of the total market value, accounting for about USD 32.8 billion in 2022. In 2022, DAP occupied a market share of 49.8% in the Asia-Pacific phosphatic fertilizers market. The greater demand for DAP in the region is due to its greater efficiency than other phosphatic fertilizers like TSP and SSP.
- China was the world's leading producer of phosphorus fertilizers, accounting for nearly 10.3% value share of the global phosphatic fertilizer market in 2022. Its exports represented approximately 25.3% of the world's exports. The top importers from China are Indonesia, Australia, and Iran.
- North America secured the second-largest market share at 10.6%. Phosphatic fertilizers, after nitrogen fertilizers, are the second most crucial nutrient source for crops. In North America, mono ammonium phosphate (MAP) and diammonium phosphate (DAP) dominated the market in 2022, with shares of 66.3% and 30.9%, respectively. The high phosphate content in MAP drove its demand.
- In 2022, the South American phosphatic fertilizer market held a 20.3% share of the global market, and it is projected to register a CAGR of 6.9% during 2023-2030.
- The global phosphatic fertilizer market has witnessed a consistent upward trajectory in both value and volume, barring a dip in 2020, primarily attributed to the disruptions caused by the COVID-19 pandemic. However, the market value is expected to rebound during 2023-2030, driven by a decline in global cultivation areas.
Global Phosphatic Fertilizer Market Trends
The rising pressure on the agriculture industry to meet the growing food demand is expected to increase the area under field crop cultivation
- The global agricultural sector grapples with numerous challenges. The United Nations projects a world population surpassing 9 billion by 2050, potentially straining an agricultural industry already struggling with labor shortages and shrinking fields due to urbanization. The Food and Agriculture Organization predicts that by 2050, 70% of the global population will reside in urban areas. With arable land dwindling worldwide, farmers are increasingly relying on fertilizers to bolster crop yields in an effort to meet the rising demand for food.
- The Asia-Pacific region stands as the leading global agricultural producer, with agriculture employing roughly 20% of its workforce. Field crop cultivation dominates, encompassing over 95% of the region's crop area. Rice, wheat, and corn, collectively occupying 24.3% of the crop area in 2022, are the primary field crops in the region, which is a testament to the region's agricultural diversity and productivity.
- North America ranks as the second-largest arable region globally, boasting a diverse crop portfolio with a focus on field crops. Notably, corn, cotton, rice, soybean, and wheat take center stage, as highlighted by the USDA. In 2022, the United States commanded 46.2% of North America's crop cultivation area. However, adverse environmental conditions, including severe flooding in regions like Texas and Houston, led to a significant drop in the country's crop acreage between 2017 and 2019, underscoring the vulnerability of agricultural production to climate change.
Canola has the highest application rate of potassic fertilizers globally, with an average application rate of 248.6 kg/ha
- Corn, rapeseed, cotton, sorghum, rice, wheat, and soybean are prominent crops globally, known for their high nutrient requirements. The average primary nutrient application rates for these crops in 2022 were as follows: corn (230.57 kg/ha), rapeseed (255.75 kg/ha), cotton (172.70 kg/ha), sorghum (158.46 kg/ha), rice (154.49 kg/ha), wheat (135.35 kg/ha), and soybean (120.97 kg/ha). Primary nutrients are vital for crops, facilitating metabolic processes and contributing to the formation of essential plant tissues, including cells, cell membranes, and chlorophyll. Notably, phosphorus is crucial for cultivating high-quality crops, while potassium plays a pivotal role in activating enzymes necessary for plant growth.
- On a global scale, field crops have an average nutrient application rate of 164.31 kg/ha for nitrogen, potassium, and phosphorus. Nitrogen takes the lead as the most widely used primary nutrient, with an application rate of 224.6 kg/ha, followed by potassium at 150.3 kg/ha. Phosphorus ranks third, with a consumption rate of 117.9 kg/ha in 2022.
- In 2022, rapeseed had the highest nitrogen application rate at 347.4 kg/ha. Corn led in phosphorus application at 156.3 kg/ha, and canola topped in potassium application at 248.6 kg/ha.
- Field crop cultivation is rising globally, with notable growth in South America and Asia-Pacific. These regions are emerging as key markets for fertilizers. Developed regions like Europe and North America, along with areas grappling with nutrient deficiencies, are increasingly turning to specialty fertilizers for their efficacy. These dynamics are poised to fuel the primary nutrient fertilizers market in the coming years.
Phosphatic Fertilizer Industry Overview
The Phosphatic Fertilizer Market is fragmented, with the top five companies occupying 13.55%. The major players in this market are Coromandel International Ltd., EuroChem Group, Indian Farmers Fertiliser Cooperative Limited, Nutrien Ltd. and PhosAgro Group of Companies (sorted alphabetically).
Additional Benefits:
- The market estimate (ME) sheet in Excel format
- 3 months of analyst support
TABLE OF CONTENTS
1 EXECUTIVE SUMMARY & KEY FINDINGS
2 REPORT OFFERS
3 INTRODUCTION
- 3.1 Study Assumptions & Market Definition
- 3.2 Scope of the Study
- 3.3 Research Methodology
4 KEY INDUSTRY TRENDS
- 4.1 Acreage Of Major Crop Types
- 4.1.1 Field Crops
- 4.1.2 Horticultural Crops
- 4.2 Average Nutrient Application Rates
- 4.2.1 Primary Nutrients
- 4.2.1.1 Field Crops
- 4.2.1.2 Horticultural Crops
- 4.2.1 Primary Nutrients
- 4.3 Agricultural Land Equipped For Irrigation
- 4.4 Regulatory Framework
- 4.5 Value Chain & Distribution Channel Analysis
5 MARKET SEGMENTATION (includes market size in Value in USD and Volume, Forecasts up to 2030 and analysis of growth prospects)
- 5.1 Type
- 5.1.1 Straight
- 5.1.1.1 Phosphatic
- 5.1.1.1.1 DAP
- 5.1.1.1.2 MAP
- 5.1.1.1.3 SSP
- 5.1.1.1.4 TSP
- 5.1.1.1.5 Others
- 5.1.1 Straight
- 5.2 Application Mode
- 5.2.1 Fertigation
- 5.2.2 Foliar
- 5.2.3 Soil
- 5.3 Crop Type
- 5.3.1 Field Crops
- 5.3.2 Horticultural Crops
- 5.3.3 Turf & Ornamental
- 5.4 Region
- 5.4.1 Asia-Pacific
- 5.4.1.1 Australia
- 5.4.1.2 Bangladesh
- 5.4.1.3 China
- 5.4.1.4 India
- 5.4.1.5 Indonesia
- 5.4.1.6 Japan
- 5.4.1.7 Pakistan
- 5.4.1.8 Philippines
- 5.4.1.9 Thailand
- 5.4.1.10 Vietnam
- 5.4.1.11 Rest of Asia-Pacific
- 5.4.2 Europe
- 5.4.2.1 France
- 5.4.2.2 Germany
- 5.4.2.3 Italy
- 5.4.2.4 Netherlands
- 5.4.2.5 Russia
- 5.4.2.6 Spain
- 5.4.2.7 Ukraine
- 5.4.2.8 United Kingdom
- 5.4.2.9 Rest of Europe
- 5.4.3 Middle East & Africa
- 5.4.3.1 Nigeria
- 5.4.3.2 Saudi Arabia
- 5.4.3.3 South Africa
- 5.4.3.4 Turkey
- 5.4.3.5 Rest of Middle East & Africa
- 5.4.4 North America
- 5.4.4.1 Canada
- 5.4.4.2 Mexico
- 5.4.4.3 United States
- 5.4.4.4 Rest of North America
- 5.4.5 South America
- 5.4.5.1 Argentina
- 5.4.5.2 Brazil
- 5.4.5.3 Rest of South America
- 5.4.1 Asia-Pacific
6 COMPETITIVE LANDSCAPE
- 6.1 Key Strategic Moves
- 6.2 Market Share Analysis
- 6.3 Company Landscape
- 6.4 Company Profiles
- 6.4.1 Coromandel International Ltd.
- 6.4.2 EuroChem Group
- 6.4.3 Indian Farmers Fertiliser Cooperative Limited
- 6.4.4 K+S Aktiengesellschaft
- 6.4.5 Koch Industries Inc.
- 6.4.6 Nutrien Ltd.
- 6.4.7 PhosAgro Group of Companies
- 6.4.8 SABIC Agri-Nutrients Co.
7 KEY STRATEGIC QUESTIONS FOR FERTILIZER CEOS
8 APPENDIX
- 8.1 Global Overview
- 8.1.1 Overview
- 8.1.2 Porter's Five Forces Framework
- 8.1.3 Global Value Chain Analysis
- 8.1.4 Market Dynamics (DROs)
- 8.2 Sources & References
- 8.3 List of Tables & Figures
- 8.4 Primary Insights
- 8.5 Data Pack
- 8.6 Glossary of Terms

