|
|
市場調査レポート
商品コード
1693822
日本のエンジニアリングプラスチックス:市場シェア分析、産業動向、成長予測(2024~2029年)Japan Engineering Plastics - Market Share Analysis, Industry Trends & Statistics, Growth Forecasts (2024 - 2029) |
||||||
|
|||||||
カスタマイズ可能
適宜更新あり
|
|||||||


| 日本のエンジニアリングプラスチックス:市場シェア分析、産業動向、成長予測(2024~2029年) |
|
出版日: 2025年03月18日
発行: Mordor Intelligence
ページ情報: 英文 263 Pages
納期: 2~3営業日
|

全表示
- 概要
- 目次
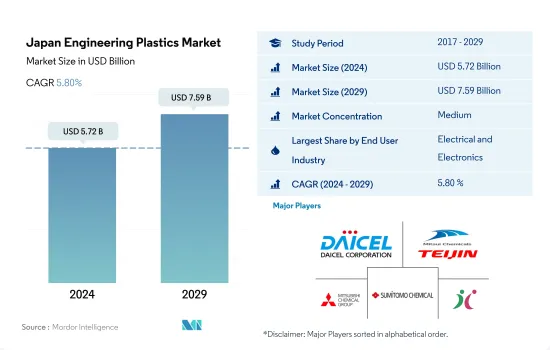
日本のエンジニアリングプラスチック市場規模は2024年に57億2,000万米ドルと推定・予測され、2029年には75億9,000万米ドルに達し、予測期間中(2024~2029年)のCAGRは5.80%で成長すると予測されます。
金額・数量ともに電気・電子産業が優位を維持
- エンジニアリングプラスチックの用途は、航空宇宙セグメントの内装壁パネルやドアから、硬質包装や軟質包装に至るまで幅広いです。日本のエンプラ市場は、包装、電気・電子、自動車産業が牽引しています。2022年のエンプラ市場数量に占める割合は、包装産業が約26.89%、電気・電子産業が約27.23%です。
- 電気・電子産業は国内最大です。例えば、日本のエレクトロニクス産業は2022年の国内生産が前年比2%増加し、総額843億4,000万米ドルに達しました。この成長は主に、輸出における電子部品デバイスの好調、自動車における電子部品の使用増加、5G技術の成長による電気測定器の需要増加によるものです。これらの要因により、国内のエンジニアリングプラスチックの消費量は増加し、2022年の数量成長率は前年比1.12%となりました。
- 2022年、自動車産業は収益シェアの25.65%を占め、国内第2位の有望産業となりました。2022年、日本の自動車産業は前年比15.15%の成長を遂げました。これは主に国内の自動車生産台数の増加によるもので、2022年には前年比3.49%増の941万台を記録しました。
- 航空宇宙産業は、航空宇宙産業における支出の増加により、CAGRが7.69%と予測され、売上高において国内で最も急成長している産業であり、これが予測期間中のエンジニアリングプラスチック需要を牽引すると予想されます。日本の航空宇宙部品生産収入は、2029年までに約170億米ドルに達すると予想されます。
日本のエンジニアリングプラスチック市場の動向
国内の電気・電子機器生産を支援する政府の施策
- 日本のエレクトロニクス産業は、部品やデバイスの生産に秀でており、全固体電池や医療用カメラなどの主要技術を生み出しています。政府の脱炭素化に向けた取り組みと、同産業が得意とするファクトリーオートメーションやテレワークを中心とした働き方改革に向けた機能開発により、さらなるイノベーションが期待されます。
- 米国と中国の貿易戦争によるチップ不足に直面し、リモートワーク化に伴う需要増が2019年の国内電子機器生産に影響を与えました。連続して、2020年のCOVID-19パンデミック関連の混乱により、日本の電子部品デバイス・電子回路製造業の事業所数は、前年の約3,860から減少し、約3,790と10年ぶりの低水準となりました。2020年の日本の生産額は、民生用電子機器が429億800万円、産業用電子機器が2,556億7,600万円でした。
- 日本は、2020~2021年にかけて、電気・電子機器の生産収入で19.2%の増加を記録しました。日本のエレクトロニクス産業の総生産額は、2021年には11兆円近くに達します。この産業には、消費者向け電子機器、産業用電子機器、電子部品デバイスが含まれます。民生用電子機器は日本の経済生産の3分の1を占めています。
- 米国大統領と日本の首相は半導体製造能力を強化することを約束し、日本もイノベーション部門に投資しているため、予測期間中に日本の電子産業が活性化する可能性があります。
日本のエンジニアリングプラスチックス産業概要
日本のエンジニアリングプラスチックス市場は適度に統合されており、上位5社で63.27%を占めています。この市場の主要企業は、Daicel Corporation、MCT PET Resin、Mitsubishi Chemical Corporation、Sumitomo Chemical、Techno-UMGなどです。
その他の特典
- エクセル形式の市場予測(ME)シート
- 3ヶ月のアナリストサポート
目次
第1章 エグゼクティブサマリーと主要調査結果
第2章 レポートのオファー
第3章 イントロダクション
- 調査の前提条件と市場定義
- 調査範囲
- 調査手法
第4章 主要産業動向
- エンドユーザー動向
- 航空宇宙
- 自動車
- 建築・建設
- 電気・電子
- 包装
- 輸出入動向
- 価格動向
- リサイクル概要
- ポリアミド(PA)のリサイクル動向
- ポリカーボネート(PC)のリサイクル動向
- ポリエチレンテレフタレート(PET)のリサイクル動向
- スチレン系共重合体(ABS、SAN)のリサイクル動向
- 規制の枠組み
- 日本
- バリューチェーンと流通チャネル分析
第5章 市場セグメンテーション
- エンドユーザー産業
- 航空宇宙
- 自動車
- 建築・建設
- 電気・電子
- 工業・機械
- 包装
- その他
- 樹脂タイプ
- フッ素樹脂
- サブタイプ別
- エチレンテトラフルオロエチレン(ETFE)
- フッ素化エチレンプロピレン(FEP)
- ポリテトラフルオロエチレン(PTFE)
- ポリフッ化ビニル(PVF)
- ポリフッ化ビニリデン(PVDF)
- その他のサブレジンタイプ
- 液晶ポリマー(LCP)
- ポリアミド(PA)
- サブレジンタイプ別
- アラミド
- ポリアミド(PA)6
- ポリアミド(PA)66
- ポリフタルアミド
- ポリブチレンテレフタレート(PBT)
- ポリカーボネート(PC)
- ポリエーテルエーテルケトン(PEEK)
- ポリエチレンテレフタレート(PET)
- ポリイミド(PI)
- ポリメチルメタクリレート(PMMA)
- ポリオキシメチレン(POM)
- スチレン共重合体(ABSとSAN)
- フッ素樹脂
第6章 競合情勢
- 主要な戦略動向
- 市場シェア分析
- 企業情勢
- 企業プロファイル
- AGC Inc.
- Asahi Kasei Corporation
- Daicel Corporation
- Daikin Industries, Ltd.
- Kuraray Co., Ltd.
- Kureha Corporation
- MCT PET Resin Co Ltd
- Mitsubishi Chemical Corporation
- PBI Advanced Materials Co.,Ltd.
- Polyplastics-Evonik Corporation
- Sumitomo Chemical Co., Ltd.
- Techno-UMG Co., Ltd.
- Teijin Limited
- Toray Industries, Inc.
- UBE Corporation
第7章 CEOへの主要戦略的質問
第8章 付録
- 世界概要
- 概要
- ファイブフォース分析フレームワーク(産業魅力度分析)
- 世界のバリューチェーン分析
- 市場力学(DROs)
- 情報源と参考文献
- 図表一覧
- 主要な洞察
- データパック
- 用語集
The Japan Engineering Plastics Market size is estimated at 5.72 billion USD in 2024, and is expected to reach 7.59 billion USD by 2029, growing at a CAGR of 5.80% during the forecast period (2024-2029).
The electrical and electronics industry to maintain its dominance in terms of both value and volume
- Engineering plastics have applications ranging from interior wall panels and doors in aerospace to rigid and flexible packaging. In Japan, the engineering plastics market is led by the packaging, electrical and electronics, and automotive industries. Packaging and electrical and electronics industries accounted for around 26.89% and 27.23% of the engineering plastics market volume in 2022.
- The electrical and electronics sector is the largest in the country. For instance, the Japanese electronics industry experienced a 2% Y-o-Y increase in domestic production in 2022, reaching a total of USD 84.34 billion. This growth was mainly attributed to the strong performance of electronic components and devices in exports, the rising usage of electronic components in vehicles, and the increasing demand for electric measuring instruments due to the growth of 5G technology. These factors led to higher consumption of engineering plastics in the country, with volume growth of 1.12% in 2022 compared to the previous year.
- In 2022, the automotive industry accounted for 25.65% of the revenue share, which made it the second largest promising industry in the country. In 2022, the Japanese automotive industry grew at a Y-o-Y rate of 15.15% compared to the previous year. This was mainly due to an increase in vehicle production in the country, which was recorded at 9.41 million units in 2022, 3.49% higher than the previous year.
- Aerospace is the fastest-growing industry in the country in terms of revenue, with a projected CAGR of 7.69%, owing to increased spending in the aerospace industry, which is expected to drive the demand for engineering plastics during the forecast period. Japan's aerospace component production revenue is expected to reach around USD 17 billion by 2029.
Japan Engineering Plastics Market Trends
Government policies to support domestic electrical and electronics production
- The Japanese electronics industry excels in the production of components and devices, creating key technologies, such as all-solid batteries and medical cameras. The government's efforts toward decarbonization and the industry's proficiency in this field will enable further innovations by developing functions geared toward factory automation and telework-led workstyle reforms.
- The country faced chip shortages caused by the trade war between the United States and China, and the increased demand that followed the move to remote working that affected the production of electronics in the country in 2019. Consecutively, due to COVID-19 pandemic-related disruptions in 2020, the number of businesses in the Japanese electronic parts, devices, and electronic circuits manufacturing industry hit a decade low of approximately 3.79 thousand establishments, a decrease from around 3.86 thousand in the previous year. The country produced consumer electronic equipment of JPY 42,908 million, by value, and industrial electronic equipment of JPY 25,5676 million, by value, in 2020.
- Japan registered an increase of 19.2% in electrical and electronics production revenue from 2020 to 2021. The total production value of the electronics industry in Japan reached close to JPY 11 trillion in 2021. The industry encompasses consumer electronic equipment, industrial electronic equipment, and electronic components and devices. Consumer electronics account for a third of Japan's economic output.
- The US President and Japanese Prime Minister pledged to bolster semiconductor manufacturing capacity, and the country is also investing in the innovation sector, which may boost the electronic industry in the country during the forecast period.
Japan Engineering Plastics Industry Overview
The Japan Engineering Plastics Market is moderately consolidated, with the top five companies occupying 63.27%. The major players in this market are Daicel Corporation, MCT PET Resin Co Ltd, Mitsubishi Chemical Corporation, Sumitomo Chemical Co., Ltd. and Techno-UMG Co., Ltd. (sorted alphabetically).
Additional Benefits:
- The market estimate (ME) sheet in Excel format
- 3 months of analyst support
TABLE OF CONTENTS
1 EXECUTIVE SUMMARY & KEY FINDINGS
2 REPORT OFFERS
3 INTRODUCTION
- 3.1 Study Assumptions & Market Definition
- 3.2 Scope of the Study
- 3.3 Research Methodology
4 KEY INDUSTRY TRENDS
- 4.1 End User Trends
- 4.1.1 Aerospace
- 4.1.2 Automotive
- 4.1.3 Building and Construction
- 4.1.4 Electrical and Electronics
- 4.1.5 Packaging
- 4.2 Import And Export Trends
- 4.3 Price Trends
- 4.4 Recycling Overview
- 4.4.1 Polyamide (PA) Recycling Trends
- 4.4.2 Polycarbonate (PC) Recycling Trends
- 4.4.3 Polyethylene Terephthalate (PET) Recycling Trends
- 4.4.4 Styrene Copolymers (ABS and SAN) Recycling Trends
- 4.5 Regulatory Framework
- 4.5.1 Japan
- 4.6 Value Chain & Distribution Channel Analysis
5 MARKET SEGMENTATION (includes market size in Value in USD and Volume, Forecasts up to 2029 and analysis of growth prospects)
- 5.1 End User Industry
- 5.1.1 Aerospace
- 5.1.2 Automotive
- 5.1.3 Building and Construction
- 5.1.4 Electrical and Electronics
- 5.1.5 Industrial and Machinery
- 5.1.6 Packaging
- 5.1.7 Other End-user Industries
- 5.2 Resin Type
- 5.2.1 Fluoropolymer
- 5.2.1.1 By Sub Resin Type
- 5.2.1.1.1 Ethylenetetrafluoroethylene (ETFE)
- 5.2.1.1.2 Fluorinated Ethylene-propylene (FEP)
- 5.2.1.1.3 Polytetrafluoroethylene (PTFE)
- 5.2.1.1.4 Polyvinylfluoride (PVF)
- 5.2.1.1.5 Polyvinylidene Fluoride (PVDF)
- 5.2.1.1.6 Other Sub Resin Types
- 5.2.2 Liquid Crystal Polymer (LCP)
- 5.2.3 Polyamide (PA)
- 5.2.3.1 By Sub Resin Type
- 5.2.3.1.1 Aramid
- 5.2.3.1.2 Polyamide (PA) 6
- 5.2.3.1.3 Polyamide (PA) 66
- 5.2.3.1.4 Polyphthalamide
- 5.2.4 Polybutylene Terephthalate (PBT)
- 5.2.5 Polycarbonate (PC)
- 5.2.6 Polyether Ether Ketone (PEEK)
- 5.2.7 Polyethylene Terephthalate (PET)
- 5.2.8 Polyimide (PI)
- 5.2.9 Polymethyl Methacrylate (PMMA)
- 5.2.10 Polyoxymethylene (POM)
- 5.2.11 Styrene Copolymers (ABS and SAN)
- 5.2.1 Fluoropolymer
6 COMPETITIVE LANDSCAPE
- 6.1 Key Strategic Moves
- 6.2 Market Share Analysis
- 6.3 Company Landscape
- 6.4 Company Profiles (includes Global Level Overview, Market Level Overview, Core Business Segments, Financials, Headcount, Key Information, Market Rank, Market Share, Products and Services, and Analysis of Recent Developments).
- 6.4.1 AGC Inc.
- 6.4.2 Asahi Kasei Corporation
- 6.4.3 Daicel Corporation
- 6.4.4 Daikin Industries, Ltd.
- 6.4.5 Kuraray Co., Ltd.
- 6.4.6 Kureha Corporation
- 6.4.7 MCT PET Resin Co Ltd
- 6.4.8 Mitsubishi Chemical Corporation
- 6.4.9 PBI Advanced Materials Co.,Ltd.
- 6.4.10 Polyplastics-Evonik Corporation
- 6.4.11 Sumitomo Chemical Co., Ltd.
- 6.4.12 Techno-UMG Co., Ltd.
- 6.4.13 Teijin Limited
- 6.4.14 Toray Industries, Inc.
- 6.4.15 UBE Corporation
7 KEY STRATEGIC QUESTIONS FOR ENGINEERING PLASTICS CEOS
8 APPENDIX
- 8.1 Global Overview
- 8.1.1 Overview
- 8.1.2 Porter's Five Forces Framework (Industry Attractiveness Analysis)
- 8.1.3 Global Value Chain Analysis
- 8.1.4 Market Dynamics (DROs)
- 8.2 Sources & References
- 8.3 List of Tables & Figures
- 8.4 Primary Insights
- 8.5 Data Pack
- 8.6 Glossary of Terms

