|
|
市場調査レポート
商品コード
1910901
日本のデータセンター市場- シェア分析、業界動向、統計、成長予測(2026年~2031年)Japan Data Center - Market Share Analysis, Industry Trends & Statistics, Growth Forecasts (2026 - 2031) |
||||||
|
|||||||
カスタマイズ可能
適宜更新あり
|
|||||||

| 日本のデータセンター市場- シェア分析、業界動向、統計、成長予測(2026年~2031年) |
|
出版日: 2026年01月12日
発行: Mordor Intelligence
ページ情報: 英文 134 Pages
納期: 2~3営業日
|

概要
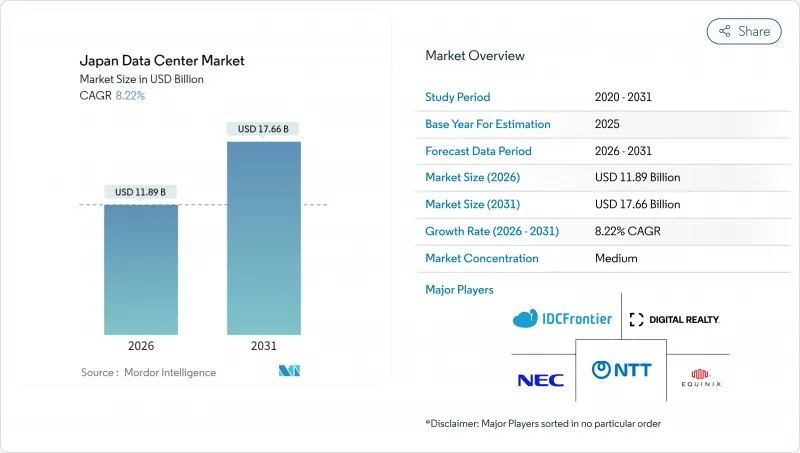
日本のデータセンター市場は、2025年の109億9,000万米ドルから2026年には118億9,000万米ドルへ成長し、2026年から2031年にかけてCAGR8.22%で推移し、2031年までに176億6,000万米ドルに達すると予測されております。
IT負荷容量の観点では、市場は2025年の3,340メガワットから2030年までに6,460メガワットへ成長し、予測期間(2025-2030年)におけるCAGRは14.12%と予測されています。市場セグメンテーションのシェアおよび推定値はMW単位で算出・報告されています。公共部門のクラウド導入義務化、ハイパースケール資本支出、人工知能ワークロードの急増を背景に、クラスターは既にアジア太平洋地域で最大規模であり、地域における主導的地位を確固たるものにする見込みです。国内事業者はソブリンクラウドを優先する政策の恩恵を受ける一方、世界のクラウドプロバイダーはデータ居住規則を満たすため容量の現地化を進めています。持続的な5G展開とモノのインターネット(IoT)導入の進展により、エッジコンピューティングの需要が高まっており、人口密集地や製造拠点に近い中規模デプロイメントが促進されています。同時に、土地不足、電力料金、耐震設計コストの高騰により、開発事業者は施設敷地の最適化、冷却技術の革新、郊外回廊への分散化を進め、日本データセンター市場の成長勢いを維持せざるを得ません。
日本データセンター市場の動向と洞察
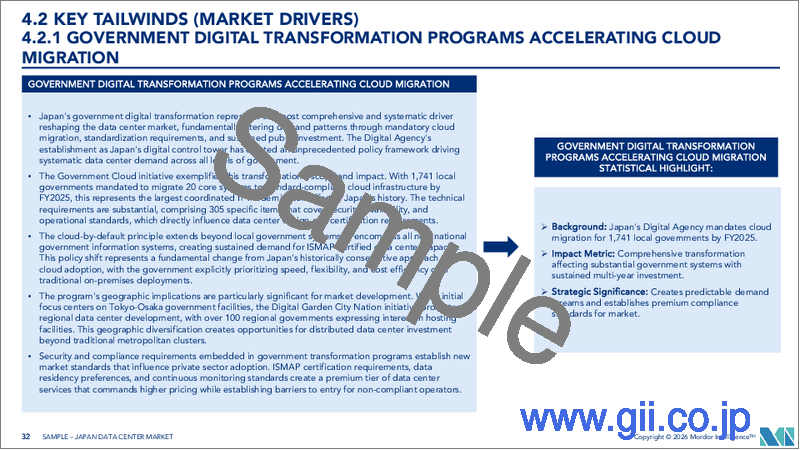
政府のデジタル変革プログラムがクラウド移行を加速
デジタル庁は2025年までに中央政府の業務負荷をクラウドプラットフォームへ完全移行する目標を掲げており、データ主権維持のため国内に新設される容量の基幹テナントとなる見込みです。アマゾンウェブサービス(AWS)は、この需要急増に対応するため、2027年までに東京と大阪の施設拡張に2兆2,600億円(152億4,000万米ドル)を投じる計画です。地方自治体や国有企業における同様の近代化の流れは、地方自治体への需要拡大につながり、新規建設プロジェクトの早期予約率達成を確実なものとしています。国内プロバイダーは公共調達において優先的に選定される一方、世界のハイパースケーラーは調達規則を満たすため合弁事業戦略を加速させています。その結果、政府ワークロードの安定した供給パイプラインが形成され、日本データセンター市場における複数年にわたる稼働率の見通しが支えられています。
AIおよびOTTトラフィック増加に対応するハイパースケール投資の急増
人工知能モデルのトレーニングによりラックあたりの電力密度が30kWを超え、マイクロソフトは日本の顧客向けにGPUを豊富に備えたキャンパスに29億米ドルを投資することを表明しました。グーグルの10億米ドル規模の「プロア」及び「タイヘイ」海底ケーブルは太平洋横断の通信容量を強化し、東京と大阪を主要な集約拠点として位置づけております。国内の有力企業であるソフトバンクはNVIDIAと提携し、AI最適化ホールを構築。高密度コンピューティングが戦略的資産となったことを裏付けております。これらの取り組みは需給サイクルの短縮、許可取得期間の圧縮、限られたメガワット割当を巡る競合激化をもたらし、いずれも日本データセンター市場の拡大に追い風となっております。
主要ホットスポットにおける土地の希少性と高コスト
2024年、東京都心部の平均地価は69%上昇し、施設開発予算を膨らませるとともに内部収益率を圧迫しています。江東区における地域住民の反対は、社会的受容性の障壁を浮き彫りにしており、事業者はより広大な土地が存在し、自治体の優遇措置によりプロジェクト経済性が向上する印西市などの郊外地域への進出を余儀なくされています。移転は土地コストを軽減する一方、ダークファイバー回線の敷設や冗長化された変電所への並行投資を必要とし、プロジェクトの工期を延長させ、日本データセンター市場の短期的な供給を抑制する要因となっています。
セグメント分析
5MWから20MWの中規模ホールは、2031年までにCAGR12.02%で拡大し、日本データセンター市場全体を上回る見込みです。この規模は冷却やセキュリティ面で規模の経済を実現しつつ、メガキャンパスが直面する土地・電力制約を回避する立地柔軟性を維持します。大規模サイトは38.10%のシェアを維持しています。Amazon Web Servicesなどのハイパースケーラーが100MWを超えるクラスター向けに連続した土地を確保しているためです。しかしながら、こうしたプロジェクトに伴う規制や地域社会の障壁が開発期間を長期化させ、中規模建設に市場投入のスピード面で優位性をもたらしています。経済産業省が支援する福島AI施設は、地域間で複製可能な分散型15MWブロックに対する政策支援を示しています。
開発事業者は、段階的な電力供給開始を可能にするモジュール設計を好みます。これにより、契約獲得に合わせて資本投入を調整しつつ、遊休容量を抑制できるからです。レガシー設備の移行を検討する企業にとって、中規模施設は複数のオンプレミス拠点を一箇所に集約するのに理想的です。さらに、5GやIoTを支えるエッジコンピューティングノードは、この規模帯で拡張されることが多く、稼働率の回復力を高めます。その結果、ハイパースケール複合施設が注目を集める中でも、中規模ホールは将来の日本データセンター市場規模拡大の主力となることが予想されます。
2025年時点で、ティア3施設は日本のデータセンター市場規模の66.05%を占め、15.28%のCAGRで拡大しています。99.982%の稼働率評価は、ティア4のような二重ユーティリティ供給や同時保守冗長性を必要とせず、ほとんどの監査基準や災害復旧要件を満たします。事業者様は免震支承・ダンパー・補強フレームを統合し、これらの施設がマグニチュード7の地震に耐えつつサービスレベルを維持する設計を採用。リスクとコストのバランスを重視したアプローチです。Tier 1およびTier 2の施設は、特に電力予算が厳しい地方拠点において、開発テスト環境や非重要ストレージ使用事例に活用されます。Tier 4は設備投資の多さから、低遅延が要求される取引プラットフォームや通信キャリアの中核交換拠点に限定されています。
標準化によりティア3の開発が加速しています。プレハブの電気・機械スキッドにより現場作業が削減され、建設スケジュールが24ヶ月から18ヶ月に短縮されました。このモデルでは、事前承認済みの耐震・省エネ計算テンプレートが利用可能なため、規制当局への申請も簡素化されます。したがって、ティア3は優位性をさらに拡大し、日本データセンター市場のアーキテクチャ的進化を牽引していく見込みです。
日本データセンター市場レポートは、データセンター規模(大規模、超大規模、中規模、メガ、小規模)、ティアタイプ(ティア1・2、ティア3、ティア4)、データセンタータイプ(ハイパースケール/自社建設、企業/エッジ、コロケーション)、エンドユーザー(BFSI、ITおよびITES、Eコマース、政府、製造、メディア・エンターテインメント、通信など)、ホットスポット別に分類されています。市場予測はIT負荷容量(MW)単位で提供されます。
その他の特典:
- エクセル形式の市場予測(ME)シート
- アナリストによる3ヶ月間のサポート
よくあるご質問
目次
第1章 イントロダクション
- 調査範囲
第2章 調査手法
第3章 エグゼクティブサマリー
第4章 市場情勢
- 市場促進要因
- 政府のデジタル変革プログラムがクラウド移行を加速
- AIおよびOTTトラフィックの成長に対応するためのハイパースケール投資の急増
- 5G対応IoTの普及がエッジデプロイメントを推進
- データローカリゼーション規則は国内容量の増強を促進します
- 老朽化した企業サイトの廃止がコロケーション需要を促進
- 大阪及び東京における都市廃棄熱再利用の奨励策
- 市場抑制要因
- 主要ホットスポットにおける土地の不足と高コスト
- 地域他社と比較した電気料金の高騰
- 地震および災害耐性コストプレミアム
- 送電網接続承認までの長いリードタイム
- 市場見通し
- IT負荷容量
- 高床式フロア面積
- コロケーション収益
- 設置済みラック
- ラックスペース利用率
- 海底ケーブル
- 主要な業界動向
- スマートフォン利用者数
- スマートフォン1台あたりのデータトラフィック
- モバイルデータ通信速度
- ブロードバンドデータ速度
- 光ファイバー接続ネットワーク
- 規制の枠組み
- バリューチェーンと流通チャネル分析
- ポーターのファイブフォース分析
- 新規参入業者の脅威
- 買い手の交渉力
- 供給企業の交渉力
- 代替品の脅威
- 競争企業間の敵対関係
第5章 市場規模と成長予測
- データセンター規模別
- 大規模
- 巨大
- 中規模
- メガ
- 小規模
- ティアタイプ別
- ティア1および2
- ティア3
- ティア4
- データセンタータイプ別
- ハイパースケール/自社建設
- エンタープライズ/エッジ
- コロケーション
- 未利用
- 稼働中
- リテールコロケーション
- ホールセールコロケーション
- エンドユーザー別
- BFSI
- IT・ITES
- 電子商取引
- 政府機関
- 製造業
- メディア・エンターテイメント
- 通信
- その他のエンドユーザー
- ホットスポット別
- 大阪市
- 高松
- 東京
- その他の地域
第6章 競合情勢
- 市場集中度
- 戦略的動向
- 市場シェア分析
- 企業プロファイル
- Equinix Inc.
- MC Digital Realty(Digital Realty Trust Inc. and Mitsubishi Corporation JV)
- AT TOKYO Corporation
- Amazon Web Services Inc.
- NTT Global Data Centers(NTT Ltd.)
- netXDC(SCSK Corporation)
- IDC Frontier Inc.(Yahoo Japan subsidiary)
- AirTrunk Operating Pty Ltd.
- NEC Corporation
- IBM Japan Ltd.
- Colt Data Centre Services Holdings Ltd.
- Alibaba Cloud(Alibaba Group Holding Ltd.)
- Microsoft Corporation
- Telehouse(KDDI Corporation)
- Additional regional and niche operators
