
|
市場調査レポート
商品コード
1439804
柿:市場シェア分析、業界動向と統計、成長予測(2024-2029)Persimmons - Market Share Analysis, Industry Trends & Statistics, Growth Forecasts (2024 - 2029) |
||||||
カスタマイズ可能
適宜更新あり
|
|||||||
| 柿:市場シェア分析、業界動向と統計、成長予測(2024-2029) |
|
出版日: 2024年02月15日
発行: Mordor Intelligence
ページ情報: 英文 120 Pages
納期: 2~3営業日
|

全表示
- 概要
- 目次
概要
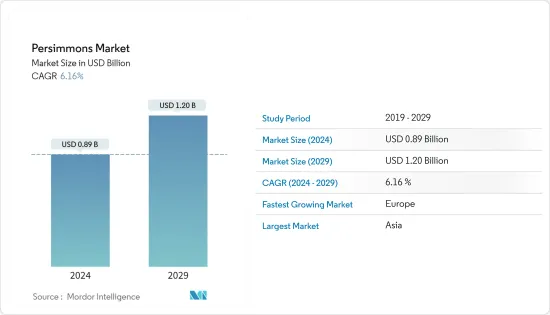
柿市場規模は2024年に8億9,000万米ドルと推定され、2029年までに12億米ドルに達すると予測されており、予測期間(2024年から2029年)中に6.16%のCAGRで成長します。
主なハイライト
- 柿果実の栄養価の高さと輸出額の高さによる需要の増加が市場の主な推進力となっています。柿にはビタミンA、C、Kが含まれており、インスリン反応性を高め、酸化ストレスを軽減する抗酸化作用があります。柿は、焼き菓子(クッキー、ケーキなど)、カスタード、アイスクリーム、ジャム、プリン、果肉など、さまざまな製品の製造に使用できます。
- 柿の葉はハーブティーにも使われます。この果物は減量に役立ち、免疫力を高めます。干し柿も作物に付加価値を与える加工技術です。したがって、干し柿をさまざまな用途に利用することは、市場に大きな成長機会をもたらします。
- 食糧農業機関(FAO)によると、世界中で中国、韓国、アゼルバイジャン、日本、ブラジルが柿の主要生産国であり、2021年にはそれぞれ342万9,400トン、次いで20万600トン、19万2,400トン、18万7,900トン、17万200メートルトンを生産しています。
- 中国は世界の生産シェアの半分以上を占める有数の柿生産国です。日本の品種は中国で最もよく収穫される柿です。世界第2位の柿生産国は韓国です。これらの国の農業業界は、柿の輸出を大幅に増やす戦略の一環として、柿の生産向上に積極的に取り組んでいます。
柿市場動向
高い輸出額が市場を牽引
- 2021年の柿果実の輸出額は6億2,010万米ドルと、2018年比12.7%増加しました。抗酸化作用や抗糖尿病作用などの生物生理学的機能は、輸出市場を牽引する主要な要因の1つです。
- スペイン、アゼルバイジャン、ウズベキスタンは柿果実の主要輸出国です。このような輸出の主な理由は、輸入国での柿の価格が高いことと、生産が少数の国で行われていることです。柿果実の需要は、ドイツ、米国など、生産がない、または生産量が少ない多くの国で高いです。これらの国は、生産量が非常に多い中国などの国から輸入しています。驚くべきことに、中国の主要な輸出国はまた、主要な輸入国の一つでもあります。
- グルジア財務省によると、同国は300万米ドル相当の5,800トンの柿を輸出しました。ジョージア柿の主な輸出先はロシア、ウクライナ、アルメニアで、2021年10月には輸出柿の97%を占めました。同時に、輸出市場の価格には大きな差があります。ロシア市場での柿の価格は、ジョージアの柿の平均輸出価格(1トン当たり510ドル)より41%高いです。
アジア太平洋が市場を独占
- アジア太平洋は柿の最大の生産国です。中国と日本が主要生産国で、2021年の生産量はそれぞれ340万トンと18万トンで、世界生産量のほぼ75%を占めています。欧州はアジアに次いで市場シェア 11.5%で第2位となっています。園芸作物の生産と供給のダイナミックな発展と柿生産の持続的な成長は、将来的に良い傾向を示すと推定されています。
- これらの国々で柿が生産される主な理由は、柿の原産地が中国であること、好ましい気候、そして多くの品種が入手できることです。中国の柿生産量は増加を続け、総作付面積は安定的に維持されており、干し柿が輸出の主力製品タイプとなっています。
- 育種技術の向上により、中国の新しいPCNA品種の開発が促進されました。インターネットマーケティング、果実の品質評価、果実の鮮度を保つための収穫後処理などを通じた柿製品の革新的な取引モデルが、中国の柿市場を牽引する要因となっています。
柿産業の概要
その他の特典
- エクセル形式の市場予測(ME)シート
- 3か月のアナリストサポート
目次
第1章 イントロダクション
- 調査の前提条件と市場の定義
- 調査範囲
第2章 調査手法
第3章 エグゼクティブサマリー
第4章 市場力学
- 市場概要
- 市場促進要因
- 市場抑制要因
- バリューチェーン分析
第5章 市場セグメンテーション
- 地域
- 北米
- 米国
- 生産分析
- 消費分析と市場価値
- 輸入市場分析(数量と金額)
- 輸出市場分析(数量と金額)
- 価格動向分析
- カナダ
- 生産分析
- 消費分析と市場価値
- 輸入市場分析(数量と金額)
- 輸出市場分析(数量と金額)
- 価格動向分析
- メキシコ
- 生産分析
- 消費分析と市場価値
- 輸入市場分析(数量と金額)
- 輸出市場分析(数量と金額)
- 価格動向分析
- 欧州
- スペイン
- 生産分析
- 消費分析と市場価値
- 輸入市場分析(数量と金額)
- 輸出市場分析(数量と金額)
- 価格動向分析
- イタリア
- 生産分析
- 消費分析と市場価値
- 輸入市場分析(数量と金額)
- 輸出市場分析(数量と金額)
- 価格動向分析
- アジア太平洋
- 中国
- 生産分析
- 消費分析と市場価値
- 輸入市場分析(数量と金額)
- 輸出市場分析(数量と金額)
- 価格動向分析
- 日本
- 生産分析
- 消費分析と市場価値
- 輸入市場分析(数量と金額)
- 輸出市場分析(数量と金額)
- 価格動向分析
- 韓国
- 生産分析
- 消費分析と市場価値
- 輸入市場分析(数量と金額)
- 輸出市場分析(数量と金額)
- 価格動向分析
- 南米
- ブラジル
- 生産分析
- 消費分析と市場価値
- 輸入市場分析(数量と金額)
- 輸出市場分析(数量と金額)
- 価格動向分析
- チリ
- 生産分析
- 消費分析と市場価値
- 輸入市場分析(数量と金額)
- 輸出市場分析(数量と金額)
- 価格動向分析
- 中東とアフリカ
- イスラエル
- 生産分析
- 消費分析と市場価値
- 輸入市場分析(数量と金額)
- 輸出市場分析(数量と金額)
- 価格動向分析
- イラン
- 生産分析
- 消費分析と市場価値
- 輸入市場分析(数量と金額)
- 輸出市場分析(数量と金額)
- 価格動向分析
- 北米
第6章 市場機会と将来の動向
目次
Product Code: 68537
The Persimmons Market size is estimated at USD 0.89 billion in 2024, and is expected to reach USD 1.20 billion by 2029, growing at a CAGR of 6.16% during the forecast period (2024-2029).
Key Highlights
- The rise in demand due to the nutritive value of persimmons fruits and their high export value are the prime drivers of the market. Persimmons contain Vitamins A, C, K, and antioxidant properties that help increase insulin responsiveness and reduce oxidative stress. Persimmons can be used to make a variety of items, including baked foods (cookies, cakes, etc.), custards, ice creams, preserves, puddings, and pulp.
- Persimmon leaves are used to make herbal teas as well. This fruit helps in weight loss and increases immunity. Dried persimmons are another processing technique that can add value to the crop. Therefore, the utilization of dried persimmons in various applications provides lucrative growth opportunities to the market.
- According to the Food and Agriculture Organization (FAO), China, South Korea, Azerbaijan, Japan, and Brazil are the major producer of persimmon across the globe contributing 3,429.4 thousand metric tons, followed by 200.6 thousand metric tons, 192.4 thousand metric tons, 187.9 thousand metric tons, and 170.2 thousand metric tons, respectively, during the year 2021.
- China is the leading persimmons-producing country with more than half of the world's production share. The Japanese variety is the most commonly harvested persimmon in China. The second leading persimmon producer in the world is South Korea. The agricultural industry in these countries is actively trying to improve persimmon production as part of a strategy to significantly increase persimmon exports.
Persimmon Market Trends
High Export Value Drives the Market
- The export value of persimmons fruits was valued at USD 620.1 million in 2021, an increase of 12.7% from 2018. The potential use of persimmon surpluses and by-products in the development of new food products due to its high nutritional and bioactive compound content with bio-physiological functions such as antioxidant and antidiabetic properties is one of the major factors driving the export market.
- Spain, Azerbaijan, and Uzbekistan are the leading exporters of persimmons fruit. The main reason for such exports is the high prices of persimmons in the importing countries and production in a few countries. The demand for persimmons fruits is high in many countries with no or less production, such as Germany, the United States, etc. These countries import from countries like China, where the output is very high. Surprisingly, China's leading exporter is also one of the leading importers.
- According to the Georgian Ministry of Finance, the country exported 5,800 tons of persimmons worth USD 3 million. The main export destinations of Georgian persimmons are Russia, Ukraine, and Armenia - they accounted for 97% of exported persimmons in October 2021. At the same time, there is a significant difference in prices in export markets. The price of persimmons on the Russian market is 41% higher than the average export price of Georgian persimmons, which is USD 510 per ton.
Asia-Pacific Dominates the Market
- Asia-Pacific is the leading producer of persimmon fruit. China and Japan are the leading producers, with a production quantity of 3.4 million metric tons and 0.18 million metric tons, respectively, in 2021, almost 75% of the world's production. Europe stands second with 11.5% of the market share after Asia. The dynamic developments in the production and supply of horticultural products and sustainable growth in the production of persimmon are estimated to show a positive trend in the future.
- Chinese origin of the persimmon, favorable climate, and availability of many cultivars are the main reasons for their production in these countries. Chinese persimmon production keeps increasing while total acreage is maintained stable, and dried persimmon becomes the main product type for exporting.
- The improvement of breeding techniques fastened the achievement of new Chinese PCNA cultivars. Innovative trade models of persimmon products through Internet marketing, fruit quality evaluation, and post-harvest treatments for keeping the fruit fresh are some factors driving the persimmon market in China.
Persimmon Industry Overview
Additional Benefits:
- The market estimate (ME) sheet in Excel format
- 3 months of analyst support
TABLE OF CONTENTS
1 INTRODUCTION
- 1.1 Study Assumptions and Market Definition
- 1.2 Scope of the Study
2 RESEARCH METHODOLOGY
3 EXECUTIVE SUMMARY
4 MARKET DYNAMICS
- 4.1 Market Overview
- 4.2 Market Drivers
- 4.3 Market Restraints
- 4.4 Value Chain Analysis
5 MARKET SEGMENTATION
- 5.1 Geography
- 5.1.1 North America
- 5.1.1.1 United States
- 5.1.1.1.1 Production Analysis
- 5.1.1.1.2 Consumption Analysis and Market Value
- 5.1.1.1.3 Import Market Analysis (Volume and Value)
- 5.1.1.1.4 Export Market Analysis (Volume and Value)
- 5.1.1.1.5 Price Trend Analysis
- 5.1.1.2 Canada
- 5.1.1.2.1 Production Analysis
- 5.1.1.2.2 Consumption Analysis and Market Value
- 5.1.1.2.3 Import Market Analysis (Volume and Value)
- 5.1.1.2.4 Export Market Analysis (Volume and Value)
- 5.1.1.2.5 Price Trend Analysis
- 5.1.1.3 Mexico
- 5.1.1.3.1 Production Analysis
- 5.1.1.3.2 Consumption Analysis and Market Value
- 5.1.1.3.3 Import Market Analysis (Volume and Value)
- 5.1.1.3.4 Export Market Analysis (Volume and Value)
- 5.1.1.3.5 Price Trend Analysis
- 5.1.2 Europe
- 5.1.2.1 Spain
- 5.1.2.1.1 Production Analysis
- 5.1.2.1.2 Consumption Analysis and Market Value
- 5.1.2.1.3 Import Market Analysis (Volume and Value)
- 5.1.2.1.4 Export Market Analysis (Volume and Value)
- 5.1.2.1.5 Price Trend Analysis
- 5.1.2.2 Italy
- 5.1.2.2.1 Production Analysis
- 5.1.2.2.2 Consumption Analysis and Market Value
- 5.1.2.2.3 Import Market Analysis (Volume and Value)
- 5.1.2.2.4 Export Market Analysis (Volume and Value)
- 5.1.2.2.5 Price Trend Analysis
- 5.1.3 Asia-Pacific
- 5.1.3.1 China
- 5.1.3.1.1 Production Analysis
- 5.1.3.1.2 Consumption Analysis and Market Value
- 5.1.3.1.3 Import Market Analysis (Volume and Value)
- 5.1.3.1.4 Export Market Analysis (Volume and Value)
- 5.1.3.1.5 Price Trend Analysis
- 5.1.3.2 Japan
- 5.1.3.2.1 Production Analysis
- 5.1.3.2.2 Consumption Analysis and Market Value
- 5.1.3.2.3 Import Market Analysis (Volume and Value)
- 5.1.3.2.4 Export Market Analysis (Volume and Value)
- 5.1.3.2.5 Price Trend Analysis
- 5.1.3.3 South Korea
- 5.1.3.3.1 Production Analysis
- 5.1.3.3.2 Consumption Analysis and Market Value
- 5.1.3.3.3 Import Market Analysis (Volume and Value)
- 5.1.3.3.4 Export Market Analysis (Volume and Value)
- 5.1.3.3.5 Price Trend Analysis
- 5.1.4 South America
- 5.1.4.1 Brazil
- 5.1.4.1.1 Production Analysis
- 5.1.4.1.2 Consumption Analysis and Market Value
- 5.1.4.1.3 Import Market Analysis (Volume and Value)
- 5.1.4.1.4 Export Market Analysis (Volume and Value)
- 5.1.4.1.5 Price Trend Analysis
- 5.1.4.2 Chile
- 5.1.4.2.1 Production Analysis
- 5.1.4.2.2 Consumption Analysis and Market Value
- 5.1.4.2.3 Import Market Analysis (Volume and Value)
- 5.1.4.2.4 Export Market Analysis (Volume and Value)
- 5.1.4.2.5 Price Trend Analysis
- 5.1.5 Middle-East and Africa
- 5.1.5.1 Israel
- 5.1.5.1.1 Production Analysis
- 5.1.5.1.2 Consumption Analysis and Market Value
- 5.1.5.1.3 Import Market Analysis (Volume and Value)
- 5.1.5.1.4 Export Market Analysis (Volume and Value)
- 5.1.5.1.5 Price Trend Analysis
- 5.1.5.2 Iran
- 5.1.5.2.1 Production Analysis
- 5.1.5.2.2 Consumption Analysis and Market Value
- 5.1.5.2.3 Import Market Analysis (Volume and Value)
- 5.1.5.2.4 Export Market Analysis (Volume and Value)
- 5.1.5.2.5 Price Trend Analysis
- 5.1.1 North America

