 |
市場調査レポート
商品コード
1273338
生鮮梨市場- 成長、動向、予測(2023年-2028年)Fresh Pears Market - Growth, Trends, and Forecasts (2023 - 2028) |
||||||
● お客様のご希望に応じて、既存データの加工や未掲載情報(例:国別セグメント)の追加などの対応が可能です。 詳細はお問い合わせください。

| 生鮮梨市場- 成長、動向、予測(2023年-2028年) |
|
出版日: 2023年04月14日
発行: Mordor Intelligence
ページ情報: 英文 120 Pages
納期: 2~3営業日
|
- 全表示
- 概要
- 目次
生鮮梨市場は予測期間中に4.7%のCAGRで推移すると予測されます。
主なハイライト
- 梨には、抗炎症フラボノイド、抗がんポリフェノール、アンチエイジングフラボノイドなど、特別な植物栄養素が含まれています。梨は、ビタミンC、ビタミンK、ホウ素の最良の供給源の1つです。ほとんどの病気の根本的な原因である炎症を低下させることができます。このように、この果物の利点は、米国を中心に消費されるようになりました。健康志向の高まりと有機果実への需要の高まりが、生鮮梨市場の成長を支える大きな原動力となっています。
- 日本政府は、人口減少に伴い国内消費が減少することから、2030年までに農業の年間輸出量を拡大することを目指しており、特に梨業界は様々な市場への輸出を考えています。
- 食習慣に特化した高級志向の消費者をターゲットに、スーパーマーケットや健康食品店などで高い売れ行きを示しています。FAOSTATによると、昨年の世界の梨の生産量は2,560万トンで、収穫面積は130万ヘクタールでした。アジアは最大の洋梨生産地域で、昨年の生産量は2,080万メートルトンでした。
生鮮梨の市場動向
米国における生鮮梨の生産量と一人当たりの消費量の増加
梨は、1個あたりわずか100カロリーで、食物繊維とビタミンCの優れた供給源です。また、ナトリウム、コレステロール、脂肪を含まず、190mgのカリウムを含んでいます。米国農務省の食事ガイドラインでは、アメリカの梨はいくつかの慢性疾患のリスクを軽減し、これは国内の梨の生産と消費のための高い需要を作り、これは今後数年間で市場を強化することになります。
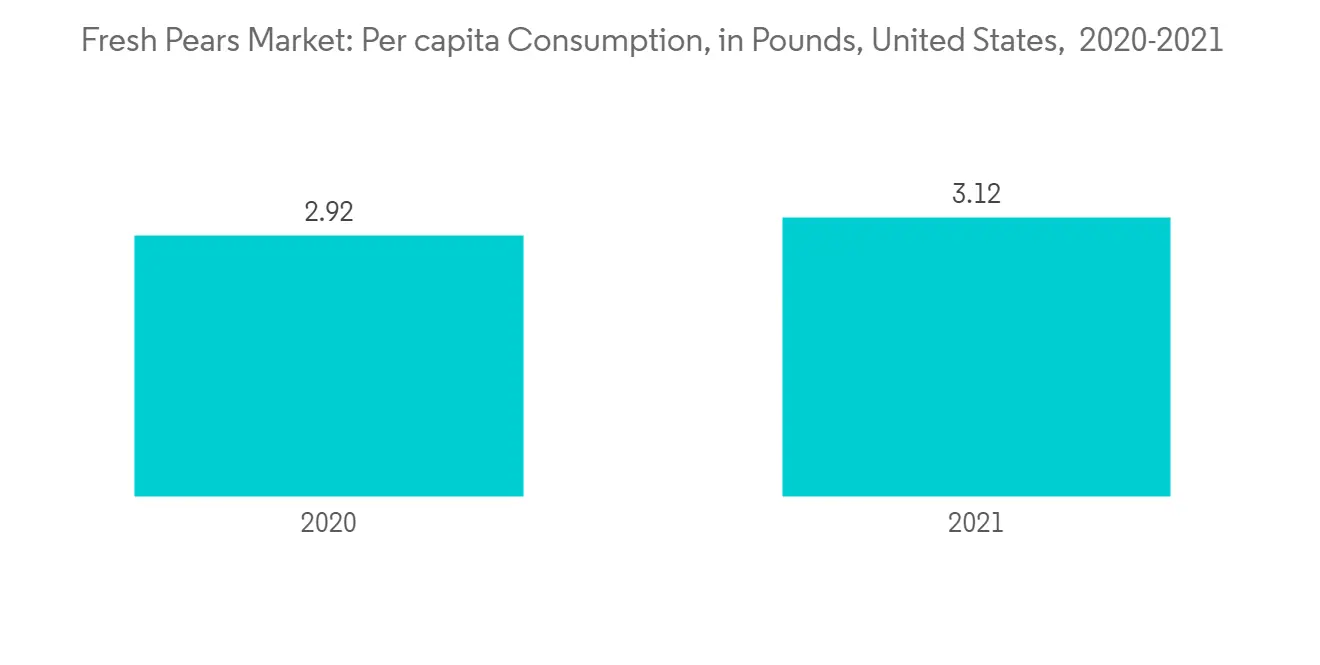
FAOSTATによると、2021年、米国の総梨生産量は6億3,639万トンで、収穫面積は16,876ヘクタールです。米国における一人当たりの生鮮梨消費量は、2020年から2021年にかけて2.92ポンドから3.12ポンドに増加しました。
梨は主に米国のワシントン州とオレゴン州で生産されています。ワシントンの生鮮梨生産量は米国最大で、同国の梨生産量の半分を占めています。オレゴン州とワシントン州は、米国の梨生産の25%を占めています。北西部の梨は、ワシントン州のヤキマとウェナッチー地区、オレゴン州のローグ・リバー・バレーとフッド・リバー地区で主に生産されています。
しかし、十分な労働力を確保することは大きな問題であり、労働力に関連するコストも高いです。そのため、GPSやバリアブルレート技術など、近代的な農業技術を活用して肥料や水を散布し、生産を維持する経済が、予測期間中に市場を押し上げると考えられます。
中国は主要な輸出国であり生産国でもある
中国は世界最大の梨の生産国であり、輸出国でもあります。気温が徐々に上昇し、中国の梨は販売のピークを迎え、国内では清明節の仕入れ、海外ではイスラム圏のイード・アル・フィトルの仕入れの影響を受け、両市場の需要が高まり、生鮮梨の価格が10%程度若干上昇しました。特に生鮮食品eコマースの急速な発展により、消費者はプラットフォーム上で簡単にクリックするだけで、さまざまな中国の生鮮梨を購入することができるようになりました。
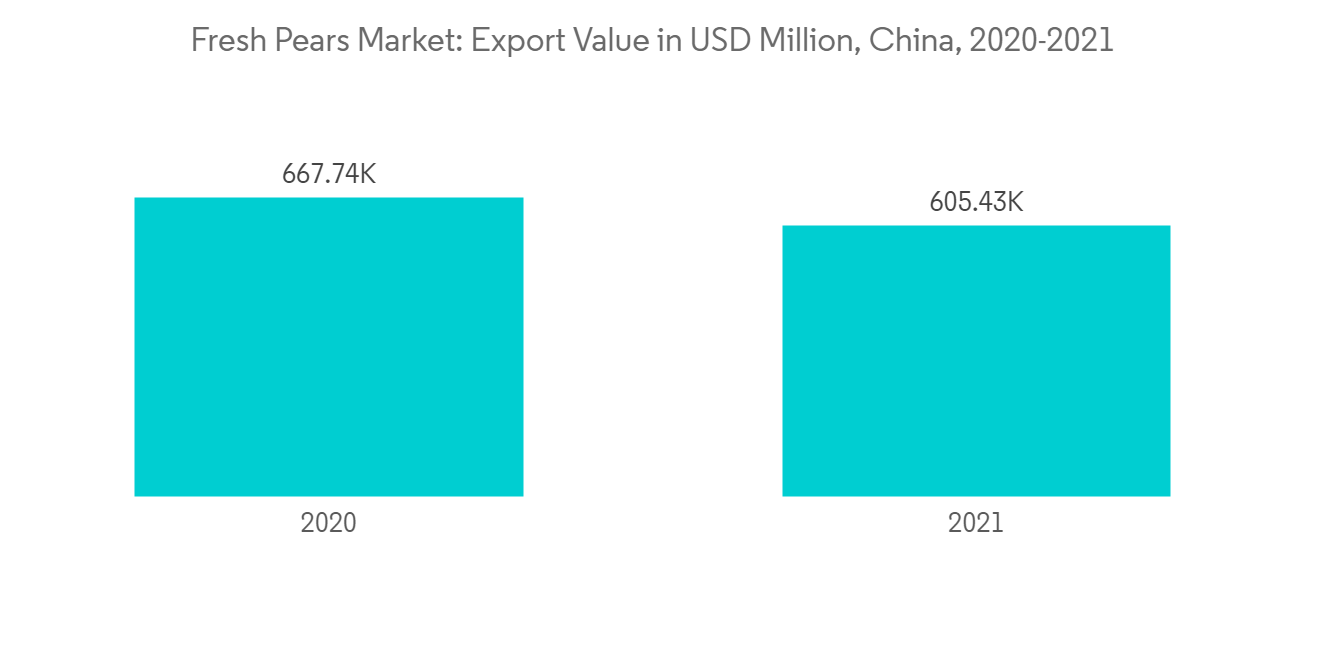
FAOSTATによると、2021年、中国の生鮮梨の生産量は1,890万トン、輸出量は510,138トン、60万5,400米ドル相当です。中国では、世界のパンデミックの影響により、2021年の輸出額は前年と比較して若干減少しています。米国農務省外国農業局(FAS)によると、中国の生産量は前年比2%近く増加すると予想されています。干ばつにより中国東部の省では梨の収穫量が減少したもの、他の地域では豊作であるため、総生産量は増加すると予想されます。
2020年の一人当たりの梨消費量が最も多い国は、アルゼンチン、イタリア、米国、中国です。このように、世界的に梨の需要が高まっていることから、今後も消費量の増加が見込まれ、市場は拡大する傾向にあります。
生鮮洋梨の産業概要
その他の特典:
- エクセル形式の市場予測(ME)シート
- 3ヶ月間のアナリストサポート
目次
第1章 イントロダクション
- 調査の前提条件と市場の定義
- 本調査の対象範囲
第2章 調査手法
第3章 エグゼクティブサマリー
第4章 市場力学
- 市場概要
- 市場促進要因
- 市場抑制要因
- サプライチェーン/バリューチェーン分析
第5章 市場セグメンテーション
- 地域
- 北米
- 米国
- 生産分析
- 消費市場の分析(数量と金額)
- 輸入市場の分析(数量と金額)
- 輸出市場の分析(数量と金額)
- 価格動向分析
- カナダ
- 生産分析
- 消費量の分析(数量と金額)
- 輸入市場の分析(数量と金額)
- 輸出市場の分析(数量と金額)
- 価格動向分析
- メキシコ
- 生産量の分析
- 消費量分析(数量と金額)
- 輸入市場の分析(数量と金額)
- 輸出市場の分析(数量と金額)
- 価格動向の分析
- 欧州
- ドイツ
- 生産分析
- 消費市場分析(数量と金額)
- 輸入市場の分析(数量と金額)
- 輸出市場の分析(数量と金額)
- 価格動向分析
- ポーランド
- 生産量の分析
- 消費量の分析(数量と金額)
- 輸入市場の分析(数量と金額)
- 輸出市場の分析(数量と金額)
- 価格動向の分析
- イタリア
- 生産量の分析
- 消費量の分析(数量と金額)
- 輸入市場の分析(数量と金額)
- 輸出市場の分析(数量と金額)
- 価格動向の分析
- フランス
- 生産量の分析
- 消費量の分析(数量と金額)
- 輸入市場の分析(数量と金額)
- 輸出市場の分析(数量と金額)
- 価格動向の分析
- トルコ
- 生産量の分析
- 消費市場の分析(数量と金額)
- 輸入市場の分析(数量と金額)
- 輸出市場の分析(数量と金額)
- 価格動向の分析
- アジア太平洋地域
- 中国
- 生産分析
- 消費市場の分析(数量と金額)
- 輸入市場の分析(数量と金額)
- 輸出市場の分析(数量と金額)
- 価格動向分析
- 韓国
- 生産分析
- 消費市場の分析(数量と金額)
- 輸入市場の分析(数量と金額)
- 輸出市場の分析(数量と金額)
- 価格動向の分析
- 日本
- 生産分析
- 消費量の分析(数量と金額)
- 輸入市場の分析(数量と金額)
- 輸出市場の分析(数量と金額)
- 価格動向の分析
- インド
- 生産量の分析
- 消費市場の分析(数量と金額)
- 輸入市場の分析(数量と金額)
- 輸出市場の分析(数量と金額)
- 価格動向の分析
- 南米
- ブラジル
- 生産分析
- 消費市場の分析(数量と金額)
- 輸入市場の分析(数量と金額)
- 輸出市場の分析(数量と金額)
- 価格動向の分析
- アルゼンチン
- 生産量の分析
- 消費量の分析(数量と金額)
- 輸入市場の分析(数量と金額)
- 輸出市場の分析(数量と金額)
- 価格動向分析
- チリ
- 生産量の分析
- 消費量の分析(数量と金額)
- 輸入市場の分析(数量と金額)
- 輸出市場の分析(数量と金額)
- 価格動向の分析
- アフリカ
- 南アフリカ共和国
- 生産分析
- 消費市場の分析(数量と金額)
- 輸入市場の分析(数量と金額)
- 輸出市場の分析(数量と金額)
- 価格動向の分析
- エジプト
- 生産量の分析
- 消費量の分析(数量と金額)
- 輸入市場の分析(数量と金額)
- 輸出市場の分析(数量と金額)
- 価格動向分析
- 北米
第6章 市場機会と将来動向
The fresh pears market was projected to register a CAGR of 4.7% during the forecast period.
Key Highlights
- Pears contain special phytonutrients, including anti-inflammatory flavonoids, anticancer polyphenols, and anti-aging flavonoids. Pear is one of the best sources of vitamin C, vitamin K, and boron. It can help lower inflammation, which is the root cause of most diseases. Thus, the benefits of this fruit have, in turn, driven its consumption, majorly across the United States. The increasing health consciousness and the increasing demand for organic fruits act as the major driving forces behind the growth of the fresh pears market.
- The Japanese government is looking to export to various markets, the pear industry in particular, as domestic consumption is set to decrease with a declining population, so the country is aiming to expand its annual agriculture exports by 2030.
- The sales have been high in supermarkets and health food stores, targeting upscale consumers with specialized eating habits. According to FAOSTAT, global pear production accounted for 25.6 million metric tons last year, with a harvested area of 1.3 million hectares. Asia was the largest pear-producing region, with a production of 20.8 million metric tons last year.
Fresh Pears Market Trends
Increasing Production and Per capita consumption of Fresh Pears in United States
Pears are an excellent source of fiber and a good source of vitamin C for only 100 calories per serving. They are sodium-free, cholesterol-free, and fat-free and contain 190 mg of potassium. The USDA Dietary Guidelines for American pears will reduce their risk of some chronic diseases and this makes the high demand for domestic production and consumption of pears in the country and this will strengthen the market in coming years.
According to FAOSTAT, 2021, the total pear production in the United States was 636,390 thousand metric tons with a harvested area of 16,876 hectares. The United States per capita consumption of fresh pears increased from 2.92 pounds to 3.12 pounds from 2020 to 2021.
Pear is mainly produced in Washington and Oregon in the United States. Washington's fresh pear production is the largest in the United States, accounting for half of the pear production in the country. Oregon and Washington account for 25% of pear production in the United States. Northwest pears are majorly produced in the Yakima and Wenatchee areas of Washington and the Rogue River Valley and Hood river areas of Oregon.
Although finding adequate labor is a major concern and the cost associated with the labor is also high. As a result, modern techniques of farming are utilized, including GPS and variable rate technologies, for fertilizer and water applications to maintain production in the economy which will boost the market during the forecasting period.
China is the Major Exporter and Producer
China is the largest producer and exporter of pears in the world. With the gradual rise in temperatures, China's pears entered their period of peak sales and were affected by the domestic stocking for the Qingming Festival and overseas stocking for Muslim countries' Eid al-Fitr, the demand in both markets increased, leading to a slight rise in the price of fresh pears by about 10%. Merchants managed to increase sales through online and offline channels, especially with the rapid development of fresh food e-commerce, consumers can buy a variety of China's fresh pears through an easy click on the platforms.
According to FAOSTAT, 2021, China's fresh pear production was 18.9 million ton, and exported 510,138 ton of pears worth USD 605.4 thousand. In China, the export value has slightly declined in 2021, compared to the previous year due to the impact of the pandemic all over the world. According to the Foreign Agricultural Service (FAS) of the United States Department of Agriculture, China is anticipated to produce almost 2% higher than in the previous year. Though the drought has reduced the pear harvest in China's eastern provinces, the total production is expected to increase because of abundant harvests in other regions.
The countries with the highest levels of pear per capita consumption in 2020 were Argentina, Italy, the United States, and China. Thus, the increasing demand for pear worldwide, the market is expected to continue an upward consumption and tends to grow the market in the coming years.
Fresh Pears Industry Overview
Additional Benefits:
- The market estimate (ME) sheet in Excel format
- 3 months of analyst support
TABLE OF CONTENTS
1 INTRODUCTION
- 1.1 Study Assumptions & Market Definitions
- 1.2 Scope of the Study
2 RESEARCH METHODOLOGY
3 EXECUTIVE SUMMARY
4 MARKET DYNAMICS
- 4.1 Market Overview
- 4.2 Market Drivers
- 4.3 Market Restraints
- 4.4 Supply Chain/Value Chain Analysis
5 MARKET SEGMENTATION
- 5.1 Geography
- 5.1.1 North America
- 5.1.1.1 United States
- 5.1.1.1.1 Production Analysis
- 5.1.1.1.2 Consumption Analysis (Volume and Value)
- 5.1.1.1.3 Import Market Analysis (Volume and Value)
- 5.1.1.1.4 Export Market Analysis (Volume and Value)
- 5.1.1.1.5 Price Trend Analysis
- 5.1.1.2 Canada
- 5.1.1.2.1 Production Analysis
- 5.1.1.2.2 Consumption Analysis (Volume and Value)
- 5.1.1.2.3 Import Market Analysis (Volume and Value)
- 5.1.1.2.4 Export Market Analysis (Volume and Value)
- 5.1.1.2.5 Price Trend Analysis
- 5.1.1.3 Mexico
- 5.1.1.3.1 Production Analysis
- 5.1.1.3.2 Consumption Analysis(Volume and Value)
- 5.1.1.3.3 Import Market Analysis (Volume and Value)
- 5.1.1.3.4 Export Market Analysis (Volume and Value)
- 5.1.1.3.5 Price Trend Analysis
- 5.1.2 Europe
- 5.1.2.1 Germany
- 5.1.2.1.1 Production Analysis
- 5.1.2.1.2 Consumption Analysis(Volume and Value)
- 5.1.2.1.3 Import Market Analysis (Volume and Value)
- 5.1.2.1.4 Export Market Analysis (Volume and Value)
- 5.1.2.1.5 Price Trend Analysis
- 5.1.2.2 Poland
- 5.1.2.2.1 Production Analysis
- 5.1.2.2.2 Consumption Analysis (Volume and Value)
- 5.1.2.2.3 Import Market Analysis (Volume and Value)
- 5.1.2.2.4 Export Market Analysis (Volume and Value)
- 5.1.2.2.5 Price Trend Analysis
- 5.1.2.3 Italy
- 5.1.2.3.1 Production Analysis
- 5.1.2.3.2 Consumption Analysis (Volume and Value)
- 5.1.2.3.3 Import Market Analysis (Volume and Value)
- 5.1.2.3.4 Export Market Analysis (Volume and Value)
- 5.1.2.3.5 Price Trend Analysis
- 5.1.2.4 France
- 5.1.2.4.1 Production Analysis
- 5.1.2.4.2 Consumption Analysis (Volume and Value)
- 5.1.2.4.3 Import Market Analysis (Volume and Value)
- 5.1.2.4.4 Export Market Analysis (Volume and Value)
- 5.1.2.4.5 Price Trend Analysis
- 5.1.2.5 Turkey
- 5.1.2.5.1 Production Analysis
- 5.1.2.5.2 Consumption Analysis (Volume and Value)
- 5.1.2.5.3 Import Market Analysis (Volume and Value)
- 5.1.2.5.4 Export Market Analysis (Volume and Value)
- 5.1.2.5.5 Price Trend Analysis
- 5.1.3 Asia Pacific
- 5.1.3.1 China
- 5.1.3.1.1 Production Analysis
- 5.1.3.1.2 Consumption Analysis (Volume and Value)
- 5.1.3.1.3 Import Market Analysis (Volume and Value)
- 5.1.3.1.4 Export Market Analysis (Volume and Value)
- 5.1.3.1.5 Price Trend Analysis
- 5.1.3.2 South Korea
- 5.1.3.2.1 Production Analysis
- 5.1.3.2.2 Consumption Analysis (Volume and Value)
- 5.1.3.2.3 Import Market Analysis (Volume and Value)
- 5.1.3.2.4 Export Market Analysis (Volume and Value)
- 5.1.3.2.5 Price Trend Analysis
- 5.1.3.3 Japan
- 5.1.3.3.1 Production Analysis
- 5.1.3.3.2 Consumption Analysis (Volume and Value)
- 5.1.3.3.3 Import Market Analysis (Volume and Value)
- 5.1.3.3.4 Export Market Analysis (Volume and Value)
- 5.1.3.3.5 Price Trend Analysis
- 5.1.3.4 India
- 5.1.3.4.1 Production Analysis
- 5.1.3.4.2 Consumption Analysis (Volume and Value)
- 5.1.3.4.3 Import Market Analysis (Volume and Value)
- 5.1.3.4.4 Export Market Analysis (Volume and Value)
- 5.1.3.4.5 Price Trend Analysis
- 5.1.4 South America
- 5.1.4.1 Brazil
- 5.1.4.1.1 Production Analysis
- 5.1.4.1.2 Consumption Analysis (Volume and Value)
- 5.1.4.1.3 Import Market Analysis (Volume and Value)
- 5.1.4.1.4 Export Market Analysis (Volume and Value)
- 5.1.4.1.5 Price Trend Analysis
- 5.1.4.2 Argentina
- 5.1.4.2.1 Production Analysis
- 5.1.4.2.2 Consumption Analysis (Volume and Value)
- 5.1.4.2.3 Import Market Analysis (Volume and Value)
- 5.1.4.2.4 Export Market Analysis (Volume and Value)
- 5.1.4.2.5 Price Trend Analysis
- 5.1.4.3 Chile
- 5.1.4.3.1 Production Analysis
- 5.1.4.3.2 Consumption Analysis (Volume and Value)
- 5.1.4.3.3 Import Market Analysis (Volume and Value)
- 5.1.4.3.4 Export Market Analysis (Volume and Value)
- 5.1.4.3.5 Price Trend Analysis
- 5.1.5 Africa
- 5.1.5.1 South Africa
- 5.1.5.1.1 Production Analysis
- 5.1.5.1.2 Consumption Analysis (Volume and Value)
- 5.1.5.1.3 Import Market Analysis (Volume and Value)
- 5.1.5.1.4 Export Market Analysis (Volume and Value)
- 5.1.5.1.5 Price Trend Analysis
- 5.1.5.2 Egypt
- 5.1.5.2.1 Production Analysis
- 5.1.5.2.2 Consumption Analysis (Volume and Value)
- 5.1.5.2.3 Import Market Analysis (Volume and Value)
- 5.1.5.2.4 Export Market Analysis (Volume and Value)
- 5.1.5.2.5 Price Trend Analysis
- 5.1.1 North America