|
|
市場調査レポート
商品コード
1198815
風力タービンローターブレード市場- 成長、動向、予測(2023年-2028年)Wind Turbine Rotor Blade Market - Growth, Trends, and Forecasts (2023 - 2028) |
||||||
|
● お客様のご希望に応じて、既存データの加工や未掲載情報(例:国別セグメント)の追加などの対応が可能です。 詳細はお問い合わせください。 |
|||||||
| 風力タービンローターブレード市場- 成長、動向、予測(2023年-2028年) |
|
出版日: 2023年01月23日
発行: Mordor Intelligence
ページ情報: 英文 198 Pages
納期: 2~3営業日
|
- 全表示
- 概要
- 目次
風力タービンローターブレードの世界市場規模は、今年度約204億9000万米ドルと推定され、予測期間中はCAGR7%以上で推移すると予測されています。
市場は、2020年のCOVID-19によって中程度の影響を受けました。現在、市場はパンデミック前の水準に達しています。
主なハイライト
- 市場の主な促進要因は、世界中でオフショアおよびオンショアの風力発電設備の数が増加していることです。
- 一方、それに伴う輸送コストの高さや、太陽光発電、水力発電などの代替クリーン電源のコスト競争力が、市場成長の妨げになる可能性があります。
- 風力発電業界では、費用対効果の高いソリューションが求められており、高効率の製品は業界のダイナミクスを変える可能性を秘めています。古いタービンが交換されたのは、破損したからではなく、より効率の高いブレードが市場に出回っているからだという例もあります。したがって、技術開拓は風力タービンローターブレード市場の機会として提示されるのです。
- 2022年の風力タービンローターブレード市場はアジア太平洋が支配的で、需要の大部分は中国、インド、オーストラリアなどの国からもたらされます。
風力タービンローターブレードの市場動向
市場を独占するのは陸上セグメント
- 陸上風力発電技術は、設置容量(メガワット)あたりの発電量を最大化し、風速が低い場所でもより多くカバーできるように、過去5年間で進化してきました。また、近年では、風力タービンのハブ高、直径、風力タービンブレードの大きさなどが大型化しています。
- Global Wind Energy Council(GWEC)によると、2021年の陸上風力市場は、世界2大風力市場である中国と米国の陸上風力市場の成長鈍化により、2020年より18%少ない7250万kWが世界で追加されました。しかし、2021年には、欧州、ラテンアメリカ、アフリカ、中東で爆発的な成長が見られ、陸上の新規設置量は19%、27%、120%増加しました。
- アジア太平洋と北米の陸上風力発電の増設は、2020年に比べて31%、21%減少しましたが、この2つの地域を合わせても2021年の世界の陸上風力発電の3分の2以上を占めています。しかし、中国、米国、インドなど複数の主要国による投資と意欲的な再生可能エネルギー目標が、予測期間中の風力タービンローターブレードの需要を促進すると予想されます。
- さらに、国際再生可能エネルギー機関(IRENA)によると、平準化エネルギーコスト(LCOE)と世界加重平均総設備コストは、2016年の0.060米ドル/kWhと1652米ドル/kWから2020年には0.039米ドル/kWhと1355米ドル/kWに減少しています。また、予測期間中は、資本コストの削減、成熟化に伴う競争の激化、技術の向上により、LCOEと加重平均コストはさらに低下すると予想されます。
- インドは、最も成長が著しい風力発電国の1つです。インドの新・再生可能エネルギー省によると、2021年時点で同国は世界で4番目に高い風力発電の設置容量を持ち、その総設備容量は408万kWに達しています。風力産業の拡大により、同国では強固なエコシステム、プロジェクト運営能力、年間約1万MWの製造拠点が形成されています。中国も同じ傾向をたどっています。国家エネルギー局(NEA)によると、2021年に47.5GWの風力容量が系統連系され、陸上風力設置容量の合計は310.62GWと記録されています。高い投資額と政府政策の変更により、インドと中国では陸上セグメントが風力タービンローターブレード市場の成長をリードすると予想されます。
- GWECによると、米国の陸上風力部門は2021年に世界で2番目に高い年間新規設置量を記録し、約1274万kWの試運転が行われたとのことです。米国の陸上風力発電の設置は、主にプロジェクト開発者が期限を守らなければならないため、計画されていた生産税額控除の段階的廃止が原因となり、陸上風力タービンローターブレード市場にも直接的に寄与しています。
- また、WindEuropeによると、2030年までに炭素排出量ゼロを目指す欧州地域では、陸上風力発電が市場の需要を牽引するとされています。GWECによると、陸上風力発電の発電量は風力エネルギーの約90%を占めています。二酸化炭素排出量の削減と従来型電力システムの段階的廃止に向けた厳格な規制が、市場を牽引すると予想されます。
- したがって、上記の要因に基づき、陸上風力タービンローターブレード分野は、クリーンな資源による高いエネルギー需要と相まって、LCOEの低下とCAPEXの削減により、予測期間中に成長すると予想されます。
アジア太平洋地域が市場を独占
- アジア太平洋地域は、世界の風力タービンローターブレード市場において最も大きな地域の1つです。需要の大半は中国、インド、日本から生み出されています。1891年に近代的な風力タービン発電機(WTG)が発明されて以来、中国は風力エネルギー技術が農村部や孤立した地域に電力を供給する効果的な方法であることを認識しています。中国の風力発電設備容量は、1990年にはわずか4MWでしたが、政策改革、専用の研究開発イニシアティブ、新しい融資メカニズム、最新の5カ年計画における明確な目標などにより、2021年には338.3GWまで増加しました。
- 中国の2021年の設備容量と新規容量はともに、大きな差をつけて世界最大となっています。IRENAによると、中国は今後も陸上風力発電業界を支配し、2050年までに世界の導入量の50%以上を占めると予想されています。また、人口が多いため、同国の高い電力需要が風力発電の成長を促進すると期待されています。中国企業を含む複数の多国籍企業が、国内の連邦政府や州政府の支援を受け、この分野に投資しています。
- 国家エネルギー局(NEA)によると、中国は2021年に4750万kWの陸上風力発電容量を接続し、陸上設置の合計を31062万kWに押し上げます。さらに、中国の陸上風力発電市場は、国内市場だけでなく、国際輸出のための主要部品や材料のニーズが高まっており、今後数年間は安定的に成長すると予想されます。また、中国では、発電量の70%近くが火力発電によるものです。火力発電による汚染が深刻化していることから、よりクリーンな再生可能エネルギーの発電比率を高めることに力を注いでいます。
- さらに、2021年に世界で新たに設置された洋上風力発電容量は2110万kWのうち、8割(1690万kW)が中国製であり、中国の洋上風力の累積容量は2768万kWに達しています。これらのことから、風力発電用ローターブレード市場は、中国がアジア太平洋地域で最大の市場になると予想されます。
- インドは、2021年時点で世界第4位の風力発電設備容量を保有しています。これらのプロジェクトは、主に同国の北部、南部、西部に広がっています。2021年時点のインドの風力発電設備容量は4,008万kWで、2020年の3862万kWから4%増加しています。また、発電容量全体に占める非化石燃料の割合は、395GW中38.5%となっています。現在、風力はこのうち10.2%を占めているが、2030年の気候変動対策の約束をさらに実現するために、新・再生可能エネルギー省(MNRE)は、2030年までに140GWの風力発電能力が必要と推定しています。この目標を達成するために、今後数年間で風力発電プロジェクトの数が飛躍的に増加することが予想され、同国の風力発電装置の需要を牽引しています。
- さらに、インドでは、7,600kmに及ぶ海岸線にある、まったく未開発の洋上風力発電の潜在力を活用し、グリーンエネルギーのポートフォリオを拡大しようとしています。近年、洋上への注目度は高まっています。再生可能エネルギー省は、2030年までに30GWの洋上風力発電設備を設置する目標を掲げています。
- したがって、今後の風力発電プロジェクトなどの要因に加え、アジア太平洋地域のさまざまな国での支持的な政府の政策と規制が、予測期間中にアジア太平洋地域の風力タービンローターブレードの需要を増加させると予想されます。
風力タービンローターブレード市場の競合他社分析
風力タービンローターブレード市場は、その性質上、断片的です。市場の主要プレイヤー(順不同)には、TPI Composites SA、LM Wind Power(GE Renewable Energy事業)、Siemens Gamesa Renewable Energy, S.A.、Vestas Wind Systems A/S、Enercon GmbHなどが挙げられます。
その他の特典
- エクセル形式の市場予測(ME)シート
- アナリストによる3ヶ月間のサポート
目次
第1章 イントロダクション
- 調査範囲
- 調査の前提条件
第2章 エグゼクティブサマリー
第3章 調査手法
第4章 市場の概要
- イントロダクション
- 2027年までの市場規模・需要予測(単位:10億米ドル)
- 風力タービンローターブレードの価格分析
- 最近の動向と開発状況
- 政府の政策と規制、ターゲット
- 市場力学
- 促進要因
- 抑制要因
- サプライチェーン分析
- ポーターのファイブフォース分析
- 供給企業の交渉力
- 消費者の交渉力
- 新規参入業者の脅威
- 代替品の脅威
- 競争企業間の敵対関係
第5章 市場セグメンテーション
- 展開場所
- オンショア
- オフショア
- ブレード素材
- カーボンファイバー
- ガラス繊維
- その他のブレード素材
- 地域別
- 北米
- 欧州
- アジア太平洋地域
- 南米
- 中東
第6章 競合情勢
- M&A、ジョイントベンチャー、コラボレーション、合意書
- 主要なプレーヤーが採用する戦略
- 企業プロファイル
- TPI Composites Inc.
- Lianyungang Zhongfu Lianzhong Composites Group Co. Ltd
- LM Wind Power(a GE Renewable Energy business)
- Nordex SE
- Siemens Gamesa Renewable Energy, S.A.
- Vestas Wind Systems A/S
- MFG Wind
- Sinoma wind power blade Co. Ltd
- Aeris Energy
- Suzlon Energy Limited
- Enercon GmbH
第7章 市場機会と将来動向
The Global Wind Turbine Rotor Blade Market size was estimated at about USD 20.49 billion in the current year and is projected to register at a CAGR of more than 7% during the forecast period.
The market was moderately impacted by COVID-19 in 2020. Presently, the market has reached pre-pandemic levels.
Key Highlights
- The major driving factor of the market is the growing number of offshore and onshore wind energy installations across the world.
- On the flip side, the associated high cost of transportation and cost competitiveness of alternate clean power sources, like solar power, hydropower, etc., have the potential to hinder market growth.
- The wind power industry has been in demand for cost-effective solutions, and a highly efficient product has the potential to change the dynamics of the industry. There were instances where old turbines were replaced, not because of the damage but due to the availability of more efficient blades in the market. Hence, technological developments present themselves as opportunities for the wind turbine rotor blade market.
- Asia-Pacific dominated the wind turbine rotor blade market in 2022, with the majority of the demand coming from countries like China, India, and Australia.
Wind Turbine Rotor Blade Market Trends
Onshore Segment to Dominate the Market
- The onshore wind energy power generation technology has evolved over the last five years to maximize electricity produced per megawatt capacity installed and to cover more sites with lower wind speeds. Besides this, in recent years, wind turbines have become larger with taller hub heights, broader diameters, and larger wind turbine blades.
- According to the Global Wind Energy Council (GWEC), the onshore wind market added 72.5 GW worldwide in 2021, 18% lower than in 2020, due to a slowdown in the growth of the onshore wind market in China and the United States, the world's two largest wind markets. However, in 2021, explosive growth was witnessed in Europe, Latin America, Africa, and the Middle East, where new onshore installations increased by 19%, 27%, and 120%.
- Onshore wind additions in the Asia-Pacific and North America have decreased by 31% and 21% compared to 2020, but the two regions combined still made up more than two-thirds of global onshore wind installations in 2021. However, investments and ambitious renewable targets from several major countries, such as China, the United States, and India, are expected to drive the demand for wind turbine rotor blade during the forecast period.
- Further, according to the International Renewable Energy Agency (IRENA), the levelized cost of energy (LCOE) and global weighted average total installed cost decreased from 0.060 USD/kWh and 1652 USD/kW in 2016 to 0.039 USD/kWh and 1355 USD/kW in 2020. In addition, the LCOE and the weighted average cost are expected to decline further owing to the reductions in capital costs, increased competition as the sector continues to mature, and improvements in technology during the forecast period.
- India is one of the fastest-growing wind power generators. According to India's Ministry of New and Renewable Energy, as of 2021 the country had the fourth-highest installed wind energy capacity in the world, with a total installed capacity of 40.08 GW. The expansion of the wind industry has resulted in a robust ecosystem, project operation capabilities, and a manufacturing base of about 10,000 MW per annum in the country. China follows the same trend. According to the National Energy Administration (NEA), 47.5 GW of wind capacity was grid-connected in 2021, and the total onshore installed wind capacity registered at 310.62 GW. Due to high investment and changes in government policy, the onshore segment is expected to lead the growth of the wind turbine rotor blade market in India and China.
- According to the GWEC, the United States' onshore wind sector reported the second-highest annual new installations in the world in 2021, with around 12.74 GW commissioned. The onshore wind installation in the United States was driven primarily due to the planned Production Tax Credit phase-out as project developers had to meet their deadline, which also directly aids the onshore wind turbine rotor blade market.
- Further, according to WindEurope, onshore wind energy will lead the market demand in the European region to achieve net-zero carbon emissions by 2030. According to GWEC, onshore wind energy capacity takes around 90% of wind energy. Strict regulations to reduce carbon emissions and phase out conventional power systems are expected to drive the market.
- Therefore, based on the above-mentioned factors, the onshore wind turbine rotor blade segment is expected to grow due to declining LCOE and reduced CAPEX, coupled with high energy demand through clean sources, during the forecast period.
Asia-Pacific to Dominate the Market
- Asia-Pacific is one of the largest regions in the global wind turbine rotor blade market. Most of the demand is generated from China, India, and Japan. Since the invention of the modern wind turbine generator (WTG) in 1891, China has recognized that wind energy technology offers an effective way to provide electricity to rural and isolated areas. China's installed wind capacity grew from a mere 4 MW in 1990 to 338.30 GW in 2021 due to policy reforms, dedicated R&D initiatives, new financing mechanisms, and clear goals in the most recent Five-Year Plans.
- Both China's installed capacity and new capacity in 2021 were the largest in the world by a wide margin. According to IRENA, China is expected to continue to dominate the onshore wind power industry, with more than 50% of global installations by 2050. Also, due to the high population, high electricity demand in the country is expected to promote growth in wind energy. Several multinational corporations, including Chinese firms, are investing in this sector with the help of federal and provincial governments across the country.
- According to the National Energy Administration (NEA), China connected 47.5 GW of onshore wind capacity in 2021, boosting its total onshore installations to 310.62 GW. Further, the Chinese onshore wind market is expected to grow steadily in the coming years, with rising needs for key components and materials, not only for the national market but also for international exports. Besides, in China, nearly 70% of the electricity produced is from thermal energy sources. As there is increasing pollution from thermal sources, the country has been focusing on increasing the share of cleaner and renewable sources in power generation.
- Furthermore, out of the total 21.10 GW of newly installed offshore capacity worldwide, 80% (16.90 GW) of the new installations came from China in 2021, and China's cumulative offshore wind capacity stood at 27.68 GW. All of this indicates that China is expected to be the largest market for wind turbine rotor blades market in the Asia-Pacific region.
- India held the fourth-largest wind power installed capacity globally as of 2021. These projects are majorly spread in the northern, southern, and western parts of the country. As of 2021, India's total installed wind capacity was 40.08 GW, witnessing an increase of 4% compared to the 38.62 GW in 2020. The country's current share of non-fossil fuels in overall generation capacity stands at 38.5% out of 395 GW. While wind currently accounts for 10.2% of this, to further realize its 2030 climate commitments, the Ministry of New and Renewable Energy (MNRE) has estimated that 140 GW of wind energy capacity is required by 2030. In order to reach such a target, the number of wind projects is expected to increase drastically in the coming years, driving the demand for wind power equipment in the country.
- Furthermore, India is trying to expand its green energy portfolio by harnessing the entirely unexploited offshore wind energy potential along its 7,600-kilometer coastline. The focus on offshore increased in recent years. The renewable energy ministry has set a target of 30 GW of offshore wind installations by 2030.
- Therefore, factors, such as upcoming wind power projects, along with supportive government policies and regulations in different countries across the region, are expected to increase the demand for wind turbine rotor blades in the Asia-Pacific during the forecast period.
Wind Turbine Rotor Blade Market Competitor Analysis
The wind turbine rotor blade market is fragmented in nature. Some of the major players in the market (in no particular order) include TPI Composites SA, LM Wind Power (a GE Renewable Energy business), Siemens Gamesa Renewable Energy, S.A., Vestas Wind Systems A/S, and Enercon GmbH.
Additional Benefits:
- The market estimate (ME) sheet in Excel format
- 3 months of analyst support
TABLE OF CONTENTS
1 INTRODUCTION
- 1.1 Scope of the Study
- 1.2 Study Assumptions
2 EXECUTIVE SUMMARY
3 RESEARCH METHODOLOGY
4 MARKET OVERVIEW
- 4.1 Introduction
- 4.2 Market Size and Demand Forecast in USD billion, till 2027
- 4.3 Wind Turbine Rotor Blades Price Analysis
- 4.4 Recent Trends and Developments
- 4.5 Government Policies, Regulations, and Targets
- 4.6 Market Dynamics
- 4.6.1 Drivers
- 4.6.2 Restraints
- 4.7 Supply Chain Analysis
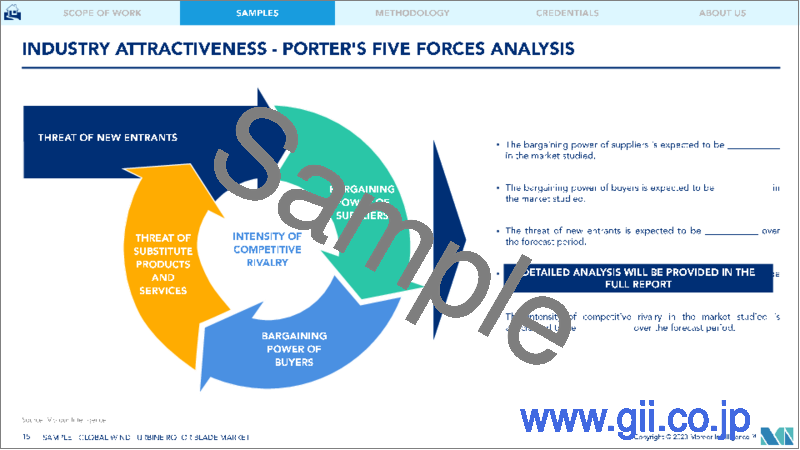
- 4.8 Porter's Five Forces Analysis
- 4.8.1 Bargaining Power of Suppliers
- 4.8.2 Bargaining Power of Consumers
- 4.8.3 Threat of New Entrants
- 4.8.4 Threat of Substitutes Products and Services
- 4.8.5 Intensity of Competitive Rivalry
5 MARKET SEGMENTATION
- 5.1 Location of Deployment
- 5.1.1 Onshore
- 5.1.2 Offshore
- 5.2 Blade Material
- 5.2.1 Carbon Fiber
- 5.2.2 Glass Fiber
- 5.2.3 Other Blade Materials
- 5.3 Geography
- 5.3.1 North America
- 5.3.2 Europe
- 5.3.3 Asia-Pacific
- 5.3.4 South America
- 5.3.5 Middle East
6 COMPETITIVE LANDSCAPE
- 6.1 Mergers and Acquisitions, Joint Ventures, Collaborations, and Agreements
- 6.2 Strategies Adopted by Leading Players
- 6.3 Company Profiles
- 6.3.1 TPI Composites Inc.
- 6.3.2 Lianyungang Zhongfu Lianzhong Composites Group Co. Ltd
- 6.3.3 LM Wind Power (a GE Renewable Energy business)
- 6.3.4 Nordex SE
- 6.3.5 Siemens Gamesa Renewable Energy, S.A.
- 6.3.6 Vestas Wind Systems A/S
- 6.3.7 MFG Wind
- 6.3.8 Sinoma wind power blade Co. Ltd
- 6.3.9 Aeris Energy
- 6.3.10 Suzlon Energy Limited
- 6.3.11 Enercon GmbH


