|
|
市場調査レポート
商品コード
1686626
バイオ肥料:市場シェア分析、産業動向と統計、成長予測(2025年~2030年)Biofertilizer - Market Share Analysis, Industry Trends & Statistics, Growth Forecasts (2025 - 2030) |
||||||
|
|||||||
カスタマイズ可能
適宜更新あり
|
|||||||

| バイオ肥料:市場シェア分析、産業動向と統計、成長予測(2025年~2030年) |
|
出版日: 2025年03月18日
発行: Mordor Intelligence
ページ情報: 英文 319 Pages
納期: 2~3営業日
|

全表示
- 概要
- 目次
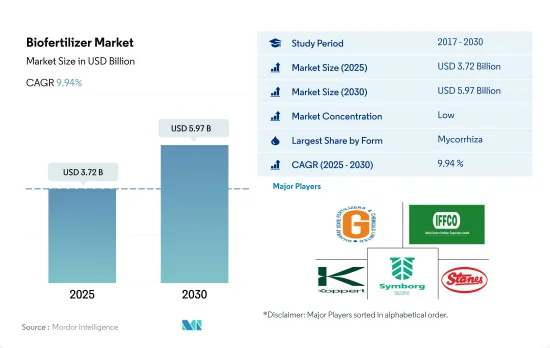
バイオ肥料市場規模は2025年に37億2,000万米ドルと推定・予測され、2030年には59億7,000万米ドルに達し、予測期間中(2025年~2030年)にCAGR 9.94%で成長すると予測されています。
- バイオ肥料は生きた微生物であり、土壌中の養分利用可能性を動員または増加させることにより、植物の栄養を強化することができます。農業でバイオ肥料として使用される最も一般的な微生物は、菌根菌、アゾスピリラム、アゾトバクター、リゾビウム、リン酸可溶化細菌などです。
- これらの中で、菌根菌は世界で最も消費されているバイオ肥料です。2022年にはバイオ肥料セグメントの36.7%を占め、市場価値は10億4,000万米ドル、数量は17万600トンでした。菌根菌は植物の根の表面積を増やし、養分の取り込みを促進します。
- 根粒菌は、世界で2番目に多く消費されているバイオ肥料です。2022年にはバイオ肥料セグメントの24.2%を占めました。北米が根粒菌サブセグメントを独占し、同年の市場シェアは52.1%でした。北米の根粒菌サブセグメントでは耕作作物が優勢で、2022年には62.4%を占めました。根粒菌は、連作作物のカテゴリーであるマメ科作物と共生関係にあります。そのため、根粒菌サブセグメントでは連作作物が優位を占めています。北米も連作作物の栽培面積が大きいです。北米の連作作物市場における根粒菌サブセグメントは、予測期間中に10.5%のCAGRで推移すると予想されています。
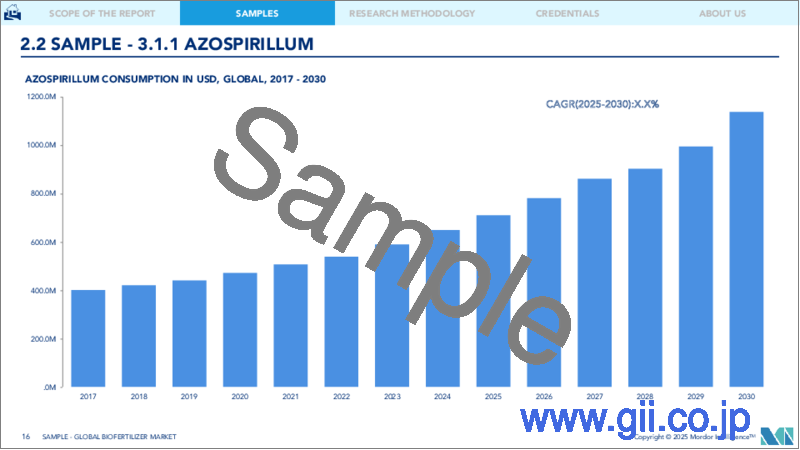
- アゾスピリラムはバイオ肥料セグメントの16.3%を占める。北米はアゾスピリラムのサブセグメントを支配し、2022年には45.7%を占めました。
- このように、世界の農業生物学的製剤市場のバイオ肥料セグメントは、作物の収量と土壌の健全性を向上させるために持続可能で環境に優しいソリューションを求める農家が増えるにつれて、今後数年間で成長すると予想されます。
- バイオ肥料は生きた微生物であり、土壌中の栄養分を動員または増加させることで植物の栄養を強化する能力を持っています。北米と欧州は、世界におけるバイオ肥料の主要消費国です。
- 北米は2022年に世界のバイオ肥料市場の34.5%を占めました。同地域の有機作物の栽培面積は、2017年の140万ヘクタールから2021年には160万ヘクタールと、過去期間中に13.5%増加しました。同地域の有機食品の需要は急速に伸びており、2021年の北米における有機食品への1人当たり平均支出額は109.7米ドルです。
- 欧州地域は2022年に30.7%を占め、バイオ肥料の第2位の消費者となりました。欧州の有機農業面積は世界最大で、2021年には650万ヘクタールとなります。欧州委員会は、2030年までに加盟国の有機栽培面積を地域の農地面積の25.0%に拡大する行動計画を発表しました。このことが、同地域のバイオ肥料市場をさらに牽引すると予想されます。
- アジア太平洋地域は、コメ、サトウキビ、果物・野菜などの有機作物の主要生産地です。中国とインドが新たなリーダーとなっているが、有機農法が農業総面積に占める割合はわずかです。この地域の有機農業面積は2017年から2021年にかけて増加しており、この動向がバイオ肥料市場の成長を促進すると予想されます。
- 特に欧州や北米のような地域では、世界中で有機作物面積が増加し、有機商品に対する需要が増加しているため、予測期間中にバイオ肥料の需要を促進する可能性があります。
世界のバイオ肥料市場動向
北米と欧州では、意識の高まりと政府の取り組みにより、有機農業の生産量が過去最高を記録しています。
- 有機農業は持続可能な食糧システムに大きく貢献するものとして台頭しており、世界187カ国で実践されています。2021年現在、世界の有機農地は7,230万haで、2018年から2021年にかけて全地域で平均2.9%増加しています。有機耕地は1,440万haで、有機農地全体の19.9%を占めています。
- 有機農業の最強市場は北米と欧州で、世界の有機耕地の41.0%を占める。2022年には、欧州の有機耕地面積は650万haとなり、有機耕地面積全体の44.1%に相当します。北米と欧州で有機栽培されている最も重要な作物は、リンゴ、イチゴ、穀物、オリーブです。
- アジア太平洋の新興諸国も有機農業運動に参加し、国内需要を満たす新鮮な有機農産物の生産と供給で自給自足しつつあります。有機農業の動向はアジア太平洋で勢いを増しており、同地域では2017年から2022年にかけて有機耕地面積が18.8%増加します。この地域の政府による主要な取り組みも、有機農業の拡大傾向に重要な役割を果たしています。例えば、日本の食料・農業・農村基本計画は、2030年までに有機農家と有機農地の数を3倍に増やすことを目標としています。
- 有機農業の成長の原動力となっているのは、土壌の健康を促進し、環境への影響を低減し、より健康的な食品を生産するといった、有機農業の利点に対する意識の高まりです。
有機食品の1人当たり支出は主に米国とドイツで観察されるが、これはより健康的で持続可能な食品に対する消費者の需要に起因します。
- オーガニック食品市場は過去数年間に著しい成長を遂げ、世界の売上高は2012年の708億米ドルから2020年には1,206億米ドルに達します。有機食品への動向は、より健康的で持続可能な食品の選択肢を求める消費者需要の高まりや、従来型農業が環境に与える影響に対する意識の高まりなど、いくつかの要因に後押しされています。世界の有機食品市場は、今後数年間も成長傾向が続くと予想されます。
- オーガニック・トレード協会が2021年に実施した調査によると、同年のオーガニック果物・野菜の売上高は約4.5%増加し、オーガニック売上高全体の15%を占めました。オーガニック製品への平均支出額では北米が市場を独占しており、米国の1人当たり支出額は2021年に186.7米ドルに達し、北米諸国の中で最も高いです。欧州も有機食品市場で大きな成長が見込まれており、2021年の1人当たり支出額が最も高いのはドイツで75.6米ドルです。
- 有機食品市場は、消費者の可処分所得の高い先進諸国が依然として支配的であるが、新興諸国でも成長が見込まれます。例えば、アジア太平洋地域では労働者階級が増加しており、有機食品を入手しやすく手頃な価格になっているため、市場の拡大に寄与する可能性があります。
バイオ肥料産業の概要
バイオ肥料市場は断片化されており、上位5社で21.14%を占めています。この市場の主要企業は以下の通りです。 Gujarat State Fertilizers & Chemicals Ltd, Indian Farmers Fertiliser Cooperative Limited, Koppert Biological Systems Inc., Symborg Inc. and T.Stanes and Company Limited(sorted alphabetically).
その他の特典
- エクセル形式の市場予測(ME)シート
- 3ヶ月のアナリストサポート
目次
第1章 エグゼクティブサマリーと主な調査結果
第2章 レポートのオファー
第3章 イントロダクション
- 調査の前提条件と市場定義
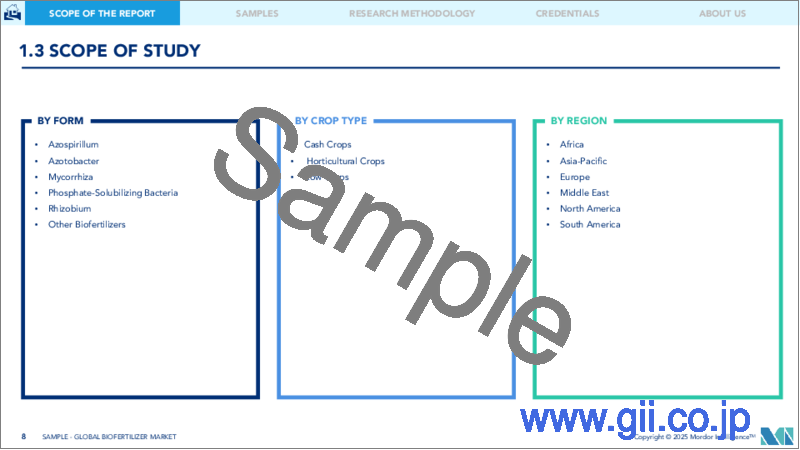
- 調査範囲
- 調査手法
第4章 主要産業動向
- 有機栽培面積
- 一人当たりのオーガニック製品への支出
- 規制の枠組み
- アルゼンチン
- オーストラリア
- ブラジル
- カナダ
- 中国
- エジプト
- フランス
- ドイツ
- インド
- インドネシア
- イラン
- イタリア
- 日本
- メキシコ
- オランダ
- ナイジェリア
- フィリピン
- ロシア
- 南アフリカ
- スペイン
- タイ
- トルコ
- 英国
- 米国
- ベトナム
- バリューチェーンと流通チャネル分析
第5章 市場セグメンテーション
- 形態
- アゾスピリラム
- アゾトバクター
- 菌根菌
- リン酸可溶菌
- 根粒菌
- その他のバイオ肥料
- 作物タイプ
- 換金作物
- 園芸作物
- 畑作物
- 地域
- アフリカ
- 国別
- エジプト
- ナイジェリア
- 南アフリカ
- その他のアフリカ
- アジア太平洋
- 国別
- オーストラリア
- 中国
- インド
- インドネシア
- 日本
- フィリピン
- タイ
- ベトナム
- その他のアジア太平洋
- 欧州
- 国別
- フランス
- ドイツ
- イタリア
- オランダ
- ロシア
- スペイン
- トルコ
- 英国
- その他の欧州
- 中東
- 国別
- イラン
- サウジアラビア
- その他の中東
- 北米
- 国別
- カナダ
- メキシコ
- 米国
- その他の北米
- 南米
- 国別
- アルゼンチン
- ブラジル
- その他の南米
- アフリカ
第6章 競合情勢
- 主要な戦略動向
- 市場シェア分析
- 企業情勢
- 企業プロファイル.
- Andermatt Group AG
- Atlantica Agricola
- Binzhou Jingyang Biological Fertilizer Co. Ltd
- Biostadt India Limited
- Ficosterra
- Gujarat State Fertilizers & Chemicals Ltd
- Indian Farmers Fertiliser Cooperative Limited
- Indogulf BioAg LLC(Biotech Division of Indogulf Company)
- IPL Biologicals Limited
- Kiwa Bio-Tech
- Koppert Biological Systems Inc.
- Microbial Biological Fertilizers International
- Sustane Natural Fertilizer Inc.
- Symborg Inc.
- T.Stanes and Company Limited
第7章 CEOへの主な戦略的質問
第8章 付録
- 世界概要
- 概要
- ファイブフォース分析フレームワーク
- 世界のバリューチェーン分析
- 市場力学(DROs)
- 情報源と参考文献
- 図表一覧
- 主要洞察
- データパック
- 用語集
The Biofertilizer Market size is estimated at 3.72 billion USD in 2025, and is expected to reach 5.97 billion USD by 2030, growing at a CAGR of 9.94% during the forecast period (2025-2030).
- Biofertilizers are living microorganisms that can enhance plant nutrition by either mobilizing or increasing nutrient availability in soils. The most common microorganisms used as biofertilizers in agriculture include mycorrhiza, Azospirillum, Azotobacter, Rhizobium, and phosphate-solubilizing bacteria.
- Among these, mycorrhiza is the most consumed biofertilizer globally. It accounted for 36.7% of the biofertilizer segment in 2022, with a market value of USD 1.04 billion and a volume of 170.6 thousand metric tons. Mycorrhiza increases the root surface area of plants, thus enhancing their nutrient uptake.
- Rhizobium is the second most consumed biofertilizer globally. It accounted for 24.2% of the biofertilizer segment in 2022. North America dominated the rhizobium sub-segment with a market share of 52.1% in the same year. Row crops dominated the rhizobium sub-segment in North America, accounting for 62.4% in 2022. Rhizobium has a symbiotic association with leguminous crops, a category of row crops. Thus, row crops dominated the rhizobium sub-segment. North America also has a large cultivation area of row crops. The rhizobium sub-segment in the North American row crops market is anticipated to record a CAGR of 10.5% during the forecast period.
- Azospirillum accounted for 16.3% of the biofertilizer segment. North America dominated the Azospirillum sub-segment, accounting for 45.7% in 2022.
- Thus, the biofertilizer segment of the global agricultural biologicals market is expected to grow in the coming years as more farmers seek sustainable and eco-friendly solutions to improve crop yields and soil health.
- Biofertilizers are living microorganisms that have the ability to enhance plant nutrition by either mobilizing or increasing nutrient availability in soils. North America and Europe are the major consumers of biofertilizers in the world.
- North America accounted for 34.5% of the global biofertilizer market in 2022. The area under cultivation of organic crops in the region increased by 13.5% during the historical period, from 1.4 million hectares in 2017 to 1.6 million hectares in 2021. The demand for organic food in the region is growing rapidly, with an average per capita spending on organic food products in North America at USD 109.7 in 2021.
- The European region accounted for 30.7% in 2022 and stood as the second-largest consumer of biofertilizers. Europe had the largest area under organic farming in the world, with 6.5 million hectares in 2021. The European Commission has unveiled an action plan to increase the organic area in the member countries to occupy 25.0% of the region's agricultural land area by 2030. This factor is further expected to drive the market for biofertilizers in the region.
- The Asia-Pacific region is a leading producer of organic crops such as rice, sugarcane, and fruits and vegetables. China and India are emerging leaders, although organic farming only accounts for a small portion of their total agricultural area. The organic farming area in the region grew from 2017 to 2021, and this trend is expected to drive growth in the biofertilizer market.
- The increasing organic crop area and increasing demand for organic commodities across the world, particularly in regions like Europe and North America, may drive the demand for biofertilizers during the forecast period.
Global Biofertilizer Market Trends
Organic production is at an all-time high in North America and Europe, due to the increasing awareness and Government initiatives.
- Organic agriculture has emerged as a significant contributor to sustainable food systems, with 187 countries practicing it globally. As of 2021, there was 72.3 million ha of organic agricultural land worldwide, with an average increase of 2.9% across all regions from 2018 to 2021. Organic arable land accounted for 14.4 million ha, representing 19.9% of the total organic agricultural land.
- The strongest markets for organic farming are North America and Europe, accounting for 41.0% of the global organic arable land. In 2022, Europe had 6.5 million ha of organic arable land, equivalent to 44.1% of the overall organic arable agricultural area. The most significant crops grown organically in North America and Europe are apples, strawberries, cereals, and olives.
- Developing countries in Asia-Pacific are also joining the organic agriculture movement and becoming self-sufficient in producing and providing fresh organic produce to meet their domestic demand. The trend of organic farming is gaining momentum in Asia-Pacific, with the region recording an 18.8% increase in organic arable land from 2017 to 2022. The major initiatives by governments in the region also play a vital role in the growing trend of organic farming. For example, Japan's Basic Plan for Food, Agriculture, and Rural Areas aims to triple the number of organic farmers and lands by 2030.
- The growth of organic agriculture is driven by the rising awareness of the benefits of organic farming, such as promoting soil health, reducing environmental impacts, and producing healthier food.
Per capita spending of organic food majorly observed in United States and Germany, attributed to the consumer demand for healthier and sustainable food
- The organic food market experienced significant growth in the past few years, with global sales reaching USD 120.6 billion in 2020, up from USD 70.8 billion in 2012. The trend toward organic food is being driven by several factors, such as increasing consumer demand for healthier, more sustainable food options and a growing awareness of the environmental impact of conventional agriculture. The global organic food market is expected to continue its growth trend over the coming years.
- According to a survey conducted by the Organic Trade Association in 2021, sales of organic fruits and vegetables increased by around 4.5% in the same year, accounting for 15% of the overall organic sales. North America dominates the market in terms of average spending on organic products, with per capita spending in the United States reaching USD 186.7 in 2021, the highest among all North American countries. Europe is also expected to experience significant growth in the organic food market, with Germany accounting for the highest per capita spending of USD 75.6 in 2021.
- While the organic food market is still dominated by developed countries with high consumer disposable incomes, it is also expected to grow in developing nations. For example, the increasing number of working-class people in the Asia-Pacific region may contribute to the market's expansion due to the growing availability and affordability of organic food products.
Biofertilizer Industry Overview
The Biofertilizer Market is fragmented, with the top five companies occupying 21.14%. The major players in this market are Gujarat State Fertilizers & Chemicals Ltd, Indian Farmers Fertiliser Cooperative Limited, Koppert Biological Systems Inc., Symborg Inc. and T.Stanes and Company Limited (sorted alphabetically).
Additional Benefits:
- The market estimate (ME) sheet in Excel format
- 3 months of analyst support
TABLE OF CONTENTS
1 EXECUTIVE SUMMARY & KEY FINDINGS
2 REPORT OFFERS
3 INTRODUCTION
- 3.1 Study Assumptions & Market Definition
- 3.2 Scope of the Study
- 3.3 Research Methodology
4 KEY INDUSTRY TRENDS
- 4.1 Area Under Organic Cultivation
- 4.2 Per Capita Spending On Organic Products
- 4.3 Regulatory Framework
- 4.3.1 Argentina
- 4.3.2 Australia
- 4.3.3 Brazil
- 4.3.4 Canada
- 4.3.5 China
- 4.3.6 Egypt
- 4.3.7 France
- 4.3.8 Germany
- 4.3.9 India
- 4.3.10 Indonesia
- 4.3.11 Iran
- 4.3.12 Italy
- 4.3.13 Japan
- 4.3.14 Mexico
- 4.3.15 Netherlands
- 4.3.16 Nigeria
- 4.3.17 Philippines
- 4.3.18 Russia
- 4.3.19 South Africa
- 4.3.20 Spain
- 4.3.21 Thailand
- 4.3.22 Turkey
- 4.3.23 United Kingdom
- 4.3.24 United States
- 4.3.25 Vietnam
- 4.4 Value Chain & Distribution Channel Analysis
5 MARKET SEGMENTATION (includes market size in Value in USD and Volume, Forecasts up to 2030 and analysis of growth prospects)
- 5.1 Form
- 5.1.1 Azospirillum
- 5.1.2 Azotobacter
- 5.1.3 Mycorrhiza
- 5.1.4 Phosphate Solubilizing Bacteria
- 5.1.5 Rhizobium
- 5.1.6 Other Biofertilizers
- 5.2 Crop Type
- 5.2.1 Cash Crops
- 5.2.2 Horticultural Crops
- 5.2.3 Row Crops
- 5.3 Region
- 5.3.1 Africa
- 5.3.1.1 By Country
- 5.3.1.1.1 Egypt
- 5.3.1.1.2 Nigeria
- 5.3.1.1.3 South Africa
- 5.3.1.1.4 Rest of Africa
- 5.3.2 Asia-Pacific
- 5.3.2.1 By Country
- 5.3.2.1.1 Australia
- 5.3.2.1.2 China
- 5.3.2.1.3 India
- 5.3.2.1.4 Indonesia
- 5.3.2.1.5 Japan
- 5.3.2.1.6 Philippines
- 5.3.2.1.7 Thailand
- 5.3.2.1.8 Vietnam
- 5.3.2.1.9 Rest of Asia-Pacific
- 5.3.3 Europe
- 5.3.3.1 By Country
- 5.3.3.1.1 France
- 5.3.3.1.2 Germany
- 5.3.3.1.3 Italy
- 5.3.3.1.4 Netherlands
- 5.3.3.1.5 Russia
- 5.3.3.1.6 Spain
- 5.3.3.1.7 Turkey
- 5.3.3.1.8 United Kingdom
- 5.3.3.1.9 Rest of Europe
- 5.3.4 Middle East
- 5.3.4.1 By Country
- 5.3.4.1.1 Iran
- 5.3.4.1.2 Saudi Arabia
- 5.3.4.1.3 Rest of Middle East
- 5.3.5 North America
- 5.3.5.1 By Country
- 5.3.5.1.1 Canada
- 5.3.5.1.2 Mexico
- 5.3.5.1.3 United States
- 5.3.5.1.4 Rest of North America
- 5.3.6 South America
- 5.3.6.1 By Country
- 5.3.6.1.1 Argentina
- 5.3.6.1.2 Brazil
- 5.3.6.1.3 Rest of South America
- 5.3.1 Africa
6 COMPETITIVE LANDSCAPE
- 6.1 Key Strategic Moves
- 6.2 Market Share Analysis
- 6.3 Company Landscape
- 6.4 Company Profiles (includes Global Level Overview, Market Level Overview, Core Business Segments, Financials, Headcount, Key Information, Market Rank, Market Share, Products and Services, and Analysis of Recent Developments).
- 6.4.1 Andermatt Group AG
- 6.4.2 Atlantica Agricola
- 6.4.3 Binzhou Jingyang Biological Fertilizer Co. Ltd
- 6.4.4 Biostadt India Limited
- 6.4.5 Ficosterra
- 6.4.6 Gujarat State Fertilizers & Chemicals Ltd
- 6.4.7 Indian Farmers Fertiliser Cooperative Limited
- 6.4.8 Indogulf BioAg LLC (Biotech Division of Indogulf Company)
- 6.4.9 IPL Biologicals Limited
- 6.4.10 Kiwa Bio-Tech
- 6.4.11 Koppert Biological Systems Inc.
- 6.4.12 Microbial Biological Fertilizers International
- 6.4.13 Sustane Natural Fertilizer Inc.
- 6.4.14 Symborg Inc.
- 6.4.15 T.Stanes and Company Limited
7 KEY STRATEGIC QUESTIONS FOR AGRICULTURAL BIOLOGICALS CEOS
8 APPENDIX
- 8.1 Global Overview
- 8.1.1 Overview
- 8.1.2 Porter's Five Forces Framework
- 8.1.3 Global Value Chain Analysis
- 8.1.4 Market Dynamics (DROs)
- 8.2 Sources & References
- 8.3 List of Tables & Figures
- 8.4 Primary Insights
- 8.5 Data Pack
- 8.6 Glossary of Terms

