|
|
市場調査レポート
商品コード
1403333
空間ゲノミクス・トランスクリプトミクスの世界市場:タイプ別、技術別、用途別、提供別、エンドユーザー別 - 予測(~2031年)Spatial Genomics Market by Type (Genomics, Transcriptomics) Technology (Sequencing, Imaging) Application (Oncology, Neurology) Offering (Consumables, Instrument, Software) End User (Pharmaceutical & Biotechnology, CRO) - Global Forecast to 2031 |
||||||
|
|
|||||||
|
● お客様のご希望に応じて、既存データの加工や未掲載情報(例:国別セグメント)の追加などの対応が可能です。 詳細はお問い合わせください。 |
|||||||


| 空間ゲノミクス・トランスクリプトミクスの世界市場:タイプ別、技術別、用途別、提供別、エンドユーザー別 - 予測(~2031年) |
|
出版日: 2024年01月09日
発行: Meticulous Research
ページ情報: 英文 198 Pages
納期: 即納可能
|
- 全表示
- 概要
- 図表
- 目次
世界の空間ゲノミクス・トランスクリプトミクスの市場規模は、2024~2031年にかけてCAGR 27.8%で成長し、2031年までに32億3,000万米ドルに達すると予測されています。
本レポートは、広範な2次調査と1次調査、市場シナリオの詳細な分析を経て、主要な業界促進要因、抑制要因、課題、機会の分析から構成されています。空間ゲノミクス市場の成長は、創薬研究開発における空間ゲノミクスの用途拡大、がん研究における空間ゲノミクスの利用拡大、次世代シーケンシング(NGS)の進歩、バイオマーカー検出における空間ゲノミクスの利用拡大、がんの有病率上昇などが牽引しています。しかし、ゲノミクスにおける標準化されたアプローチの欠如や、ゲノムデータのセキュリティとプライバシーに対する懸念が、この市場の成長を抑制しています。
さらに、個別化医薬品や遺伝子治療の採用が増加し、空間ゲノミクスへの投資が増加していることから、この市場で事業を展開する企業には成長機会がもたらされると期待されています。しかし、データ解析の複雑さと技術導入の遅れは、市場成長に影響を与える主な課題です。
当レポートでは、製品ポートフォリオの提供、地域情勢、業界をリードするプレーヤーが数年間(2020~2024年)に採用した主な戦略的発展の広範な評価に基づく競合情勢を提供しています。世界の空間ゲノミクス・トランスクリプトミクス市場で事業を展開している主要企業は、NanoString Technologies, Inc.(米国)、10X Genomics, Inc.(米国)、Illumina, Inc.(米国)、Oxford Nanopore Technologies Plc.(英国)、Akoya Biosciences, Inc.(米国)、Revvity, Inc.(米国)、S2 Genomics, Inc.(米国)、Cantata Bio(米国)、Vizgen Inc.(米国)、Biospyder Technologies Inc.(米国)、Resolve Biosciences GmbH(ドイツ)
本レポートで調査したすべての提供品の中で、機器セグメントは予測期間中に最も高いCAGRを記録すると予測されています。腫瘍微小環境のプロファイリングや、創薬・トランスレーショナルリサーチのための学術・研究機関における空間トランスクリプトミクスの採用は、空間ゲノミクスで使用される機器の需要にプラスの影響を与えています。さらに、主要な市場参入企業による製品の発売が市場の成長を支えています。例えば、2022年12月、10X Genomics, Inc.(米国)は、細胞内in situプロファイリング用のXenium Analyzerを発売しました。
本レポートで調査したすべてのタイプの中で、2024年にはトランスクリプトミクスセグメントが空間ゲノミクス・トランスクリプトミクス市場で最大のシェアを占めると予想されます。このセグメントの最大シェアは、トランスレーショナルリサーチで必要とされる全組織切片内の転写活性の完全なロードマップを提供するために、空間トランスクリプトミクスの使用が増加していることに起因しています。さらに、細胞成分の同定を目的とした空間トランスクリプトミクス技術の受け入れが増加していることも、市場成長の原動力となっています。
本レポートで調査したすべての技術の中で、シーケンスベースのセグメントは予測期間中に最も高いCAGRを記録すると予測されています。このセグメントの成長は、NGSプラットフォームが優れたシーケンス能力を大幅なコスト削減で提供することに起因しており、そのため大量のゲノムシーケンシングデータを作成するゲノム研究においてNGSの使用が増加しています。さらに、高スループット、低コスト、細胞の個別特性解析、複数のターゲットの解析が市場成長の原動力となっています。
本レポートで調査したすべての用途の中で、2024年には腫瘍分野が空間ゲノミクス・トランスクリプトミクス市場で最大のシェアを占めると予想されます。腫瘍生物学における空間ゲノミクス・トランスクリプトミクスの用途の増加(腫瘍の不均一性の研究、浸潤免疫細胞の存在の検出、腫瘍微小環境の洞察など)が、このセグメントの最大シェアに寄与しています。さらに、主要な市場参入企業による製品発表が最大シェアを支えています。例えば、2023年4月、Akoya Biosciences社(米国)は、がん研究の進歩のためにPhenoCode Discovery Panelsを発売しました。
本レポートで調査したすべてのエンドユーザーの中で、製薬・バイオテクノロジー企業セグメントは予測期間中に最も高いCAGRで成長すると予測されています。この成長の背景には、製薬・バイオテクノロジー企業による研究開発の増加、調査方法における空間ゲノミクスアッセイの利用率の上昇、バイオテクノロジー企業の増加があります。さらに、慢性疾患の増加により、医薬品開発プロセスを迅速化する必要性が加速しており、製薬企業における空間ゲノミクスの採用をさらに促進しています。
世界の空間ゲノミクス・トランスクリプトミクス市場の地域別シナリオの詳細分析では、5つの主要地域(北米、欧州、アジア太平洋、ラテンアメリカ、中東・アフリカ)の詳細な定性的・定量的洞察を、各地域の主要国のカバレッジとともに提供しています。2024年には、北米が空間ゲノミクス・トランスクリプトミクス市場で最大のシェアを占めると予想されています。北米がこの地域で圧倒的なシェアを占めているのは、尊敬される研究機関、大学、ゲノミクス研究に取り組む組織が多数あることが主な理由です。この地域は、医薬品の研究開発への多額の投資と主要な業界プレイヤーの存在により、がんゲノミクスの進歩において極めて重要な役割を果たしています。例えば、カナダの製薬企業による創薬のための研究開発費は増加しており、空間ゲノミクスの需要を牽引しています。例えば、カナダの製薬部門における研究開発費総額は、2019年の16億米ドルから22億米ドルに対し、2020年には18億米ドルから24億米ドルになると推定されています。
目次
第1章 イントロダクション
第2章 調査手法
第3章 エグゼクティブサマリー
第4章 市場洞察
- 市場
- 概要
- 市場成長に影響を与える要因
- 市場力学の影響分析
- 創薬・市場開拓における空間ゲノミクス応用の拡大が市場成長を促進
- 標準化の欠如とゲノムデータのプライバシーをめぐる懸念が空間ゲノミクス製品の採用を制限
- 個別化医療の普及が市場参入企業に成長機会をもたらす
- データ解析の複雑さが引き続き市場成長に影響を与える主要課題
- 要因分析
- 市場力学の影響分析
- 技術動向
- 空間ゲノミクスにおける人工知能(AI)の統合
- マルチプレックス空間ゲノミクス
- 投資と資金調達のシナリオ
- 価格分析
- ポーターのファイブフォース分析
第5章 空間ゲノミクス・トランスクリプトミクス市場の評価:提供別
- 概要
- 機器
- 消耗品
- ソフトウェア・サービス
第6章 空間ゲノミクス・トランスクリプトミクス市場の評価:タイプ別
- 概要
- トランスクリプトミクス
- ゲノミクス
第7章 空間ゲノミクス・トランスクリプトミクス市場の評価:技術別
- 概要
- イメージングベース
- シーケンスベース
第8章 空間ゲノミクス・トランスクリプトミクス市場の評価:用途別
- 概要
- 腫瘍学
- 神経学
- その他の用途
第9章 空間ゲノミクス・トランスクリプトミクス市場の評価:エンドユーザー別
- 概要
- 製薬・バイオテクノロジー企業
- 受託研究機関
- その他のエンドユーザー
第10章 空間ゲノミクス・トランスクリプトミクス市場の評価:地域別
- 概要
- 北米
- 米国
- カナダ
- 欧州
- ドイツ
- フランス
- 英国
- イタリア
- スペイン
- その他の欧州
- アジア太平洋
- 中国
- 日本
- インド
- その他のアジア太平洋
- ラテンアメリカ
- 中東・アフリカ
第11章 競合分析
- 概要
- 主要成長戦略
- 競合ベンチマーキング
- 競合ダッシュボード
- 業界リーダー
- 差別化要因
- バンガード
- 新興企業
- 市場シェア分析
- 10X Genomics, Inc.(U.S.)
- NanoString Technologies, Inc.(U.S.)
- Akoya Biosciences, Inc.(U.S.)
第12章 企業プロファイル(企業概要、財務スナップショット、製品ポートフォリオ、戦略的展開、SWOT分析)
- 10X Genomics, Inc.
- NanoString Technologies, Inc.
- Akoya Biosciences, Inc.
- Illumina, Inc.
- Oxford Nanopore Technologies Plc
- Revvity, Inc.
- S2 Genomics, Inc.
- Cantata Bio
- Vizgen Inc.
- Biospyder Technologies Inc.
- Resolve Biosciences GmbH
(注:上位5社のSWOT分析を掲載)
第13章 付録
- Table 1 Estimated Number of New Cancer Cases, by Type, 2020 Vs. 2030
- Table 2 Recent Investments and Funding in The Spatial Genomics & Transcriptomics Market
- Table 3 Spatial Genomics & Transcriptomics Instruments: Pricing (USD/Unit)
- Table 4 Spatial Genomics & Transcriptomics Consumables: Pricing (USD/Unit)
- Table 5 Global Spatial Genomics & Transcriptomics Market, by Offering, 2022-2031 (USD Million)
- Table 6 Key Companies Offering Instruments
- Table 7 Global Spatial Genomics & Transcriptomics Market for Instruments, by Country/Region, 2022-2031 (USD Million)
- Table 8 Key Companies Offering Consumables
- Table 9 Global Spatial Genomics & Transcriptomics Market for Consumables, by Country/Region, 2022-2031 (USD Million)
- Table 10 Key Companies Offering Software
- Table 11 Global Spatial Genomics & Transcriptomics Market for Software & Services, by Country/Region, 2022-2031 (USD Million)
- Table 12 Global Spatial Genomics & Transcriptomics Market, by Type, 2022-2031 (USD Million)
- Table 13 Global Spatial Transcriptomics Market, by Country/Region, 2022-2031 (USD Million)
- Table 14 Spatial Genomics: Key Application Areas
- Table 15 Global Spatial Genomics Market, by Country/Region, 2022-2031 (USD Million)
- Table 16 Global Spatial Genomics & Transcriptomics Market, by Technology, 2022-2031 (USD Million)
- Table 17 Global Imaging Based Spatial Genomics & Transcriptomics Market, by Country/Region, 2022-2031 (USD Million)
- Table 18 Global Sequencing Based Spatial Genomics & Transcriptomics Market, by Country/Region, 2022-2031 (USD Million)
- Table 19 Global Spatial Genomics & Transcriptomics Market, by Application, 2022-2031 (USD Million)
- Table 20 Global Spatial Genomics & Transcriptomics Market for Oncology, by Country/Region, 2022-2031 (USD Million)
- Table 21 Global Spatial Genomics & Transcriptomics Market for Neurology, by Country/Region, 2022-2031 (USD Million)
- Table 22 Global Spatial Genomics & Transcriptomics Market for Other Applications, by Country/Region, 2022-2031 (USD Million)
- Table 23 Global Spatial Genomics & Transcriptomics Market, by End User, 2022-2031 (USD Million)
- Table 24 Global Spatial Genomics & Transcriptomics Market for Pharmaceutical & Biotechnology Companies, by Country/Region, 2022-2031 (USD Million)
- Table 25 Global Spatial Genomics & Transcriptomics Market for Contract Research Organizations, by Country/Region, 2022-2031 (USD Million)
- Table 26 Global Spatial Genomics & Transcriptomics Market for Other End Users, by Country/Region, 2022-2031 (USD Million)
- Table 27 Global Spatial Genomics & Transcriptomics Market, by Country/Region, 2022-2031 (USD Million)
- Table 28 North America: Spatial Genomics & Transcriptomics Market, by Country, 2022-2031 (USD Million)
- Table 29 North America: Spatial Genomics & Transcriptomics Market, by Offering, 2022-2031 (USD Million)
- Table 30 North America: Spatial Genomics & Transcriptomics Market, by Type, 2022-2031 (USD Million)
- Table 31 North America: Spatial Genomics & Transcriptomics Market, by Technology, 2022-2031 (USD Million)
- Table 32 North America: Spatial Genomics & Transcriptomics Market, by Application, 2022-2031 (USD Million)
- Table 33 North America: Spatial Genomics & Transcriptomics Market, by End User, 2022-2031 (USD Million)
- Table 34 U.S.: Spatial Genomics & Transcriptomics Market, by Offering, 2022-2031 (USD Million)
- Table 35 U.S.: Spatial Genomics & Transcriptomics Market, by Type, 2022-2031 (USD Million)
- Table 36 U.S.: Spatial Genomics & Transcriptomics Market, by Technology, 2022-2031 (USD Million)
- Table 37 U.S.: Spatial Genomics & Transcriptomics Market, by Application, 2022-2031 (USD Million)
- Table 38 U.S.: Spatial Genomics & Transcriptomics Market, by End User, 2022-2031 (USD Million)
- Table 39 Canada: Spatial Genomics & Transcriptomics Market, by Offering, 2022-2031 (USD Million)
- Table 40 Canada: Spatial Genomics & Transcriptomics Market, by Type, 2022-2031 (USD Million)
- Table 41 Canada: Spatial Genomics & Transcriptomics Market, by Technology, 2022-2031 (USD Million)
- Table 42 Canada: Spatial Genomics & Transcriptomics Market, by Application, 2022-2031 (USD Million)
- Table 43 Canada: Spatial Genomics & Transcriptomics Market, by End User, 2022-2031 (USD Million)
- Table 44 Europe: Spatial Genomics & Transcriptomics Market, by Country/Region, 2022-2031 (USD Million)
- Table 45 Europe: Spatial Genomics & Transcriptomics Market, by Offering, 2022-2031 (USD Million)
- Table 46 Europe: Spatial Genomics & Transcriptomics Market, by Type, 2022-2031 (USD Million)
- Table 47 Europe: Spatial Genomics & Transcriptomics Market, by Technology, 2022-2031 (USD Million)
- Table 48 Europe: Spatial Genomics & Transcriptomics Market, by Application, 2022-2031 (USD Million)
- Table 49 Europe: Spatial Genomics & Transcriptomics Market, by End User, 2022-2031 (USD Million)
- Table 50 Germany: Spatial Genomics & Transcriptomics Market, by Offering, 2022-2031 (USD Million)
- Table 51 Germany: Spatial Genomics & Transcriptomics Market, by Type, 2022-2031 (USD Million)
- Table 52 Germany: Spatial Genomics & Transcriptomics Market, by Technology, 2022-2031 (USD Million)
- Table 53 Germany: Spatial Genomics & Transcriptomics Market, by Application, 2022-2031 (USD Million)
- Table 54 Germany: Spatial Genomics & Transcriptomics Market, by End User, 2022-2031 (USD Million)
- Table 55 France: Spatial Genomics & Transcriptomics Market, by Offering, 2022-2031 (USD Million)
- Table 56 France: Spatial Genomics & Transcriptomics Market, by Type, 2022-2031 (USD Million)
- Table 57 France: Spatial Genomics & Transcriptomics Market, by Technology, 2022-2031 (USD Million)
- Table 58 France: Spatial Genomics & Transcriptomics Market, by Application, 2022-2031 (USD Million)
- Table 59 France: Spatial Genomics & Transcriptomics Market, by End User, 2022-2031 (USD Million)
- Table 60 U.K.: Spatial Genomics & Transcriptomics Market, by Offering, 2022-2031 (USD Million)
- Table 61 U.K.: Spatial Genomics & Transcriptomics Market, by Type, 2022-2031 (USD Million)
- Table 62 U.K.: Spatial Genomics & Transcriptomics Market, by Technology, 2022-2031 (USD Million)
- Table 63 U.K.: Spatial Genomics & Transcriptomics Market, by Application, 2022-2031 (USD Million)
- Table 64 U.K.: Spatial Genomics & Transcriptomics Market, by End User, 2022-2031 (USD Million)
- Table 65 Italy: Spatial Genomics & Transcriptomics Market, by Offering, 2022-2031 (USD Million)
- Table 66 Italy: Spatial Genomics & Transcriptomics Market, by Type, 2022-2031 (USD Million)
- Table 67 Italy: Spatial Genomics & Transcriptomics Market, by Technology, 2022-2031 (USD Million)
- Table 68 Italy: Spatial Genomics & Transcriptomics Market, by Application, 2022-2031 (USD Million)
- Table 69 Italy: Spatial Genomics & Transcriptomics Market, by End User, 2022-2031 (USD Million)
- Table 70 Spain: Spatial Genomics & Transcriptomics Market, by Offering, 2022-2031 (USD Million)
- Table 71 Spain: Spatial Genomics & Transcriptomics Market, by Type, 2022-2031 (USD Million)
- Table 72 Spain: Spatial Genomics & Transcriptomics Market, by Technology, 2022-2031 (USD Million)
- Table 73 Spain: Spatial Genomics & Transcriptomics Market, by Application, 2022-2031 (USD Million)
- Table 74 Spain: Spatial Genomics & Transcriptomics Market, by End User, 2022-2031 (USD Million)
- Table 75 Rest of Europe: Spatial Genomics & Transcriptomics Market, by Offering, 2022-2031 (USD Million)
- Table 76 Rest of Europe: Spatial Genomics & Transcriptomics Market, by Type, 2022-2031 (USD Million)
- Table 77 Rest of Europe: Spatial Genomics & Transcriptomics Market, by Technology, 2022-2031 (USD Million)
- Table 78 Rest of Europe: Spatial Genomics & Transcriptomics Market, by Application, 2022-2031 (USD Million)
- Table 79 Rest of Europe: Spatial Genomics & Transcriptomics Market, by End User, 2022-2031 (USD Million)
- Table 80 Asia-Pacific: Spatial Genomics Market, by Country/Region, 2022-2031 (USD Million)
- Table 81 Asia-Pacific: Spatial Genomics Market, by Offering, 2022-2031 (USD Million)
- Table 82 Asia-Pacific: Spatial Genomics Market, by Type, 2022-2031 (USD Million)
- Table 83 Asia-Pacific: Spatial Genomics Market, by Technology, 2022-2031 (USD Million)
- Table 84 Asia-Pacific: Spatial Genomics Market, by Application, 2022-2031 (USD Million)
- Table 85 Asia-Pacific: Spatial Genomics Market, by End User, 2022-2031 (USD Million)
- Table 86 China: Spatial Genomics Market, by Offering, 2022-2031 (USD Million)
- Table 87 China: Spatial Genomics Market, by Type, 2022-2031 (USD Million)
- Table 88 China: Spatial Genomics Market, by Technology, 2022-2031 (USD Million)
- Table 89 China: Spatial Genomics Market, by Application, 2022-2031 (USD Million)
- Table 90 China: Spatial Genomics Market, by End User, 2022-2031 (USD Million)
- Table 91 Japan: Spatial Genomics Market, by Offering, 2022-2031 (USD Million)
- Table 92 Japan: Spatial Genomics Market, by Type, 2022-2031 (USD Million)
- Table 93 Japan: Spatial Genomics Market, by Technology, 2022-2031 (USD Million)
- Table 94 Japan: Spatial Genomics Market, by Application, 2022-2031 (USD Million)
- Table 95 Japan: Spatial Genomics Market, by End User, 2022-2031 (USD Million)
- Table 96 India: Spatial Genomics Market, by Offering, 2022-2031 (USD Million)
- Table 97 India: Spatial Genomics Market, by Type, 2022-2031 (USD Million)
- Table 98 India: Spatial Genomics Market, by Technology, 2022-2031 (USD Million)
- Table 99 India: Spatial Genomics Market, by Application, 2022-2031 (USD Million)
- Table 100 India: Spatial Genomics Market, by End User, 2022-2031 (USD Million)
- Table 101 Rest of Asia-Pacific: Spatial Genomics Market, by Offering, 2022-2031 (USD Million)
- Table 102 Rest of Asia-Pacific: Spatial Genomics Market, by Type, 2022-2031 (USD Million)
- Table 103 Rest of Asia-Pacific: Spatial Genomics Market, by Technology, 2022-2031 (USD Million)
- Table 104 Rest of Asia-Pacific: Spatial Genomics Market, by Application, 2022-2031 (USD Million)
- Table 105 Rest of Asia-Pacific: Spatial Genomics Market, by End User, 2022-2031 (USD Million)
- Table 106 Latin America: Spatial Genomics Market, by Offering, 2022-2031 (USD Million)
- Table 107 Latin America: Spatial Genomics Market, by Type, 2022-2031 (USD Million)
- Table 108 Latin America: Spatial Genomics Market, by Technology, 2022-2031 (USD Million)
- Table 109 Latin America: Spatial Genomics Market, by Application, 2022-2031 (USD Million)
- Table 110 Latin America: Spatial Genomics Market, by End User, 2022-2031 (USD Million)
- Table 111 Middle East & Africa: Spatial Genomics Market, by Offering, 2022-2031 (USD Million)
- Table 112 Middle East & Africa: Spatial Genomics Market, by Type, 2022-2031 (USD Million)
- Table 113 Middle East & Africa: Spatial Genomics Market, by Technology, 2022-2031 (USD Million)
- Table 114 Middle East & Africa: Spatial Genomics Market, by Application, 2022-2031 (USD Million)
- Table 115 Middle East & Africa: Spatial Genomics Market, by End User, 2022-2031 (USD Million)
- Table 116 Recent Developments, by Company, 2020-2023
LIST OF FIGURES
- Figure 1 Research Process
- Figure 2 Secondary Sources Referenced for This Study
- Figure 3 Primary Research Techniques
- Figure 4 Key Executives Interviewed
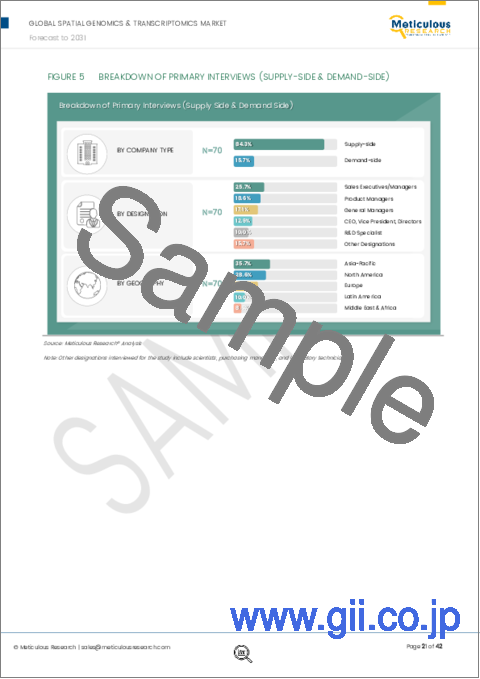
- Figure 5 Breakdown of Primary Interviews (Supply-Side & Demand-Side)
- Figure 6 Market Sizing and Growth Forecast Approach
- Figure 7 Global Spatial Genomics & Transcriptomics Market, by Offering, 2024 Vs. 2031 (USD Million)
- Figure 8 Global Spatial Genomics & Transcriptomics Market, by Type, 2024 Vs. 2031 (USD Million)
- Figure 9 Global Spatial Genomics & Transcriptomics Market, by Technology, 2024 Vs. 2031 (USD Million)
- Figure 10 Global Spatial Genomics & Transcriptomics Market, by Application, 2024 Vs. 2031 (USD Million)
- Figure 11 Global Spatial Genomics & Transcriptomics Market, by End User, 2024 Vs. 2031 (USD Million)
- Figure 12 Spatial Genomics & Transcriptomics Market, by Geography
- Figure 13 Impact Analysis of Market Dynamics
- Figure 14 Global Pharmaceutical R&D Expenditure, 2012-2026 (USD Billion)
- Figure 15 Estimated Number of New Cancer Cases, by Region, 2020 Vs. 2030 (In Thousand)
- Figure 16 Global Increase in The Number of Personalized Medicine Approvals, 2008-2020
- Figure 17 Porter's Five Forces Analysis
- Figure 18 Global Spatial Genomics & Transcriptomics Market, by Offering, 2024 Vs. 2031 (USD Million)
- Figure 19 Global Spatial Genomics & Transcriptomics Market, by Type, 2024 Vs. 2031 (USD Million)
- Figure 20 Global Spatial Genomics & Transcriptomics Market, by Technology, 2024 Vs. 2031 (USD Million)
- Figure 21 Imaging Based Methods: Workflow
- Figure 22 Sequencing Based Methods: Workflow
- Figure 23 Global Spatial Genomics & Transcriptomics Market, by Application, 2024 Vs. 2031 (USD Million)
- Figure 24 Global Spatial Genomics & Transcriptomics Market, by End User, 2024 Vs. 2031 (USD Million)
- Figure 25 Global Pharmaceutical R&D Spending, 2012-2026 (USD Billion)
- Figure 26 Global Spatial Genomics & Transcriptomics Market, by Region, 2024 Vs. 2031 (USD Million)
- Figure 27 North America: Spatial Genomics & Transcriptomics Market Snapshot
- Figure 28 U.S.: Pharmaceutical R&D Expenditures, 2014-2021 (USD Billion)
- Figure 29 Europe: Pharmaceutical R&D Expenditures, 2000-2021 (USD Million)
- Figure 30 Europe: Spatial Genomics & Transcriptomics Market Snapshot
- Figure 31 Roe: Countries Pharmaceutical R&D Expenditures, 2021 (USD Million)
- Figure 32 Asia-Pacific: Spatial Genomics Market Snapshot
- Figure 33 Key Growth Strategies Adopted by Leading Players, 2020-2023
- Figure 34 Spatial Genomics & Transcriptomics Market: Competitive Benchmarking (Based on Offering)
- Figure 35 Spatial Genomics & Transcriptomics Market: Competitive Benchmarking (Based on Geography)
- Figure 36 Competitive Dashboard: Spatial Genomics & Transcriptomics Market
- Figure 37 Global Spatial Genomics & Transcriptomics Market Share Analysis, by Key Players (2023)
- Figure 38 10x Genomics, Inc.: Financial Overview (2022)
- Figure 39 NanoString Technologies, Inc.: Financial Overview (2022)
- Figure 40 Akoya Biosciences, Inc.: Financial Overview (2022)
- Figure 41 Illumina, Inc.: Financial Overview (2022)
- Figure 42 Oxford Nanopore Technologies Plc.: Financial Overview (2022)
- Figure 43 PerkinElmer, Inc: Financial Overview (2022)
Spatial Genomics Market by Type (Genomics, Transcriptomics) Technology (Sequencing, Imaging) Application (Oncology, Neurology) Offering (Consumables, Instrument, Software) End User (Pharmaceutical & Biotechnology, CRO)-Global Forecast to 2031
The global spatial genomics & transcriptomics market is expected to reach $3.23 billion by 2031 at a CAGR of 27.8% from 2024 to 2031.
Succeeding extensive secondary and primary research and in-depth analysis of the market scenario, the report comprises the analysis of key industry drivers, restraints, challenges, and opportunities. The growth of the spatial genomics market is driven by the increasing applications of spatial genomics in drug discovery & development, the growing use of spatial genomics in cancer research, advancements in Next-generation Sequencing (NGS), the increasing use of spatial genomics in biomarker detection, and the rising prevalence of cancer. However, the lack of standardized approaches in genomics and concerns over the security & privacy of genomic data restrain the growth of this market.
Furthermore, the rising adoption of personalized medicines and gene therapies and increasing investments in spatial genomics are expected to generate growth opportunities for the players operating in this market. However, complexities in data analysis and slow technology adoption are major challenges impacting market growth.
The report offers a competitive landscape based on an extensive assessment of the product portfolio offerings, geographic presences, and key strategic developments adopted by leading market players in the industry over the years (2020-2024). The key players operating in the global spatial genomics & transcriptomics market are NanoString Technologies, Inc. (U.S.), 10X Genomics, Inc. (U.S.), Illumina, Inc. (U.S.), Oxford Nanopore Technologies Plc. (U.K.), Akoya Biosciences, Inc. (U.S.), Revvity, Inc. (U.S.), S2 Genomics, Inc. (U.S.), Cantata Bio (U.S.), Vizgen Inc. (U.S.), Biospyder Technologies Inc. (U.S.), and Resolve Biosciences GmbH (Germany).
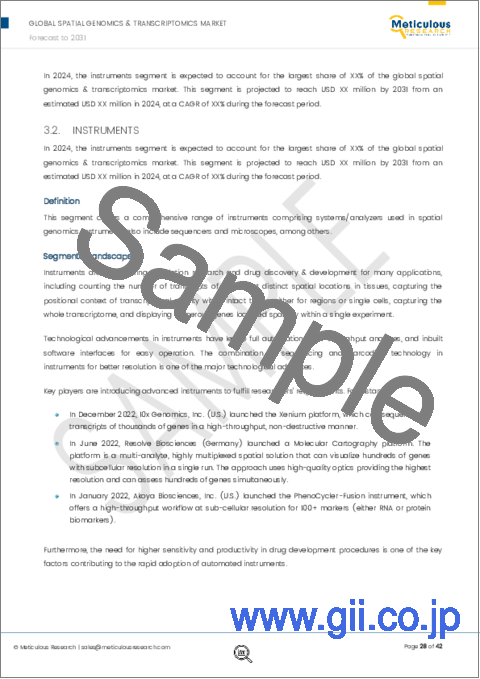
Among all the offerings studied in this report, the instruments segment is projected to register the highest CAGR during the forecast period. The use of instruments to profile the tumor microenvironment and the adoption of spatial transcriptomics in academics and research laboratories for drug and translational research are positively impacting the demand for instruments used in spatial genomics. Additionally, product launches by key market players support market growth. For instance, in December 2022, 10X Genomics, Inc. (U.S.) launched a Xenium Analyzer for subcellular in situ profiling.
Among all the types studied in this report, in 2024, the transcriptomics segment is expected to account for the largest share of the spatial genomics & transcriptomics market. The largest share of the segment is attributed to the increasing use of spatial transcriptomics to provide a complete roadmap of transcriptional activity within whole tissue sections required in translational research. Additionally, increasing acceptance of spatial transcriptomic technology for the identification of cellular components is driving the market growth.
Among all the technologies studied in this report, the sequencing-based segment is projected to register the highest CAGR during the forecast period. The growth of the segment is attributed to the NGS platforms offering superior sequencing capacity at substantially reduced costs, owing to which the use of NGS has increased in genomic studies to produce massive genomic sequencing data. Additionally, high throughput, low cost, individual characterization of cells, and analysis of multiple targets drive the market growth.
Among all the applications studied in this report, in 2024, the oncology segment is expected to account for the largest share of the spatial genomics & transcriptomics market. Increasing applications of spatial genomics & transcriptomics in tumor biology, such as the study of tumor heterogeneity, detecting the presence of infiltrating immune cells, and insights into tumor microenvironment, are contributing to the largest share of the segment. Additionally, the product launches by key market players are supporting the largest market share. For instance, in April 2023, Akoya Biosciences (U.S.) launched PhenoCode Discovery Panels for the advancements in cancer research.
Among all the end users studied in this report, the pharmaceutical & biotechnology companies segment is expected to grow at the highest CAGR during the forecast period. The growth is attributed to the increasing research & development by pharmaceutical & biotechnology companies, the rising utilization of spatial genomics assays for research processes, and an increasing number of biotechnology companies. Moreover, the rising incidence of chronic diseases has accelerated the need to expedite drug development processes, further propelling the adoption of spatial genomics among pharmaceutical companies.
An in-depth analysis of the geographical scenario of the global spatial genomics & transcriptomics market provides detailed qualitative and quantitative insights into the five major geographies (North America, Europe, Asia-Pacific, Latin America, and the Middle East & Africa) along with the coverage of major countries in each region. In 2024, North America is expected to account for the largest share of the spatial genomics & transcriptomics market. North America holds the predominant share in the region, largely due to its multitude of esteemed research institutions, universities, and organizations committed to genomics research. The region has played a pivotal role in advancing cancer genomics, driven by substantial investments in pharmaceutical research and development and the significant presence of key industry players. For instance, R&D spending by pharmaceutical companies in Canada for drug discovery has increased, driving the demand for spatial genomics. For instance, in 2020, total R&D expenditure in Canada's pharmaceutical sector was estimated at between USD 1.8 billion and USD 2.4 billion, compared to USD 1.6 billion and USD 2.2 billion in 2019
Scope of the Report:
Spatial Genomics Market Assessment, by Offering
- Instruments
- Consumables
- Software & Services
Spatial Genomics Market Assessment, by Type
- Transcriptomics
- Genomics
Spatial Genomics Market Assessment, by Technology
- Imaging Based
- Sequencing Based
Spatial Genomics Market Assessment, by Application
- Oncology
- Neurology
- Other Applications
Note: Other applications consist of infectious diseases and immunology.
Spatial Genomics Market Assessment, by End User
- Pharmaceutical & Biotechnology Companies
- Contract Research Organizations
- Other End Users
Note: Other end users include academic institutes & research centers and agriculture companies.
Spatial Genomics Market Assessment, by Geography
- North America
- U.S.
- Canada
- Europe
- Germany
- U.K.
- France
- Italy
- Spain
- Rest of Europe (RoE)
- Asia-Pacific (APAC)
- China
- Japan
- India
- Rest of Asia-Pacific (RoAPAC)
- Latin America
- Middle East & Africa
TABLE OF CONTENTS
1. Introduction
- 1.1. Market Definition & Scope
- 1.2. Market Ecosystem
- 1.3. Currency & Limitations
- 1.4. Key Stakeholders
2. Research Methodology
- 2.1. Research Approach
- 2.2. Process of Data Collection and Validation
- 2.2.1. Secondary Research
- 2.2.2. Primary Research/Interviews with Key Opinion Leaders of the Industry
- 2.3. Market Sizing and Forecasting
- 2.3.1. Market Size Estimation Approach
- 2.3.2. Growth Forecast Approach
- 2.4. Assumptions for the Study
3. Executive Summary
4. Market Insights
- 4.1. Overview
- 4.2. Factors Affecting Market Growth
- 4.2.1. Impact Analysis of Market Dynamics
- 4.2.1.1. Increasing Applications of Spatial Genomics in Drug Discovery & Development Driving Market Growth
- 4.2.1.2. Lack of Standardization and Concerns Over the Privacy of Genomic Data Limiting the Adoption of Spatial Genomics Products
- 4.2.1.3. Rising Adoption of Personalized Medicines Generating Growth Opportunities for Market Players
- 4.2.1.4. Complexities in Data Analysis to Remain a Major Challenge Impacting Market Growth
- 4.2.2. Factor Analysis
- 4.2.1. Impact Analysis of Market Dynamics
- 4.3. Technology Trends
- 4.3.1. Integration of Artificial Intelligence (AI) in Spatial Genomics
- 4.3.2. Multiplexed Spatial Genomics
- 4.4. Investment and Funding Scenario
- 4.5. Pricing Analysis
- 4.6. Porter's Five Forces Analysis
- 4.6.1. Bargaining Power of Buyers
- 4.6.2. Bargaining Power of Suppliers
- 4.6.3. Threat of Substitutes
- 4.6.4. Threat of New Entrants
- 4.6.5. Degree of Competition
5. Spatial Genomics & Transcriptomics Market Assessment-by Offering
- 5.1. Overview
- 5.2. Instruments
- 5.3. Consumables
- 5.4. Software & Services
6. Spatial Genomics & Transcriptomics Market Assessment-by Type
- 6.1. Overview
- 6.2. Transcriptomics
- 6.3. Genomics
7. Spatial Genomics & Transcriptomics Market Assessment -by Technology
- 7.1. Overview
- 7.2. Imaging Based
- 7.3. Sequencing Based
8. Spatial Genomics & Transcriptomics Market Assessment -by Application
- 8.1. Overview
- 8.2. Oncology
- 8.3. Neurology
- 8.4. Other Applications
9. Spatial Genomics & Transcriptomics Market Assessment -by End User
- 9.1. Overview
- 9.2. Pharmaceutical & Biotechnology Companies
- 9.3. Contract Research Organizations
- 9.4. Other End Users
10. Spatial Genomics & Transcriptomics Market Assessment-by Geography
- 10.1. Overview
- 10.2. North America
- 10.2.1. U.S.
- 10.2.2. Canada
- 10.3. Europe
- 10.3.1. Germany
- 10.3.2. France
- 10.3.3. U.K.
- 10.3.4. Italy
- 10.3.5. Spain
- 10.3.6. Rest of Europe
- 10.4. Asia-Pacific
- 10.4.1. China
- 10.4.2. Japan
- 10.4.3. India
- 10.4.4. Rest of Asia-Pacific
- 10.5. Latin America
- 10.6. Middle East & Africa
11. Competition Analysis
- 11.1. Overview
- 11.2. Key Growth Strategies
- 11.3. Competitive Benchmarking
- 11.4. Competitive Dashboard
- 11.4.1. Industry Leaders
- 11.4.2. Differentiators
- 11.4.3. Vanguards
- 11.4.4. Emerging Companies
- 11.5. Market Share Analysis
- 11.5.1. 10X Genomics, Inc. (U.S.)
- 11.5.2. NanoString Technologies, Inc. (U.S.)
- 11.5.3. Akoya Biosciences, Inc. (U.S.)
12. Company Profiles (Company Overview, Financial Snapshot, Product Portfolio, Strategic Developments, and SWOT Analysis)
- 12.1. 10X Genomics, Inc.
- 12.2. NanoString Technologies, Inc.
- 12.3. Akoya Biosciences, Inc.
- 12.4. Illumina, Inc.
- 12.5. Oxford Nanopore Technologies Plc
- 12.6. Revvity, Inc.
- 12.7. S2 Genomics, Inc.
- 12.8. Cantata Bio
- 12.9. Vizgen Inc.
- 12.10. Biospyder Technologies Inc.
- 12.11 Resolve Biosciences GmbH
(Note: SWOT Analysis of Top 5 Companies is Provided)
13. Appendix
- 13.1. Available Customization
- 13.2. Related Reports