|
|
市場調査レポート
商品コード
1307978
次世代シーケンシング(NGS)インフォマティクス市場:提供別(データ解析、解釈&レポート、ストレージ&コンピューティング、LIMS)アプリケーション別(診断、創薬、精密医療、バイオマーカー探索)エンドユーザー別-2030年までの世界予測Next Generation Sequencing (NGS) Informatics Market by Offering (Data Analysis, Interpretation & Reporting, Storage & Computing, LIMS) Application (Diagnostic, Drug Discovery, Precision Medicine, Biomarker Discovery) End User - Global Forecast to 2030 |
||||||
|
|
|||||||
カスタマイズ可能
|
|||||||


| 次世代シーケンシング(NGS)インフォマティクス市場:提供別(データ解析、解釈&レポート、ストレージ&コンピューティング、LIMS)アプリケーション別(診断、創薬、精密医療、バイオマーカー探索)エンドユーザー別-2030年までの世界予測 |
|
出版日: 2023年07月17日
発行: Meticulous Research
ページ情報: 英文 203 Pages
納期: 即納可能
|

- 全表示
- 概要
- 図表
- 目次
世界のNGSインフォマティクス市場は、2023年から2030年までのCAGR15.4%で、2030年までに43億米ドルに達すると予測されています。
広範な2次調査と1次調査、市場シナリオの詳細な分析を経て、当レポートは主要な市場促進要因・抑制要因・課題・機会の分析から構成されています。NGSインフォマティクス市場の成長は、製薬企業やバイオテクノロジー企業による研究開発投資の増加、がんや遺伝性疾患の有病率の上昇、疾患診断や精密医療におけるNGSの活用の拡大、NGSインフォマティクスソリューションの技術進歩、大規模なゲノムシーケンスプロジェクトを支援する政府の取り組みが原動力となっています。しかし、データの機密性に関する懸念がこの市場の成長を抑制しています。
病院や臨床検査室におけるNGSインフォマティクス・ツールの採用の増加、大規模なデータ解析と解釈のためのバイオインフォマティクスとゲノムデータ管理ソリューションの利用の拡大は、NGSインフォマティクス市場で事業を展開するプレーヤーに成長機会をもたらすと期待されています。しかし、NGSインフォマティクスツールの操作に必要な熟練した専門家の不足が、市場成長の大きな課題となっています。
目次
第1章 イントロダクション
第2章 調査手法
第3章 エグゼクティブサマリー
第4章 市場洞察
- 市場
- 概要
- 市場成長への影響要因
- 市場力学の影響分析
- 要因分析
- 使用事例
- ポーターのファイブフォース分析
- 次世代シーケンシング(NGS)インフォマティクス市場:規制分析
第5章 次世代シーケンシング(NGS)インフォマティクス市場:オファリング別評価
- 概要
- ソフトウェア
- タイプ別
- データ解析ソフトウェア
- データ解釈およびレポーティングツール
- データ保存と計算ツール
- ラボ情報管理システム(LIMS)
- 展開モード別
- ウェブおよびクラウドベース
- オンプレミス
- タイプ別
- NGSインフォマティクスサービス
第6章 次世代シーケンシング(NGS)インフォマティクス市場の用途別評価
- 概要
- 創薬
- 疾患診断
- バイオマーカー探索
- 精密医療
- 農業および動物研究
第7章 次世代シーケンシング(NGS)インフォマティクス市場のエンドユーザー別評価
- 概要
- 製薬・バイオテクノロジー企業
- 病院・診断研究所
- 学術・研究機関
- その他のエンドユーザー
第8章 次世代シーケンシング(NGS)インフォマティクス市場の地域別評価
- 概要
- 北米
- 米国
- カナダ
- 欧州
- ドイツ
- フランス
- 英国
- イタリア
- スペイン
- その他欧州(RoE)
- アジア太平洋
- 中国
- 日本
- インド
- その他アジア太平洋地域(RoAPAC)
- ラテンアメリカ
- ブラジル
- メキシコ
- その他ラテンアメリカ
- 中東・アフリカ
第9章 競合分析
- 概要
- 主要成長戦略
- 競合ベンチマーキング
- 市場シェア分析(2022年)
- Illumina, Inc.(U.S.)
- Qiagen N.V.(Netherlands)
- Thermo Fisher Scientific Inc.(U.S.)
- Agilent Technologies, Inc.(U.S.)
- F. Hoffmann-La Roche Ltd(Switzerland)
- ベンダーダッシュボード
- 業界リーダー
- 市場の差別化要因
- 先行企業
- 新興企業
第10章 企業プロファイル(事業概要、財務概要、製品ポートフォリオ、上位5社のSWOT分析、戦略的展開)
- Thermo Fisher Scientific, Inc.
- Illumina, Inc.
- QIAGEN N.V.
- F. Hoffmann-La Roche Ltd
- Agilent Technologies, Inc.
- DNAnexus, Inc.
- Partek Incorporated
- Fabric Genomics, Inc.
- DNASTAR, Inc.
- Sapio Sciences, LLC
第11章 付録
List of Tables
- Table 1 Global NGS Informatics Market: Impact Analysis of Market Dynamics (2023-2030)
- Table 2 Estimated Number of New Cancer Cases, by Type (2020 VS. 2030)
- Table 3 Common Genetic Disorders: Rates of Occurrence
- Table 4 NGS Informatics: Standards and Compliance Guidelines
- Table 5 Global NGS Informatics Market, by Offering, 2021-2030 (USD Million)
- Table 6 Global NGS Informatics Software Market, by Type, 2021-2030 (USD Million)
- Table 7 Global NGS Informatics Software Market, by Country/Region, 2021-2030 (USD Million)
- Table 8 Global NGS Data Analysis Software Market, by Country/Region, 2021-2030 (USD Million)
- Table 9 Global NGS Data Interpretation and Reporting Tools Market, by Country/Region, 2021-2030 (USD Million)
- Table 10 Global NGS Data Storage and Computing Tools Market, by Country/Region, 2021-2030 (USD Million)
- Table 11 Global NGS Laboratory Information Management Systems (LIMS) Market by Country/Region, 2021-2030 (USD Million)
- Table 12 Global NGS Informatics Software Market, by Deployment Mode, 2021-2030 (USD Million)
- Table 13 Global Web and Cloud-Based NGS Informatics Software Market, by Country/Region, 2021-2030 (USD Million)
- Table 14 Global On-premise NGS Informatics Software Market, by Country/Region, 2021-2030 (USD Million)
- Table 15 Global NGS Informatics Services Market, by Country/Region, 2021-2030 (USD Million)
- Table 16 Global NGS Informatics Market, by Application, 2021-2030 (USD Million)
- Table 17 Global NGS Informatics Market for Drug Discovery, by Country/Region, 2021-2030 (USD Million)
- Table 18 Global NGS Informatics Market for Disease Diagnoses, by Country/Region, 2021-2030 (USD Million)
- Table 19 Currently Available Targeted Therapies and Corresponding Biomarkers
- Table 20 Global NGS Informatics Market for Biomarker Discovery, by Country/Region, 2021-2030 (USD Million)
- Table 21 Global NGS Informatics Market for Precision Medicine, by Country/Region, 2021-2030 (USD Million)
- Table 22 Global NGS Informatics Market for Agriculture & Animal Research, by Country/Region, 2021-2030 (USD Million)
- Table 23 Global NGS Informatics Market, by End User, 2021-2030 (USD Million)
- Table 24 Global NGS Informatics Market for Pharmaceutical & Biotechnology Companies, by Country/Region, 2021-2030 (USD Million)
- Table 25 Global NGS Informatics Market for Hospitals & Diagnostic Laboratories, by Country/Region, 2021-2030 (USD Million)
- Table 26 Global NGS Informatics Market for Academic & Research Institutes, by Country/Region, 2021-2030 (USD Million)
- Table 27 Global NGS Informatics Market for Other End Users, by Country/Region, 2021-2030 (USD Million)
- Table 28 Global NGS Informatics Market, by Country/Region, 2021-2030 (USD Million)
- Table 29 North America: NGS Informatics Market, by Country, 2021-2030 (USD Million)
- Table 30 North America: NGS Informatics Market, by Offering , 2021-2030 (USD Million)
- Table 31 North America: NGS Informatics Software Market, by Type, 2021-2030 (USD Million)
- Table 32 North America: NGS Informatics Software Market, by Deployment Mode, 2021-2030 (USD Million)
- Table 33 North America: NGS Informatics Market, by Application, 2021-2030 (USD Million)
- Table 34 North America: NGS Informatics Market, by End User, 2021-2030 (USD Million)
- Table 35 U.S.: Key Macro & Microindicators
- Table 36 U.S.: NGS Informatics Market, by Offering , 2021-2030 (USD Million)
- Table 37 U.S.: NGS Informatics Software Market, by Type, 2021-2030 (USD Million)
- Table 38 U.S.: NGS Informatics Software Market, by Deployment Mode, 2021-2030 (USD Million)
- Table 39 U.S.: NGS Informatics Market, by Application, 2021-2030 (USD Million)
- Table 40 U.S.: NGS Informatics Market, by End User, 2021-2030 (USD Million)
- Table 41 Canada: Key Macro & Micro Indicators
- Table 42 Canada: NGS Informatics Market, by Offering , 2021-2030 (USD Million)
- Table 43 Canada: NGS Informatics Software Market, by Type, 2021-2030 (USD Million)
- Table 44 Canada: NGS Informatics Software Market, by Deployment Mode, 2021-2030 (USD Million)
- Table 45 Canada: NGS Informatics Market, by Application, 2021-2030 (USD Million)
- Table 46 Canada: NGS Informatics Market, by End User, 2021-2030 (USD Million)
- Table 47 Europe: NGS Informatics Market, by Country, 2021-2030 (USD Million)
- Table 48 Europe: NGS Informatics Market, by Offering , 2021-2030 (USD Million)
- Table 49 Europe: NGS Informatics Software Market, by Type, 2021-2030 (USD Million)
- Table 50 Europe: NGS Informatics Software Market, by Deployment Mode, 2021-2030 (USD Million)
- Table 51 Europe: NGS Informatics Market, by Application, 2021-2030 (USD Million)
- Table 52 Europe: NGS Informatics Market, by End User, 2021-2030 (USD Million)
- Table 53 Germany: Key Macro & Micro Indicators
- Table 54 Germany: NGS Informatics Market, by Offering , 2021-2030 (USD Million)
- Table 55 Germany: NGS Informatics Software Market, by Type, 2021-2030 (USD Million)
- Table 56 Germany: NGS Informatics Software Market, by Deployment Mode, 2021-2030 (USD Million)
- Table 57 Germany: NGS Informatics Market, by Application, 2021-2030 (USD Million)
- Table 58 Germany: NGS Informatics Market, by End User, 2021-2030 (USD Million)
- Table 59 France: Key Macro & Indicators
- Table 60 France: NGS Informatics Market, by Offering , 2021-2030 (USD Million)
- Table 61 France: NGS Informatics Software Market, by Type, 2021-2030 (USD Million)
- Table 62 France: NGS Informatics Software Market, by Deployment Mode, 2021-2030 (USD Million)
- Table 63 France: NGS Informatics Market, by Application, 2021-2030 (USD Million)
- Table 64 France: NGS Informatics Market, by End User, 2021-2030 (USD Million)
- Table 65 U.K.: Key Macro & Micro Indicators
- Table 66 U.K.: NGS Informatics Market, by Offering , 2021-2030 (USD Million)
- Table 67 U.K.: NGS Informatics Software Market, by Type, 2021-2030 (USD Million)
- Table 68 U.K.: NGS Informatics Software Market, by Deployment Mode, 2021-2030 (USD Million)
- Table 69 U.K.: NGS Informatics Market, by Application, 2021-2030 (USD Million)
- Table 70 U.K.: NGS Informatics Market, by End User, 2021-2030 (USD Million)
- Table 71 Italy: Key Macro & Micro Indicators
- Table 72 Italy: NGS Informatics Market, by Offering , 2021-2030 (USD Million)
- Table 73 Italy: NGS Informatics Software Market, by Type, 2021-2030 (USD Million)
- Table 74 Italy: NGS Informatics Software Market, by Deployment Mode, 2021-2030 (USD Million)
- Table 75 Italy: NGS Informatics Market, by Application, 2021-2030 (USD Million)
- Table 76 Italy: NGS Informatics Market, by End User, 2021-2030 (USD Million)
- Table 77 Spain: Key Macro & Micro Indicators
- Table 78 Spain: NGS Informatics Market, by Offering , 2021-2030 (USD Million)
- Table 79 Spain: NGS Informatics Software Market, by Type, 2021-2030 (USD Million)
- Table 80 Spain: NGS Informatics Software Market, by Deployment Mode, 2021-2030 (USD Million)
- Table 81 Spain: NGS Informatics Market, by Application, 2021-2030 (USD Million)
- Table 82 Spain: NGS Informatics Market, by End User, 2021-2030 (USD Million)
- Table 83 Estimated Number of New Cancer Cases, by Country, 2020 VS. 2030
- Table 84 Rest of Europe: NGS Informatics Market, by Offering , 2021-2030 (USD Million)
- Table 85 Rest of Europe: NGS Informatics Software Market, by Type, 2021-2030 (USD Million)
- Table 86 Rest of Europe: NGS Informatics Software Market, by Deployment Mode, 2021-2030 (USD Million)
- Table 87 Rest of Europe: NGS Informatics Market, by Application, 2021-2030 (USD Million)
- Table 88 Rest of Europe: NGS Informatics Market, by End User, 2021-2030 (USD Million)
- Table 89 Asia-Pacific: NGS Informatics Market, by Country/Region, 2021-2030 (USD Million)
- Table 90 Asia-Pacific: NGS Informatics Market, by Offering , 2021-2030 (USD Million)
- Table 91 Asia-Pacific: NGS Informatics Software Market, by Type, 2021-2030 (USD Million)
- Table 92 Asia-Pacific: NGS Informatics Software Market, by Deployment Mode, 2021-2030 (USD Million)
- Table 93 Asia-Pacific: NGS Informatics Market, by Application, 2021-2030 (USD Million)
- Table 94 Asia-Pacific: NGS Informatics Market, by End User, 2021-2030 (USD Million)
- Table 95 China: Key Macro & Micro Indicators
- Table 96 China: NGS Informatics Market, by Offering , 2021-2030 (USD Million)
- Table 97 China: NGS Informatics Software Market, by Type, 2021-2030 (USD Million)
- Table 98 China: NGS Informatics Software Market, by Deployment Mode, 2021-2030 (USD Million)
- Table 99 China: NGS Informatics Market, by Application, 2021-2030 (USD Million)
- Table 100 China: NGS Informatics Market, by End User, 2021-2030 (USD Million)
- Table 101 Japan: Key Macro & Micro Indicators
- Table 102 Japan: NGS Informatics Market, by Offering, 2021-2030 (USD Million)
- Table 103 Japan: NGS Informatics Software Market, by Type, 2021-2030 (USD Million)
- Table 104 Japan: NGS Informatics Software Market, by Deployment Mode, 2021-2030 (USD Million)
- Table 105 Japan: NGS Informatics Market, by Application, 2021-2030 (USD Million)
- Table 106 Japan: NGS Informatics Market, by End User, 2021-2030 (USD Million)
- Table 107 India: Key Macro & Micro Indicators
- Table 108 India: NGS Informatics Market, by Offering , 2021-2030 (USD Million)
- Table 109 India: NGS Informatics Software Market, by Type, 2021-2030 (USD Million)
- Table 110 India: NGS Informatics Software Market, by Deployment Mode, 2021-2030 (USD Million)
- Table 111 India: NGS Informatics Market, by Application, 2021-2030 (USD Million)
- Table 112 India: NGS Informatics Market, by End User, 2021-2030 (USD Million)
- Table 113 Estimated Number of New Cancer Cases, by Country, 2020 VS. 2030
- Table 114 Rest of Asia-Pacific: NGS Informatics Market, by Offering , 2021-2030 (USD Million)
- Table 115 Rest of Asia-Pacific: NGS Informatics Software Market, by Type, 2021-2030 (USD Million)
- Table 116 Rest of Asia-Pacific: NGS Informatics Software Market, by Deployment Mode, 2021-2030 (USD Million)
- Table 117 Rest of Asia-Pacific: NGS Informatics Market, by Application, 2021-2030 (USD Million)
- Table 118 Rest of Asia-Pacific: NGS Informatics Market, by End User, 2021-2030 (USD Million)
- Table 119 Latin America: NGS Informatics Market, by Country/Region, 2021-2030 (USD Million)
- Table 120 Latin America: NGS Informatics Market, by Offering , 2021-2030 (USD Million)
- Table 121 Latin America: NGS Informatics Software Market, by Type, 2021-2030 (USD Million)
- Table 122 Latin America: NGS Informatics Software Market, by Deployment Mode, 2021-2030 (USD Million)
- Table 123 Latin America: NGS Informatics Market, by Application, 2021-2030 (USD Million)
- Table 124 Latin America: NGS Informatics Market, by End User, 2021-2030 (USD Million)
- Table 125 Brazil: Key Macro & Micro Indicators
- Table 126 Brazil: NGS Informatics Market, by Offering , 2021-2030 (USD Million)
- Table 127 Brazil: NGS Informatics Software Market, by Type, 2021-2030 (USD Million)
- Table 128 Brazil: NGS Informatics Software Market, by Deployment Mode, 2021-2030 (USD Million)
- Table 129 Brazil: NGS Informatics Market, by Application, 2021-2030 (USD Million)
- Table 130 Brazil: NGS Informatics Market, by End User, 2021-2030 (USD Million)
- Table 131 Mexico: Key Macro & Micro Indicators
- Table 132 Mexico: NGS Informatics Market, by Offering , 2021-2030 (USD Million)
- Table 133 Mexico: NGS Informatics Software Market, by Type, 2021-2030 (USD Million)
- Table 134 Mexico: NGS Informatics Software Market, by Deployment Mode, 2021-2030 (USD Million)
- Table 135 Mexico: NGS Informatics Market, by Application, 2021-2030 (USD Million)
- Table 136 Mexico: NGS Informatics Market, by End User, 2021-2030 (USD Million)
- Table 137 Rest of Latin America: NGS Informatics Market, by Offering , 2021-2030 (USD Million)
- Table 138 Rest of Latin America: NGS Informatics Software Market, by Type, 2021-2030 (USD Million)
- Table 139 Rest of Latin America: NGS Informatics Software Market, by Deployment Mode, 2021-2030 (USD Million)
- Table 140 Rest of Latin America: NGS Informatics Market, by Application, 2021-2030 (USD Million)
- Table 141 Rest of Latin America: NGS Informatics Market, by End User, 2021-2030 (USD Million)
- Table 142 Middle East & Africa: NGS Informatics Market, by Offering , 2021-2030 (USD Million)
- Table 143 Middle East & Africa: NGS Informatics Software Market, by Type, 2021-2030 (USD Million)
- Table 144 Middle East & Africa: NGS Informatics Software Market, by Deployment Mode, 2021-2030 (USD Million)
- Table 145 Middle East & Africa: NGS Informatics Market, by Application, 2021-2030 (USD Million)
- Table 146 Middle East & Africa: NGS Informatics Market, by End User, 2021-2030 (USD Million)
- Table 147 Recent Developments, by Company, 2020-2023
List of Figures
- Figure 1 Research Process
- Figure 2 Secondary Sources Referenced for This Study
- Figure 3 Primary Research Techniques
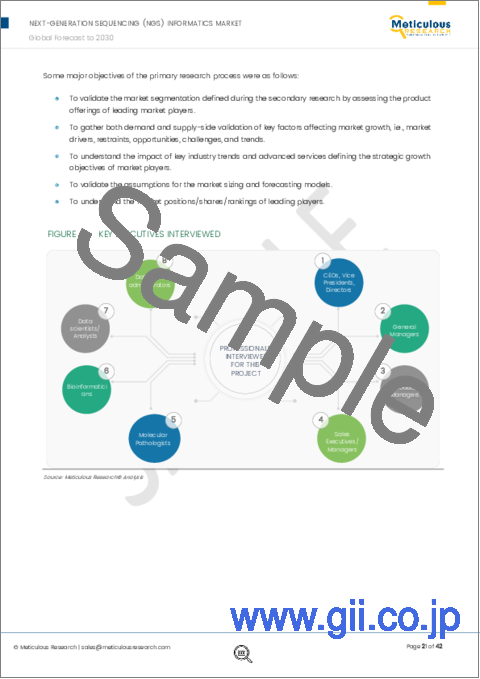
- Figure 4 Key Executives Interviewed
- Figure 5 Breakdown of Primary Interviews (Supply-Side & Demand-Side)
- Figure 6 Market Sizing and Growth Forecast Approach
- Figure 7 Global NGS Informatics Market, by Offering , 2023 VS. 2030 (USD Million)
- Figure 8 Global NGS Informatics Software Market, by Deployment Mode, 2023 VS. 2030 (USD Million)
- Figure 9 Global NGS Informatics Market, by Application, 2023 VS. 2030 (USD Million)
- Figure 10 Global NGS Informatics Market, by End User, 2023 VS. 2030 (USD Million)
- Figure 11 Global NGS Informatics Market Shares, by Geography, 2023
- Figure 12 Pharmaceutical R&D Expenditures in the U.S., Europe, and China, 2010 VS. 2019 VS. 2020 (USD Million)
- Figure 13 Global Pharmaceutical R&D Expenditure, 2012-2026 (USD Billion)
- Figure 14 Porter's Five Forces Analysis
- Figure 15 Global NGS Informatics Market, by offering , 2023 VS. 2030 (USD Million)
- Figure 16 Global NGS Informatics Software Market, by Deployment Mode, 2023 VS. 2030 (USD Million)
- Figure 17 Global NGS Informatics Market, by Application, 2023 VS. 2030 (USD Million)
- Figure 18 Estimated Number of New Cancer Cases (In Million)
- Figure 19 Percentage of FDA Approvals for Personalized Medicine, 2015-2021
- Figure 20 Global NGS Informatics Market, by End User, 2023 VS. 2030 (USD Million)
- Figure 21 Global Pharmaceutical R&D Spending, 2014-2028 (USD Billion)
- Figure 22 Global NGS Informatics Market, by Geography, 2023 VS. 2030 (USD Million)
- Figure 23 North America: NGS Informatics Market Snapshot
- Figure 24 U.S.: Pharmaceutical R&D Expenditure, 2014-2021 (USD Billion)
- Figure 25 Europe: Pharmaceutical Industry R&D Expenditure (2000-2021)
- Figure 26 Europe: NGS Informatics Market Snapshot
- Figure 27 Italy: Number of Biotechnology Firms, 2010-2021
- Figure 28 RoE: Pharmaceutical R&D Expenditure, 2020
- Figure 29 Asia-Pacific: NGS Informatics Market Snapshot
- Figure 30 Latin America: NGS Informatics Market Snapshot
- Figure 31 Key Growth Strategies Adopted by Leading Players (2020-2023)
- Figure 32 Next Generation Sequencing (NGS) Informatics Market: Competitive Benchmarking, by Offering
- Figure 33 Next Generation Sequencing (NGS) Informatics Market: Competitive Benchmarking, by Region
- Figure 34 Global Next Generation Sequencing (NGS) Informatics Market Share Analysis, by Key Players, 2022 (%)
- Figure 35 Vendor Dashboard: Next Generation Sequencing (NGS) Informatics Market
- Figure 36 Thermo Fisher Scientific, Inc.: Financial Overview (2022)
- Figure 37 Illumina, Inc.: Financial Overview (2022)
- Figure 38 QIAGEN N.V.: Financial Overview (2022)
- Figure 39 F. Hoffmann-La Roche Ltd: Financial Overview (2022)
- Figure 40 Agilent Technologies, Inc.: Financial Overview (2022)
The global NGS informatics market is projected to reach $4.3 billion by 2030, at a CAGR of 15.4% from 2023 to 2030.
Succeeding extensive secondary and primary research and in-depth analysis of the market scenario, the report comprises the analysis of key industry drivers, restraints, challenges, and opportunities. The growth of the NGS informatics market is driven by increasing R&D investments by pharmaceutical and biotechnology companies, the rising prevalence of cancer and genetic disorders, the growing utilization of NGS in disease diagnostics and precision medicine, technological advancements in NGS informatics solutions, and government initiatives supporting large-scale genomic sequencing projects. However, data confidentiality concerns restrain the growth of this market.
The increasing adoption of NGS informatics tools among hospitals and clinical laboratories and the growing use of bioinformatics and genomic data management solutions for large-scale data analysis and interpretation are expected to create growth opportunities for the players operating in the NGS informatics market. However, the lack of skilled professionals required to operate NGS Informatics tools is a major challenge for market growth.
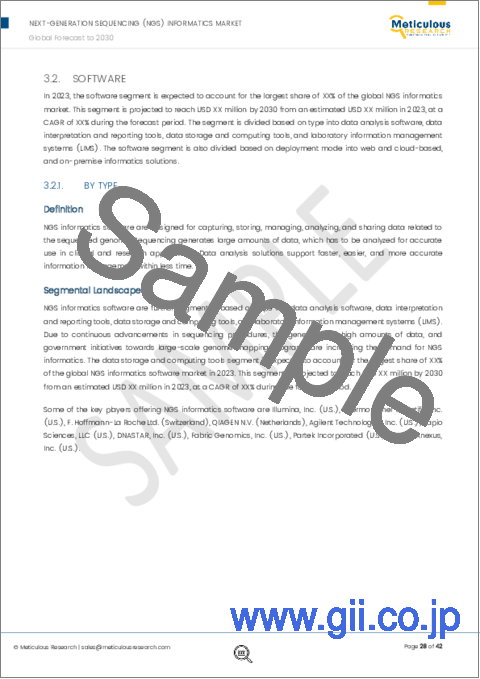
Based on offering, in 2023, the software segment is expected to account for the largest share of the market. NGS informatics software enables researchers to efficiently analyze, store, and securely share vast amounts of genomic data. With their cost and time-saving capabilities, robust data security measures, and seamless collaboration features, these software solutions enable effective genomic data management, contributing to the large market share of this segment.
Based on application, in 2023, the drug discovery segment is expected to account for the largest share of the market. The growth of this segment is driven by the benefits offered by NGS technology in drug discovery. NGS enables the identification of novel drug targets and the development of therapeutic techniques that target specific genes and proteins, including targeted therapies, gene therapy, and oligonucleotide therapy.
Based on end user, in 2023, the pharmaceutical & biotechnology companies segment is expected to account for the largest share of the next generation sequencing (NGS) informatics market. Pharmaceutical & biotechnology companies extensively utilize NGS for high-throughput analysis and genetic-based drug development. The adoption of NGS informatics has enabled efficient management, analysis, and reporting of large volumes of genomic data, thereby supporting remote work and enhancing research capabilities. These factors contribute to the significant market share of this segment.
An in-depth analysis of the geographical scenario of the global NGS informatics market provides detailed qualitative and quantitative insights about the five major geographies (North America, Europe, Asia-Pacific, Latin America, and the Middle East & Africa) along with the coverage of major countries in each region. In 2023, North America is expected to account for the largest share of the NGS informatics market, followed by Europe, Asia-Pacific, Latin America, and the Middle East & Africa. The factors supporting the largest share of this market are technological advancements in the region, the increasing prevalence of cancer, and increased healthcare care spending. Additionally, the presence of key players, well-established healthcare infrastructure, and government initiatives for NGS-based diagnostic testing also contribute to the large market share of North America.
The key players operating in the global NGS market are Illumina, Inc. (U.S.), Thermo Fisher Scientific Inc. (U.S.), F. Hoffmann-La Roche Ltd. (Switzerland), Qiagen N.V. (Netherlands), Agilent Technologies, Inc. (U.S.), Sapio Sciences, LLC (U.S.), DNASTAR, Inc. (U.S.), Fabric Genomics, Inc. (U.S.), Partek Incorporated (U.S.), and DNAnexus, Inc. (U.S.).
Scope of the Report:
Next Generation Sequencing (NGS) Informatics Market Assessment-by Offering
- Software
- By Type,
- Data Analysis Software
- Data Interpretation and Reporting Tools
- Data Storage and Computing Tools
- Laboratory Information Management Systems (LIMS)
- By Deployment mode,
- Web and Cloud-based
- On-premise
- NGS Informatics Services
Next Generation Sequencing (NGS) Informatics Market Assessment-by Application
- Disease Diagnoses
- Biomarker Discovery
- Drug Discovery
- Precision Medicine
- Agriculture and Animal Research
Next Generation Sequencing (NGS) Informatics Market Assessment-by End User
- Pharmaceutical and Biotechnology Companies
- Hospitals & Diagnostic Laboratories
- Academic & Research Institutes
- Other End Users
Note: Other end users include forensic laboratories & security agencies, food and beverage companies, and agriculture companies.
Next Generation Sequencing (NGS) Informatics Market Assessment-by Geography
- North America
- U.S.
- Canada
- Europe
- Germany
- France
- Italy
- U.K.
- Spain
- Rest of Europe
- Asia-Pacific
- China
- Japan
- India
- Rest of Asia-Pacific
- Latin America
- Brazil
- Mexico
- Rest of Latin America
- Middle East & Africa
TABLE OF CONTENTS
1. Introduction
- 1.1. Market Definition & Scope
- 1.2. Market Ecosystem
- 1.3. Currency and Limitation
- 1.4. Key Stakeholders
2. Research Methodology
- 2.1. Research Approach
- 2.2. Process of Data Collection and Validation
- 2.2.1. Secondary Research
- 2.2.2. Primary Research/Interviews with Key Opinion Leaders of The Industry
- 2.3. Market Sizing and forecast
- 2.3.1. Market Size Estimation Approach
- 2.3.2. Growth Forecast Approach
- 2.3.3. Market Share Analysis
- 2.4. Assumptions for the Study
3. Executive Summary
4. Market Insights
- 4.1. Overview
- 4.2. Factors Affecting Market Growth
- 4.2.1. Impact Analysis of Market Dynamics
- 4.2.2. Factor Analysis
- 4.3. Use Cases
- 4.3.1. Use Case A
- 4.3.2. Use Case B
- 4.3.3. Use Case C
- 4.3.4. Use Case D
- 4.3.5. Use Case E
- 4.4. Porter's Five Forces Analysis
- 4.4.1. Bargaining Power of Buyers
- 4.4.2. Bargaining Power of Suppliers
- 4.4.3. Threat of Substitutes
- 4.4.4. Threat of New Entrants
- 4.4.5. Degree of Competition
- 4.5. Next-Generation Sequencing (NGS) Informatics Market: Regulatory Analysis
5. Next Generation Sequencing (NGS) Informatics Market Assessment-by Offering
- 5.1. Overview
- 5.2. Software
- 5.2.1. By Type
- 5.2.1.1. Data Analysis Software
- 5.2.1.2. Data Interpretation and Reporting Tools
- 5.2.1.3. Data Storage and Computing Tools
- 5.2.1.4. Laboratory Information Management Systems (LIMS)
- 5.2.2. By Deployment Mode
- 5.2.2.1. Web and Cloud-Based
- 5.2.2.2. On-Premise
- 5.2.1. By Type
- 5.3. NGS Informatics Services
6. Next-Generation Sequencing (NGS) Informatics Market Assessment-by Application
- 6.1. Overview
- 6.2. Drug Discovery
- 6.3. Disease Diagnoses
- 6.4. Biomarker Discovery
- 6.5. Precision Medicine
- 6.6. Agriculture and Animal Research
7. Next-Generation Sequencing (NGS) Informatics Market Assessment-by End User
- 7.1. Overview
- 7.2. Pharmaceutical & Biotechnology Companies
- 7.3. Hospitals & Diagnostic Laboratories
- 7.4. Academic & Research Institutes
- 7.5. Other End Users
8. Next-Generation Sequencing Informatics (NGS) Market Assessment-by Geography
- 8.1. Overview
- 8.2. North America
- 8.2.1. U.S.
- 8.2.2. Canada
- 8.3. Europe
- 8.3.1. Germany
- 8.3.2. France
- 8.3.3. U.K.
- 8.3.4. Italy
- 8.3.5. Spain
- 8.3.6. Rest of Europe (RoE)
- 8.4. Asia-Pacific
- 8.4.1. China
- 8.4.2. Japan
- 8.4.3. India
- 8.4.4. Rest of Asia-Pacific (RoAPAC)
- 8.5. Latin America
- 8.5.1. Brazil
- 8.5.2. Mexico
- 8.5.3. Rest of Latin America
- 8.6. Middle East & Africa
9. Competition Analysis
- 9.1. Overview
- 9.2. Key Growth Strategies
- 9.3. Competitive Benchmarking
- 9.4. Market Share Analysis (2022)
- 9.4.1. Illumina, Inc. (U.S.)
- 9.4.2. Qiagen N.V. (Netherlands)
- 9.4.3. Thermo Fisher Scientific Inc. (U.S.)
- 9.4.4. Agilent Technologies, Inc. (U.S.)
- 9.4.5. F. Hoffmann-La Roche Ltd (Switzerland)
- 9.5. Vendor Dashboard
- 9.5.1. Industry Leaders
- 9.5.2. Market Differentiators
- 9.5.3. Vanguards
- 9.5.4. Emerging Companies
10. Company Profiles (Business Overview, Financial Overview, Product Portfolio, SWOT Analysis of Top 5 Companies, and Strategic Developments)
- 10.1. Thermo Fisher Scientific, Inc.
- 10.2. Illumina, Inc.
- 10.3. QIAGEN N.V.
- 10.4. F. Hoffmann-La Roche Ltd
- 10.5. Agilent Technologies, Inc.
- 10.6. DNAnexus, Inc.
- 10.7. Partek Incorporated
- 10.8. Fabric Genomics, Inc.
- 10.9. DNASTAR, Inc.
- 10.10. Sapio Sciences, LLC
11. Appendix
- 11.1. Available Customization
- 11.2. Related Reports