|
|
市場調査レポート
商品コード
1292889
栄養補助食品市場:タイプ別、原料別、流通チャネル別、地域別-2030年までの予測Nutraceutical Products Market by Type (Functional Food {Confectionery Products, Dairy Products}, Functional Beverages, Dietary Supplements), Source (Vitamin, Mineral), Distribution Channel (Specialty Stores, E-commerce)-Global Forecast to 2030 |
||||||
|
|
|||||||
|
● お客様のご希望に応じて、既存データの加工や未掲載情報(例:国別セグメント)の追加などの対応が可能です。 詳細はお問い合わせください。 |
|||||||


| 栄養補助食品市場:タイプ別、原料別、流通チャネル別、地域別-2030年までの予測 |
|
出版日: 2023年06月15日
発行: Meticulous Research
ページ情報: 英文 296 Pages
納期: 即納可能
|
- 全表示
- 概要
- 図表
- 目次
世界の栄養補助食品の市場規模は、予測期間の2023年~2030年にかけて7.8%のCAGRで拡大し、6,918億7,000万米ドルに達すると予測されています。
当レポートでは、世界の栄養補助食品市場について調査し、市場の現状とともに、タイプ別、原料別、流通チャネル別、地域別の動向、および市場に参入する企業のプロファイルなどを提供しています。
目次
第1章 市場の定義と範囲
第2章 調査手法
第3章 エグゼクティブサマリー
第4章 市場洞察
- 概要
- 促進要因
- 抑制要因
- 機会
- 課題
- 動向
第5章 栄養補助食品市場評価- タイプ別
- 概要
- 機能性食品
- 機能性飲料
- 栄養補助食品
第6章 栄養補助食品市場評価- 原料別
- 概要
- ビタミン
- プロバイオティクス
- ミネラル
- タンパク質とアミノ酸
- オメガ3脂肪酸
- プレバイオティクス
- ファイトケミカルと植物エキス
- 繊維と特殊炭水化物
- その他
第7章 栄養補助食品市場評価- 流通チャネル別
- 概要
- スーパーマーケットとハイパーマーケット
- コンビニエンスストア
- 薬局・ドラッグストア
- 専門店
- eコマース
- その他
第8章 栄養補助食品市場評価-地域別
- 概要
- 北米
- 欧州
- アジア太平洋
- ラテンアメリカ
- 中東・アフリカ
第9章 競合分析
- 概要
- 主要な成長戦略
- 競争力ダッシュボード
- ベンダーの市場ポジショニング
第10章 企業プロファイル
- Abbott Laboratories
- Amway Corporation
- Conagra Brands, Inc.
- Danone S.A.
- General Mills Inc.
- Glanbia plc
- Herbalife Nutrition, Ltd.
- International Flavors & Fragrances Inc.
- Kellogg Company
- Nestle S.A.
- PepsiCo, Inc.
- The Coca-Cola Company
- Hearthside Food Solutions LLC
- Mars, Incorporated
- Meiji Holdings Co., Ltd.
- Royal FrieslandCampina N.V.
第11章 付録
List of Tables
- Table 1 Price Difference Between Processed Functional Foods and Conventional Processed Foods, 2019 (USD)
- Table 2 Global Nutraceutical Products Market, by Type, 2021-2030 (USD Million)
- Table 3 Global Functional Food Market, by Type, 2021-2030 (USD Million)
- Table 4 Global Functional Food Market, by Country/Region, 2021-2030 (USD Million)
- Table 5 Global Functional Dairy Products Market, by Country/Region, 2021-2030 (USD Million)
- Table 6 Global Functional Bakery Products Market, by Country/Region, 2021-2030 (USD Million)
- Table 7 Global Functional Snacks Market, by Country/Region, 2021-2030 (USD Million)
- Table 8 Global Functional Confectionery Products Market, by Country/Region, 2021-2030 (USD Million)
- Table 9 Global Infant Food Products Market, by Country/Region, 2021-2030 (USD Million)
- Table 10 Other Functional Food Market, by Country/Region, 2021-2030 (USD Million)
- Table 11 Global Functional Beverages Market, by Type, 2021-2030 (USD Million)
- Table 12 Global Functional Beverages Market, by Country/Region, 2021-2030 (USD Million)
- Table 13 Global Energy Drinks Market, by Country/Region, 2021-2030 (USD Million)
- Table 14 Global Sports Drinks Market, by Country/Region, 2021-2030 (USD Million)
- Table 15 Global Fortified Juices Market, by Country/Region, 2021-2030 (USD Million)
- Table 16 Global Dairy-based Beverages Market, by Country/Region, 2021-2030 (USD Million)
- Table 17 Other Functional Beverages Market, by Country/Region, 2021-2030 (USD Million)
- Table 18 Global Dietary Supplements Market, by Type, 2021-2030 (USD Million)
- Table 19 Global Dietary Supplement Market, by Country/Region, 2021-2030 (USD Million)
- Table 20 Global Dietary Supplement Tablets Market, by Country/Region, 2021-2030 (USD Million)
- Table 21 Global Dietary Supplement Capsules Market, by Country/Region, 2021-2030 (USD Million)
- Table 22 Global Powder Form Dietary Supplements Market, by Country/Region, 2021-2030 (USD Million)
- Table 23 Global Liquid Form Dietary Supplements Market, by Country/Region, 2021-2030 (USD Million)
- Table 24 Other Dietary Supplements Market, by Country/Region, 2021-2030 (USD Million)
- Table 25 Global Nutraceutical Products Market, by Source, 2021-2030 (USD Million)
- Table 26 Global Vitamins-based Nutraceutical Products Market, by Country/Region, 2021-2030 (USD Million)
- Table 27 Global Probiotics-based Nutraceutical Products Market, by Country/Region, 2021-2030 (USD Million)
- Table 28 Global Minerals-based Nutraceutical Products Market, by Country/Region, 2021-2030 (USD Million)
- Table 29 Global Proteins and Amino Acids-based Nutraceutical Products Market, by Country/Region, 2021-2030 (USD Million)
- Table 30 Global Omega-3 Fatty Acids-based Nutraceutical Products Market, by Country/Region, 2021-2030 (USD Million)
- Table 31 Global Prebiotics-based Nutraceutical Products Market, by Country/Region, 2021-2030 (USD Million)
- Table 32 Global Phytochemical & Plant Extracts-based Nutraceutical Products Market, by Country/Region, 2021-2030 (USD Million)
- Table 33 Global Fibers & Specialty Carbohydrates-based Nutraceutical Products Market, by Country/Region, 2021-2030 (USD Million)
- Table 34 Global Other Sources-based Nutraceutical Products Market, by Country/Region, 2021-2030 (USD Million)
- Table 35 Global Nutraceutical Products Market, by Distribution Channel, 2021-2030 (USD Million)
- Table 36 Global Number of Supermarkets and Hypermarkets Stores, 2019 Vs 2023
- Table 37 Global Nutraceutical Products Market for Supermarkets & Hypermarkets, by Country/Region, 2021-2030 (USD Million)
- Table 38 Global Nutraceutical Products Market for Convenience Stores, by Country/Region, 2021-2030 (USD Million)
- Table 39 Global Nutraceutical Products Market for Pharmacies & Drug Stores, by Country/Region, 2021-2030 (USD Million)
- Table 40 Global Nutraceutical Products Market for Specialty Stores, by Country/Region, 2021-2030 (USD Million)
- Table 41 Global Nutraceuticals Product Market for E-commerce, by Country/Region, 2021-2030 (USD Million)
- Table 42 Global Nutraceutical Products Market for Other Distribution Channels, by Country/Region, 2021-2030 (USD Million)
- Table 43 Global Nutraceutical Products Market, by Country/Region, 2021-2030 (USD Million)
- Table 44 North America: Nutraceutical Products Market, by Country, 2021-2030 (USD Million)
- Table 45 North America: Nutraceutical Products Market, by Type, 2021-2030 (USD Million)
- Table 46 North America: Functional Food Market, by Type, 2021-2030 (USD Million)
- Table 47 North America: Functional Beverages Market, by Type, 2021-2030 (USD Million)
- Table 48 North America: Dietary Supplements Market, by Type, 2021-2030 (USD Million)
- Table 49 North America: Nutraceutical Products Market, by Source, 2021-2030 (USD Million)
- Table 50 North America: Nutraceutical Products Market, by Distribution Channel, 2021-2030 (USD Million)
- Table 51 U.S.: Nutraceutical Products Market, by Type, 2021-2030 (USD Million)
- Table 52 U.S.: Functional Food Market, by Type, 2021-2030 (USD Million)
- Table 53 U.S.: Functional Beverages Market, by Type, 2021-2030 (USD Million)
- Table 54 U.S.: Dietary Supplements Market, by Type, 2021-2030 (USD Million)
- Table 55 U.S.: Nutraceutical Products Market, by Source, 2021-2030 (USD Million)
- Table 56 U.S.: Nutraceutical Products Market, by Distribution Channel, 2021-2030 (USD Million)
- Table 57 Canada: Nutraceutical Products Market, by Type, 2021-2030 (USD Million)
- Table 58 Canada: Functional Food Market, by Type, 2021-2030 (USD Million)
- Table 59 Canada: Functional Beverages Market, by Type, 2021-2030 (USD Million)
- Table 60 Canada: Dietary Supplements Market, by Type, 2021-2030 (USD Million)
- Table 61 Canada: Nutraceutical Products Market, by Source, 2021-2030 (USD Million)
- Table 62 Canada: Nutraceutical Products Market, by Distribution Channel, 2021-2030 (USD Million)
- Table 63 Europe: Nutraceutical Products Market, by Country, 2021-2030 (USD Million)
- Table 64 Europe: Nutraceutical Products Market, by Type, 2021-2030 (USD Million)
- Table 65 Europe: Functional Food Market, by Type, 2021-2030 (USD Million) (USD Million)
- Table 66 Europe: Functional Beverages Market, by Type, 2021-2030 (USD Million)
- Table 67 Europe: Nutraceutical Dietary Supplements Market, by Type, 2021-2030 (USD Million)
- Table 68 Europe: Nutraceutical Products Market, by Source, 2021-2030 (USD Million)
- Table 69 Europe: Nutraceutical Products Market, by Distribution Channel, 2021-2030 (USD Million)
- Table 70 U.K.: Nutraceutical Products Market, by Type, 2021-2030 (USD Million)
- Table 71 U.K.: Functional Food Market, by Type, 2021-2030 (USD Million) (USD Million)
- Table 72 U.K.: Functional Beverages Market, by Type, 2021-2030 (USD Million)
- Table 73 U.K.: Nutraceutical Dietary Supplements Market, by Type, 2021-2030 (USD Million)
- Table 74 U.K.: Nutraceutical Products Market, by Source, 2021-2030 (USD Million)
- Table 75 U.K.: Nutraceutical Products Market, by Distribution Channel, 2021-2030 (USD Million)
- Table 76 Germany: Nutraceutical Products Market, by Type, 2021-2030 (USD Million)
- Table 77 Germany: Functional Food Market, by Type, 2021-2030 (USD Million) (USD Million)
- Table 78 Germany: Functional Beverages Market, by Type, 2021-2030 (USD Million)
- Table 79 Germany: Nutraceutical Dietary Supplements Market, by Type, 2021-2030 (USD Million)
- Table 80 Germany: Nutraceutical Products Market, by Source, 2021-2030 (USD Million)
- Table 81 Germany: Nutraceutical Products Market, by Distribution Channel, 2021-2030 (USD Million)
- Table 82 France: Nutraceutical Products Market Size, by Type, 2021-2030 (USD Million)
- Table 83 France: Functional Food Market, by Type, 2021-2030 (USD Million) (USD Million)
- Table 84 France: Functional Beverages Market, by Type, 2021-2030 (USD Million)
- Table 85 France: Nutraceutical Dietary Supplements Market, by Type, 2021-2030 (USD Million)
- Table 86 France: Nutraceutical Products Market Size, by Source, 2021-2030 (USD Million)
- Table 87 France: Nutraceutical Products Market, by Distribution Channel, 2021-2030 (USD Million)
- Table 88 Spain: Nutraceutical Products Market, by Type, 2021-2030 (USD Million)
- Table 89 Spain: Functional Food Market, by Type, 2021-2030 (USD Million) (USD Million)
- Table 90 Spain: Functional Beverages Market, by Type, 2021-2030 (USD Million)
- Table 91 Spain: Nutraceutical Dietary Supplements Market, by Type, 2021-2030 (USD Million)
- Table 92 Spain: Nutraceutical Products Market, by Source, 2021-2030 (USD Million)
- Table 93 Spain: Nutraceutical Products Market, by Distribution Channel, 2021-2030 (USD Million)
- Table 94 Italy: Nutraceutical Products Market Size, by Type, 2021-2030 (USD Million)
- Table 95 Italy: Functional Food Market, by Type, 2021-2030 (USD Million) (USD Million)
- Table 96 Italy: Functional Beverages Market, by Type, 2021-2030 (USD Million)
- Table 97 Italy: Nutraceutical Dietary Supplements Market, by Type, 2021-2030 (USD Million)
- Table 98 Italy: Nutraceutical Products Market, by Source, 2021-2030 (USD Million)
- Table 99 Italy: Nutraceutical Products Market, by Distribution Channel, 2021-2030 (USD Million)
- Table 100 Rest of Europe: Nutraceutical Products Market, by Type, 2021-2030 (USD Million)
- Table 101 Rest of Europe: Functional Food Market, by Type, 2021-2030 (USD Million) (USD Million)
- Table 102 Rest of Europe: Functional Beverages Market, by Type, 2021-2030 (USD Million)
- Table 103 Rest of Europe: Nutraceutical Dietary Supplements Market, by Type, 2021-2030 (USD Million)
- Table 104 Rest of Europe: Nutraceutical Products Market, by Source, 2021-2030 (USD Million)
- Table 105 Rest of Europe: Nutraceutical Products Markets, by Distribution Channel, 2021-2030 (USD Million)
- Table 106 Asia-Pacific: Nutraceutical Products Market, by Country, 2021-2030 (USD Million)
- Table 107 Asia-Pacific: Nutraceutical Products Market, by Type, 2021-2030 (USD Million)
- Table 108 Asia-Pacific: Functional Food Market, by Type, 2021-2030 (USD Million) (USD Million)
- Table 109 Asia-Pacific: Functional Beverages Market, by Type, 2021-2030 (USD Million)
- Table 110 Asia-Pacific: Nutraceutical Dietary Supplements Market, by Type, 2021-2030 (USD Million)
- Table 111 Asia-Pacific: Nutraceutical Products Market, by Source, 2021-2030 (USD Million)
- Table 112 Asia-Pacific: Nutraceutical Products Market, by Distribution Channel, 2021-2030 (USD Million)
- Table 113 China: Nutraceutical Products Market, by Type, 2021-2030 (USD Million)
- Table 114 China: Functional Food Market, by Type, 2021-2030 (USD Million) (USD Million)
- Table 115 China: Functional Beverages Market, by Type, 2021-2030 (USD Million)
- Table 116 China: Nutraceutical Dietary Supplements Market, by Type, 2021-2030 (USD Million)
- Table 117 China: Nutraceutical Products Market, by Source, 2021-2030 (USD Million)
- Table 118 China: Nutraceutical Products Market, by Distribution Channel, 2021-2030 (USD Million)
- Table 119 India: Nutraceutical Products Market, by Type, 2021-2030 (USD Million)
- Table 120 India: Functional Food Market, by Type, 2021-2030 (USD Million) (USD Million)
- Table 121 India: Functional Beverages Market, by Type, 2021-2030 (USD Million)
- Table 122 India: Nutraceutical Dietary Supplements Market, by Type, 2021-2030 (USD Million)
- Table 123 India: Nutraceutical Products Market, by Source, 2021-2030 (USD Million)
- Table 124 India: Nutraceutical Products Market, by Distribution Channel, 2021-2030 (USD Million)
- Table 125 Japan: Nutraceutical Products Market, by Type, 2021-2030 (USD Million)
- Table 126 Japan: Functional Food Market, by Type, 2021-2030 (USD Million) (USD Million)
- Table 127 Japan: Functional Beverages Market, by Type, 2021-2030 (USD Million)
- Table 128 Japan: Nutraceutical Dietary Supplements Market, by Type, 2021-2030 (USD Million)
- Table 129 Japan: Nutraceutical Products Market, by Source, 2021-2030 (USD Million)
- Table 130 Japan: Nutraceutical Products Market, by Distribution Channel, 2021-2030 (USD Million)
- Table 131 Australia: Nutraceutical Products Market, by Type, 2021-2030 (USD Million)
- Table 132 Australia: Functional Food Market, by Type, 2021-2030 (USD Million)
- Table 133 Australia: Functional Beverages Market, by Type, 2021-2030 (USD Million)
- Table 134 Australia: Nutraceutical Dietary Supplements Market, by Type, 2021-2030 (USD Million)
- Table 135 Australia: Nutraceutical Products Market, by Source, 2021-2030 (USD Million)
- Table 136 Australia: Nutraceutical Products Market, by Distribution Channel, 2021-2030 (USD Million)
- Table 137 South Korea: Nutraceutical Products Market, by Type, 2021-2030 (USD Million)
- Table 138 South Korea: Functional Food Market, by Type, 2021-2030 (USD Million)
- Table 139 South Korea: Functional Beverages Market, by Type, 2021-2030 (USD Million)
- Table 140 South Korea: Nutraceutical Dietary Supplements Market, by Type, 2021-2030 (USD Million)
- Table 141 South Korea: Nutraceutical Products Market, by Source, 2021-2030 (USD Million)
- Table 142 South Korea: Nutraceutical Products Market, by Distribution Channel, 2021-2030 (USD Million)
- Table 143 Rest of Asia Pacific: Nutraceutical Products Market, by Type, 2021-2030 (USD Million)
- Table 144 Rest of Asia Pacific: Functional Food Market, by Type, 2021-2030 (USD Million) (USD Million)
- Table 145 Rest of Asia Pacific: Functional Beverages Market, by Type, 2021-2030 (USD Million)
- Table 146 Rest of Asia Pacific: Nutraceutical Dietary Supplements Market, by Type, 2021-2030 (USD Million)
- Table 147 Rest of Asia Pacific: Nutraceutical Products Market, by Source, 2021-2030 (USD Million)
- Table 148 Rest of Asia Pacific: Nutraceutical Products Market, by Distribution Channel, 2021-2030 (USD Million)
- Table 149 Latin America: Nutraceutical Products Market, by Country/Region, 2021-2030 (USD Million)
- Table 150 Latin America: Nutraceutical Products Market, by Type, 2021-2030 (USD Million)
- Table 151 Latin America: Functional Food Market, by Type, 2021-2030 (USD Million) (USD Million)
- Table 152 Latin America: Functional Beverages Market, by Type, 2021-2030 (USD Million)
- Table 153 Latin America: Nutraceutical Dietary Supplements Market, by Type, 2021-2030 (USD Million)
- Table 154 Latin America: Nutraceutical Products Market, by Source, 2021-2030 (USD Million)
- Table 155 Latin America: Nutraceutical Products Market, by Distribution Channel, 2021-2030 (USD Million)
- Table 156 Brazil: Nutraceutical Products Market, by Type, 2021-2030 (USD Million)
- Table 157 Brazil: Functional Food Market, by Type, 2021-2030 (USD Million)
- Table 158 Brazil: Functional Beverages Market, by Type, 2021-2030 (USD Million)
- Table 159 Brazil: Nutraceutical Dietary Supplements Market, by Type, 2021-2030 (USD Million)
- Table 160 Brazil: Nutraceutical Products Market, by Source, 2021-2030 (USD Million)
- Table 161 Brazil: Nutraceutical Products Market, by Distribution Channel, 2021-2030 (USD Million)
- Table 162 Mexico: Nutraceutical Products Market, by Type, 2021-2030 (USD Million)
- Table 163 Mexico: Functional Food Market, by Type, 2021-2030 (USD Million) (USD Million)
- Table 164 Mexico: Functional Beverages Market, by Type, 2021-2030 (USD Million)
- Table 165 Mexico: Nutraceutical Dietary Supplements Market, by Type, 2021-2030 (USD Million)
- Table 166 Mexico: Nutraceutical Products Market, by Source, 2021-2030 (USD Million)
- Table 167 Mexico: Nutraceutical Products Market, by Distribution Channel, 2021-2030 (USD Million)
- Table 168 Argentina: Nutraceutical Products Market, by Type, 2021-2030 (USD Million)
- Table 169 Argentina: Functional Food Market, by Type, 2021-2030 (USD Million) (USD Million)
- Table 170 Argentina: Functional Beverages Market, by Type, 2021-2030 (USD Million)
- Table 171 Argentina: Nutraceutical Dietary Supplements Market, by Type, 2021-2030 (USD Million)
- Table 172 Argentina: Nutraceutical Products Market, by Source, 2021-2030 (USD Million)
- Table 173 Argentina: Nutraceutical Products Market, by Distribution Channel, 2021-2030 (USD Million)
- Table 174 Rest of Latin America: Nutraceutical Products Market, by Type, 2021-2030 (USD Million)
- Table 175 Rest of Latin America: Functional Food Market, by Type, 2021-2030 (USD Million)
- Table 176 Rest of Latin America: Functional Beverages Market, by Type, 2021-2030 (USD Million)
- Table 177 Rest of Latin America: Nutraceutical Dietary Supplements Market, by Type, 2021-2030 (USD Million)
- Table 178 Rest of Latin America: Nutraceutical Products Market, by Source, 2021-2030 (USD Million)
- Table 179 Rest of Latin America: Nutraceutical Products Markets, by Distribution Channel, 2021-2030 (USD Million)
- Table 180 Middle East & Africa: Nutraceutical Products Market Size, by Type, 2021-2030 (USD Million)
- Table 181 Middle East & Africa: Functional Food Market Size, by Type, 2021-2030 (USD Million) (USD Million)
- Table 182 Middle East & Africa: Functional Beverages Market Size, by Type, 2021-2030 (USD Million)
- Table 183 Middle East & Africa: Nutraceutical Dietary Supplements Market Size, by Type, 2021-2030 (USD Million)
- Table 184 Middle East & Africa: Nutraceutical Products Market Size, by Source, 2021-2030 (USD Million)
- Table 185 Middle East & Africa: Nutraceutical Products Market Size, by Distribution Channel, 2021-2030 (USD Million)
- Table 186 Recent Developments, by Company (2020-2023)
According to the research report titled, 'Nutraceutical Products Market by Type (Functional Food {Confectionery Products, Dairy Products}, Functional Beverages, Dietary Supplements), Source (Vitamin, Mineral), Distribution Channel (Specialty Stores, E-commerce)-Global Forecast to 2030, the global nutraceutical products market is projected to reach $691.87 billion by 2030, at a CAGR of 7.8% from 2023-2030. The report provides an in-depth analysis of the global nutraceutical products market across five major regions, emphasizing the current market trends, market size, and recent developments and providing the forecast till 2030.
Succeeding extensive secondary and primary research and an in-depth analysis of the market scenario, the report conducts the impact analysis of the key industry drivers, restraints, opportunities, challenges, and trends. The growth of this market is driven by the growing demand for nutrition-enriched products, rising demand for functional beverages, increasing geriatric population and prevalence of chronic diseases, and growing innovations and new product developments. Furthermore, the technological advancements in the nutraceutical sector and increased investment and expansion in the functional food and beverages industry will provide significant growth opportunities for nutraceutical products manufacturers in the coming years.
Based on type, in 2023, the functional food segment is expected to account for the largest share of the global nutraceutical products market. The large market share of this segment is attributed to the growing demand for nutritional & fortifying food products and rising awareness about the health benefits of consuming these products. Consumers are increasingly drawn to foods with functional ingredients to lower the risk of specific health concerns, such as obesity, weight loss, diabetes, and cardiovascular diseases, which contribute to the growth of this segment.
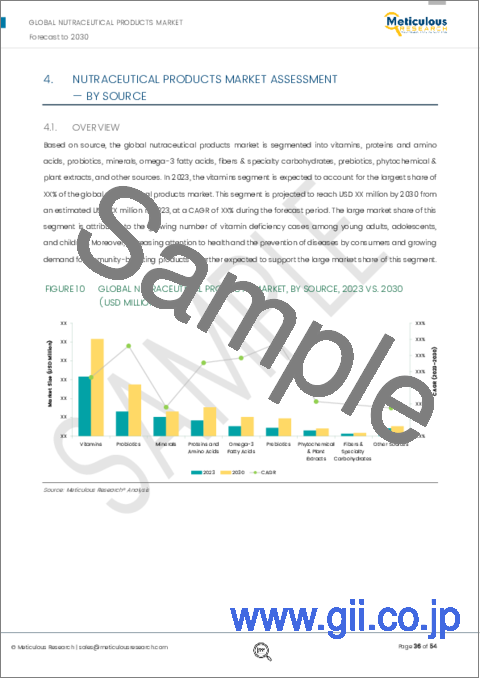
Based on source, the prebiotics segment is slated to register the highest CAGR during the forecast period. The fastest growth of this segment is attributed to the rising chronic disorders and increasing health concerns regarding gut health, increasing consumption of prebiotics, and rising awareness about the benefits of prebiotics. The growing use of prebiotics in infant formulas is expected to create growth opportunities for players in this market.
Based on distribution channel, in 2023, the supermarkets & hypermarkets segment is expected to account for the larger share of the global nutraceutical products market. The large market share of this segment is attributed to the rapid urbanization, rising per capita disposable incomes, consumers' increasing adoption of healthy eating habits, and increased sales of functional food and beverages in well-established supermarkets and hypermarkets.
An in-depth geographic analysis of the industry provides detailed qualitative and quantitative insights into the five major regions (North America, Europe, Asia-Pacific, Latin America, and the Middle East & Africa) and the coverage of major countries in each region. In 2023, North America is expected to account for the largest share of the nutraceutical products market. The large market share of this region is attributed to the well-established food & beverage industry; high awareness of the health benefits of nutraceuticals; the growing popularity of protein bars, shakes, and cookies among millennials; the rising demand for clean-label nutraceutical products; growing vegan trend and increasing health-conscious consumers; and advancements in nutrition and technology.
The key players operating in the global nutraceutical products market are Abbott Laboratories (U.S.), Amway Corporation (U.S.), Conagra Brands, Inc. (U.S.), Danone S.A. (France), General Mills Inc. (U.S.), Glanbia plc (Ireland), Herbalife Nutrition Ltd. (U.S.), International Flavors & Fragrances Inc. (U.S.), Kellogg Company (U.S.), Nestle S.A. (Switzerland), PepsiCo, Inc. (U.S.), The Coca Cola Company (U.S.), Hearthside Food Solutions LLC (U.S.), Mars, Incorporated (U.S.), Meiji Holdings Co., Ltd (Japan), and Royal FrieslandCampina N.V. (Netherlands).
Key Questions Answered in the Report-
- What is the current value of revenue generated by the global nutraceutical products market?
- At what rate is the global nutraceutical products demand projected to grow for the next 5-7 years?
- What are the historical market sizes and growth rates of the global nutraceutical products market?
- What are the major factors impacting the growth of this market at the global and regional levels? What are the major opportunities for existing players and new entrants in the market?
- Which segments in terms of type, source, distribution channel creates major traction for the manufacturers in this market?
- What are the key geographical trends in this market? Which regions/countries are expected to offer significant growth opportunities for the manufacturers operating in the nutraceutical products market?
- Who are the major players in the global nutraceutical products market? What are their specific product offerings in this market?
- What are the recent strategic developments in the global nutraceutical products market? What are the impacts of these strategic developments on the market?
Scope of the Report:
Nutraceutical Products Market Assessment-by Type
- Functional Food
- Dairy Products
- Bakery Products
- Snacks
- Confectionery Products
- Infant Food Products
- Other Functional Food
- Functional Beverages
- Energy Drinks
- Sports Drinks
- Fortified Juices
- Dairy-Based Beverages
- Other Functional Beverages
- Dietary Supplements
- Tablets
- Capsules
- Powder Form
- Liquid Form
- Other Dietary Supplements
Nutraceutical Products Market Assessment-by Source
- Vitamins
- Probiotics
- Minerals
- Proteins and Amino Acids
- Omega-3 Fatty Acids
- Prebiotics
- Phytochemical & Plant Extracts
- Fibers & Specialty Carbohydrates
- Other Sources
Nutraceutical Products Market Assessment-by Distribution Channel
- Supermarkets & Hypermarkets
- Convenience Stores
- Pharmacies & Drug Stores
- Specialty Stores
- E-commerce
- Other Distribution Channel
Nutraceutical Products Assessment-by Geography
- North America
- U.S.
- Canada
- Europe
- U.K.
- Germany
- France
- Spain
- Italy
- Rest of Europe (RoE)
- Asia-Pacific
- China
- India
- Japan
- Australia
- South Korea
- Rest of Asia-Pacific (RoAPAC)
- Latin America
- Brazil
- Mexico
- Argentina
- Rest of Latin America (RoLATAM)
- Middle East & Africa
TABLE OF CONTENTS
1. Market Definition & Scope
- 1.1. Market Definition
- 1.2. Market Ecosystem
- 1.3. Currency
- 1.4. Key Stakeholders
2. Research Methodology
- 2.1. Research Approach
- 2.2. Process of Data Collection and Validation
- 2.2.1. Secondary Research
- 2.2.2. Primary Research / Interviews with Key Opinion Leaders of the Industry
- 2.3. Market Sizing and Forecast
- 2.3.1. Market Size Estimation Approach
- 2.3.2. Growth Forecast Approach
- 2.4. Assumptions for the Study
3. Executive Summary
- 3.1. Overview
- 3.2. Segmental Analysis
- 3.2.1. Nutraceutical Products Market Analysis: by Type
- 3.2.2. Nutraceutical Products Market Analysis: by Source
- 3.2.3. Nutraceutical Products Market Analysis: by Distribution Channel
- 3.3. Regional Analysis
- 3.4. Key Players
4. Market Insights
- 4.1. Overview
- 4.2. Drivers
- 4.2.1. Growing Demand for Nutrition-enriched Products
- 4.2.2. Rising Demand for Functional Beverages
- 4.2.3. Increasing Geriatric Population and Prevalence of Chronic Diseases
- 4.2.4. Growing Innovations and New Product Developments
- 4.3. Restraints
- 4.3.1. High Cost of Nutraceutical Products
- 4.4. Opportunities
- 4.4.1. Technological Advancements in the Nutraceutical Sector
- 4.4.2. Increased Investment and Expansions in the Functional Food and Beverages Industry
- 4.5. Challenges
- 4.5.1. Counterfeiting in the Nutraceutical Industry
- 4.6. Trends
- 4.6.1. Healthy Snacking
- 4.6.2. Clean-Label
5. Nutraceutical Products Market Assessment- by Type
- 5.1. Overview
- 5.2. Functional Food
- 5.2.1. Dairy Products
- 5.2.2. Bakery Products
- 5.2.3. Snacks
- 5.2.4. Confectionery Products
- 5.2.5. Infant Food Products
- 5.2.6. Other Functional Food
- 5.3. Functional Beverages
- 5.3.1. Energy Drinks
- 5.3.2. Sports Drinks
- 5.3.3. Fortified Juices
- 5.3.4. Dairy-Based Beverages
- 5.3.5. Other Functional Beverages
- 5.4. Dietary Supplements
- 5.4.1. Tablets
- 5.4.2. Capsules
- 5.4.3. Powder Form
- 5.4.4. Liquid Form
- 5.4.5. Other Dietary Supplements
6. Nutraceutical Products Market Assessment - by Source
- 6.1. Overview
- 6.2. Vitamins
- 6.3. Probiotics
- 6.4. Minerals
- 6.5. Proteins and Amino Acids
- 6.6. Omega-3 Fatty Acids
- 6.7. Prebiotics
- 6.8. Phytochemical & Plant Extracts
- 6.9. Fibers & Specialty Carbohydrates
- 6.10. Other Sources
7. Nutraceutical Products Market Assessment - by Distribution Channel
- 7.1. Overview
- 7.2. Supermarkets & Hypermarkets
- 7.3. Convenience Stores
- 7.4. Pharmacies & Drug Stores
- 7.5. Specialty Stores
- 7.6. E-Commerce
- 7.7. Other Distribution Channels
8. Nutraceutical Products Market Assessment - by Geography
- 8.1. Overview
- 8.2. North America
- 8.2.1. U.S.
- 8.2.2. Canada
- 8.3. Europe
- 8.3.1. U.K.
- 8.3.2. Germany
- 8.3.3. France
- 8.3.4. Spain
- 8.3.5. Italy
- 8.3.6. Rest of Europe (RoE)
- 8.4. Asia-Pacific
- 8.4.1. China
- 8.4.2. India
- 8.4.3. Japan
- 8.4.4. Australia
- 8.4.5. South Korea
- 8.4.6. Rest of Asia-Pacific (RoAPAC)
- 8.5. Latin America
- 8.5.1. Brazil
- 8.5.2. Mexico
- 8.5.3. Argentina
- 8.5.4. Rest of Latin America (RoLATAM)
- 8.6. Middle East & Africa
9. Competition Analysis
- 9.1. Overview
- 9.2. Key Growth Strategies
- 9.3. Competitive Dashboard
- 9.3.1. Industry Leaders
- 9.3.2. Market Differentiators
- 9.3.3. Vanguards
- 9.3.4. Emerging Companies
- 9.4. Vendor Market Positioning
10. Company Profiles (Business Overview, Financial Overview, Product Portfolio, and Strategic Developments)
- 10.1. Abbott Laboratories
- 10.2. Amway Corporation
- 10.3. Conagra Brands, Inc.
- 10.4. Danone S.A.
- 10.5. General Mills Inc.
- 10.6. Glanbia plc
- 10.7. Herbalife Nutrition, Ltd.
- 10.8. International Flavors & Fragrances Inc.
- 10.9. Kellogg Company
- 10.10. Nestle S.A.
- 10.11. PepsiCo, Inc.
- 10.12. The Coca-Cola Company
- 10.13. Hearthside Food Solutions LLC
- 10.14. Mars, Incorporated
- 10.15. Meiji Holdings Co., Ltd.
- 10.16. Royal FrieslandCampina N.V.
11. Appendix
- 11.1. Available Customization
- 11.2. Related Reports