|
|
市場調査レポート
商品コード
1718485
スマート商業ビルにおけるIoTプラットフォーム市場(2025年~2030年)- IoT市場規模と競合情勢IoT Platforms in Smart Commercial Buildings 2025 to 2030 - Total IoT Market Sizing & Competitive Landscape |
||||||
|
|||||||
|
|||||||

| スマート商業ビルにおけるIoTプラットフォーム市場(2025年~2030年)- IoT市場規模と競合情勢 |
|
出版日: 2025年05月06日
発行: Memoori
ページ情報: 英文 152 Pages, 18 Charts and Tables, 3 Spreadsheets, Presentation Slides
納期: 即日から翌営業日
|

全表示
- 概要
- 図表
- 目次
スマートビルにおけるIoTプラットフォームのエコシステムをナビゲート:2030年までの完全市場分析
商業ビルが応答性の高いデータ駆動型の環境へと変化する中、IoTプラットフォームは、これまで分離されていたシステムを統合ネットワークに接続する重要なオーケストレーション層として浮上しています。この包括的なレポートでは、世界のビルIoT市場が2030年までに1,010億米ドルに成長し、オフィス、小売店、ホスピタリティ、データセンターなどの不動産運用がどのように再構築されるかを明らかにしています。
当社の分析では、断片化されたIoTプラットフォームのエコシステムを明確にし、2030年までの主要ベンダーのアーキテクチャ進化、競合ポジショニング、戦略ロードマップを検証しています。3つのシナリオにわたる詳細な市場予測と、さまざまな利害関係者グループに合わせた実行可能な提言により、当レポートは、新たなテクノロジーを活用し、テクノロジー投資を測定可能なビジネス成果に結びつけるために必要な戦略的インテリジェンスを提供します。
本調査には、3つのスプレッドシートと高解像度の図表を含むプレゼンテーションファイルが含まれています。当レポートは2025年IoTレポートシリーズの第2弾であり、第1弾はIoTデバイスに関するものです。この調査は、当社の2025エンタープライズ・サブスクリプション・サービス.
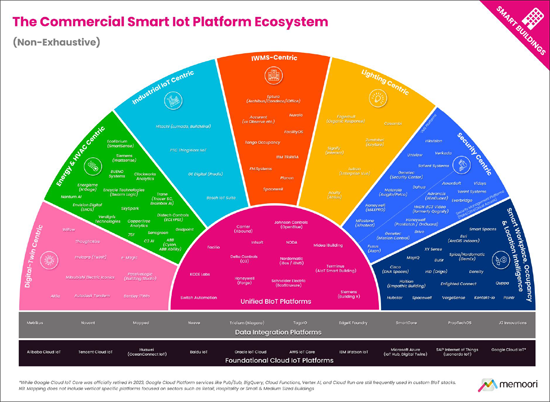
当レポートでは、細分化され急速に進化するBIoTプラットフォーム・ソリューション市場をナビゲートするために、IoTプラットフォーム・エコシステムのハイレベル・マッピング(上記参照)と、付録Aに示す構造化されたプラットフォーム比較という2つの重要なリソースを提供しています。市場に関する広範かつ体系的な調査を実施しましたが、エコシステムマップはすべてのベンダーを網羅することを意図したものではないことに留意することが必要です。
本マッピングでは、Memooriは各プラットフォームを、その主要な戦略的ポジショニングとプラットフォーム機能を最もよく反映していると評価できるセグメントに分類しました。
IoTプラットフォームに関する主な質問
- IoTプラットフォームを評価する際、組織はどのような主要機能を探すべきか?ベンダーのロックインを防ぐオープンアーキテクチャ、ベンダーニュートラルな統合のための独立したデータレイヤー、そして強固なセキュリティプロトコルに注目すべきです。大手ベンダーによる統一プラットフォームの動向にもかかわらず、単一のプロバイダーがすべてのビルシステムにわたって包括的なソリューションを提供しているわけではありません。組織は、ベスト・オブ・ブリードのソリューションが効果的に連携できるような相互運用性とモジュラー・アプローチを優先すべきです。
- AIは、マーケティング上の誇大広告を超えて、ビル運営をどのように変革しているのか?AIは、3つの明らかな分野で理論から実践へと移行しつつあります。積極的なHVAC調整を可能にする稼働予測、従来の方法より数日早く機器の故障を特定する故障検出アルゴリズム、そして消費量を15~25%削減する自律的エネルギー最適化です。以下のような企業がBrainBox AIのような企業はのような企業が買収されています。しかし、純粋にAI主導のプラットフォームと、"人工知能"の名を借りたルールベースの自動化を提供するだけのプラットフォームとでは、市場は依然として分断されています。
- 競合情勢について、最近のM&Aは何を明らかにしているのか?2023年以降に行われた168億米ドルのM&A取引は、従来のOEMがデジタル・プラットフォームを将来の収益モデルの中心に位置付けていることを示しています。以下のような企業バイヤーTraneやSchneider Electricなどの企業バイヤーが買収の中心となっており、持続可能性の動向に沿った資本力のあるプラットフォームに投資が集中しています。小規模ベンダーは、統合プラットフォームに対抗するため、特化した機能や異なるビジネスモデル別差別化を図る必要に迫られています。
152ページと18の図表で構成される当レポートでは、すべての重要な事実を抽出し、結論を導き出しているため、何が商業用スマートビルの未来を形成しているのかを正確に理解することができます。
- 実行可能な変革ロードマップ:ビル所有者、プラットフォームベンダー、施設管理者、投資家向けにカスタマイズされた戦略的提言を活用することで、当面の導入障壁に対処するとともに、新たなプラットフォームの融合動向を活用できるよう組織を整えます。
- マルチシナリオ市場予測:2030年までの成長予測を技術カテゴリー別、ビルタイプ別、地域別に分類し、3つの経済シナリオにわたる詳細な予測により、かつてない市場の不確実性をナビゲートします。
- 包括的なベンダー情勢分析:マルチシステム統合、エッジコンピューティング、セキュリティプロトコル、AI実装の成熟度における実際の能力を明らかにするために、マーケティング上の主張を切り開く当社独自の評価フレームワークを使用して87のプラットフォームプロバイダーを評価します。
当レポートは、企業が戦略的プランニングを改善し、事業開発の可能性を検討するための貴重な情報を提供します。
当レポートの購入対象者
ビル所有者、テクノロジープロバイダー、投資家にとって、この進化する情勢を理解することは、複雑化する市場で競争優位性を維持するために不可欠となっています。
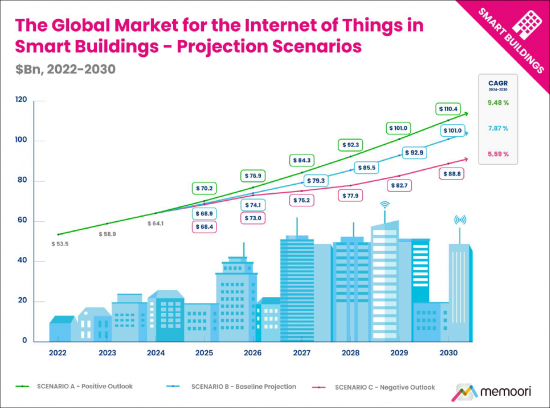
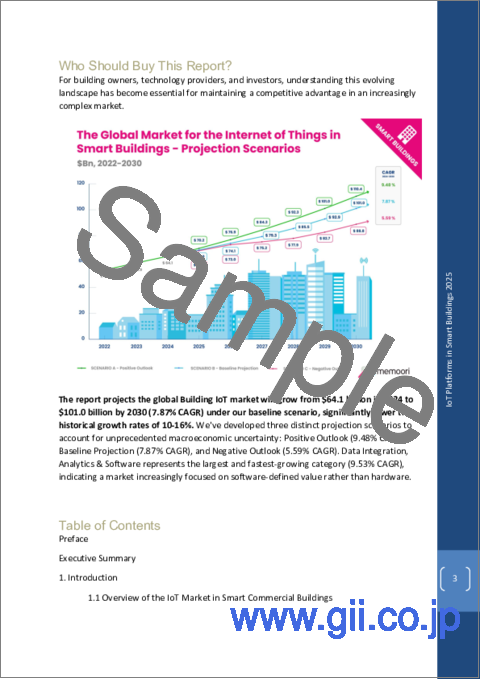
当レポートでは、世界のビルディングIoTの市場規模は、ベースラインシナリオでは2024年の641億米ドルから2030年には1,010億米ドル(CAGR 7.87%)に成長すると予測されており、過去の成長率10~16%を大幅に下回ります。前例のないマクロ経済の不確実性を考慮し、3つの異なる予測シナリオを開発した:ポジティブ・アウトルック(CAGR 9.48%)、ベースライン予測(CAGR 7.87%)、ネガティブ・アウトルック(CAGR 5.59%)です。データ統合、アナリティクス、ソフトウェアは、最大かつ最も急速に成長しているカテゴリー(CAGR 9.53%)であり、市場がハードウェアよりもソフトウェア定義の価値にますます焦点を当てていることを示しています。
目次
序文
エグゼクティブサマリー
第1章 イントロダクション
- スマート商業ビルにおけるIoT市場の概要
- BIoTサプライチェーンのマッピング
- IoTソリューションの成熟と市場の進化
第2章 BIoT市場に影響を与える経済的および政策的圧力
- 貿易戦争の影響評価
- 米中貿易と技術摩擦
- より広範な地域貿易と政策への影響
- より広範なテクノロジー市場の現状評価
第3章 市場規模の評価と地域分析
- 市場予測シナリオ
- シナリオフレームワークと前提
- シナリオ予測
- 世界市場の内訳
- ハードウェア、ソフトウェア、サービス別の市場内訳
- 建物分野別市場内訳
- 用途別市場内訳
- 地域予測と分析
- 北米
- ラテンアメリカ
- アジア太平洋
- 欧州
- 中東・アフリカ
第4章 IoTプラットフォーム
- スマート商業ビルにおけるIoTプラットフォームの役割
- BIoTスタック
第5章 IoTプラットフォームのエコシステムと競合情勢
- IoTプラットフォームエコシステムのマッピング
- 競合情勢の評価
- 基盤となるクラウドIoTプラットフォーム
- データ統合プラットフォーム
- デジタルツイン中心のプラットフォーム
- エネルギーとHVAC中心のプラットフォーム
- 産業用IoT中心のプラットフォーム
- IWMS中心のプラットフォーム
- 照明中心のプラットフォーム
- セキュリティ中心のプラットフォーム
- スマートワークプレイス/ 占有率/ 位置情報インテリジェンスプラットフォーム
- 統合BIoTプラットフォーム
- 業界固有のプラットフォーム
- 注目すべきプラットフォームの動向
- 収束と統合のダイナミクス
- オープンでモジュール型、スケーラブルなBIoTプラットフォームへの移行
- 進化する計算モデル
- AI、分析、自律制御
- 進化するビジネスモデル
- リスク管理
- 地域市場力学と市場の分岐
- 利害関係者への提言
- BIoTプラットフォームにおける一般的な課題の解決
- プラットフォーム成熟度を評価するためのチェックリスト
- ステークホルダーグループ別戦略的提言
第6章 M&Aと投資の動向
- 投資
- 合併と買収
List of Charts and Figures
- Fig 1.1: The Internet of Things in Smart Commercial Buildings 2025 v6.0
- Fig 1.2: The BIoT Supply Chain
- Fig 1.3: BIoT Solution Maturity
- Fig 2.1: US/China Trade Barriers - A Timeline - 2018 to Present
- Fig 3.1: The Global Market for the Internet of Things in Smart Building - Projection Scenarios to 2030
- Fig 3.2: The Global Market for the Internet of Things in Smart Building, Breakdown by Hardware, Software & Services 2024
- Fig 3.3: Market Breakdown by Hardware, Software & Services, Breakdown by Category 2024
- Fig 3.4: The Internet of Things in Smart Commercial Buildings Market by Vertical 2024
- Fig 3.5: The Internet of Things in Smart Commercial Buildings Market by Application 2024
- Fig 3.6: Regional Growth Indicators
- Fig 3.7: The Internet of Things in Smart Commercial Buildings Market by Region 2024
- Fig 3.8: The Market for the Internet of Things in Smart Commercial Buildings North America 2024
- Fig 3.9: The Market for the Internet of Things in Smart Commercial Buildings Latin America 2024
- Fig 3.10: The Market for the Internet of Things in Smart Commercial Buildings Asia Pacific 2024
- Fig 3.11: The Market for the Internet of Things in Smart Commercial Buildings Europe 2024
- Fig 3.12: The Market for the Internet of Things in Smart Commercial Buildings Middle East & Africa 2024
- Fig 4.1: Typical IoT Platform Functionality
- Fig 5.1: The Commercial Smart IoT Platform Ecosystem
- Appendix A - BIoT Platform Comparison Matrix
- Appendix B - M&A & Investments Summary
Navigate the Smart Building IoT Platforms Ecosystem: Complete Market Analysis Through to 2030
As commercial buildings transform into responsive, data-driven environments, IoT platforms have emerged as the critical orchestration layer connecting previously isolated systems into unified networks. This comprehensive report reveals how the global Building IoT market will grow to $101 billion by 2030, reshaping property operations across offices, retail, hospitality, and data centers.
Our analysis provides clarity on the fragmented IoT platforms ecosystem, examining the architectural evolution, competitive positioning, and strategic roadmaps of key vendors through to 2030. With detailed market forecasts across three scenarios and actionable recommendations tailored to different stakeholder groups, this report delivers the strategic intelligence needed to capitalize on emerging technologies and align technology investments with measurable business outcomes.
The research includes 3 spreadsheets AND a presentation file with high-resolution versions of the charts. It is the 2nd in our 2025 series of IoT reports, with the 1st on IoT Devices. The research is included in our 2025 Enterprise Subscription Service.
To help navigate the fragmented and rapidly evolving market for BIoT platform solutions, this report provides two key resources: a high-level mapping of the IoT platform ecosystem (see above) and a structured platform comparison presented in Appendix A. While we conducted a broad and systematic survey of the market, it is important to note that the Ecosystem Map is not intended to include every single vendor.
It should also be noted that many vendors could arguably fit into multiple segments, depending on how their portfolios and go-to-market strategies are interpreted. For the purposes of this mapping, Memoori has placed each platform into the segment that we assess best reflects its primary strategic positioning and platform functionality.
KEY QUESTIONS ADDRESSED ABOUT IOT PLATFORMS:
- What key capabilities should organizations look for when evaluating IoT platforms? Look for open architectures to prevent vendor lock-in, independent data layers for vendor-neutral integration, and robust security protocols. Despite the trend toward unified platforms from major vendors, no single provider offers comprehensive solutions across all building systems. Organizations should prioritize interoperability and modular approaches that allow best-of-breed solutions to work together effectively.
- How is AI transforming building operations beyond the marketing hype? AI is moving from theory to practice in three obvious areas: occupancy prediction that enables proactive HVAC adjustments, fault detection algorithms that identify equipment failures days before traditional methods, and autonomous energy optimization that reduces consumption by 15-25%. Companies like BrainBox AI are being acquired specifically for these capabilities. However, the market remains fragmented between genuinely AI-driven platforms and those merely offering rule-based automation rebranded as "artificial intelligence."
- What does recent M&A activity reveal about the competitive landscape? The $16.8 billion in M&A transactions since 2023 shows traditional OEMs positioning digital platforms at the center of future revenue models. Corporate buyers like Trane and Schneider Electric are dominating acquisitions, while investment is concentrating among well-capitalized platforms aligned with sustainability trends. Smaller vendors face growing pressure to differentiate through specialized functionality or different business models to compete against integrated platforms.
WITHIN ITS 152 PAGES AND 18 CHARTS AND TABLES, THE REPORT FILTERS OUT ALL THE KEY FACTS AND DRAWS CONCLUSIONS, SO YOU CAN UNDERSTAND EXACTLY WHAT IS SHAPING THE FUTURE OF COMMERCIAL SMART BUILDINGS.
- Actionable Transformation Roadmaps: Leverage tailored strategic recommendations for building owners, platform vendors, facility managers, and investors that address immediate adoption barriers while positioning organizations to capitalize on emerging platform convergence trends.
- Multi-Scenario Market Forecasts: Navigate unprecedented market uncertainty with detailed projections across three economic scenarios, breaking down growth expectations by technology category, building type, and geographic region through 2030.
- Comprehensive Vendor Landscape Analysis: Evaluate 87 platform providers using our proprietary assessment framework that cuts through marketing claims to reveal actual capabilities in multi-system integration, edge computing, security protocols, and AI implementation maturity.
This report provides valuable information to companies so they can improve their strategic planning exercises AND look at the potential for developing their business.
WHO SHOULD BUY THIS REPORT?
For building owners, technology providers, and investors, understanding this evolving landscape has become essential for maintaining a competitive advantage in an increasingly complex market.
The report projects the global Building IoT market will grow from $64.1 billion in 2024 to $101.0 billion by 2030 (7.87% CAGR) under our baseline scenario, significantly lower than historical growth rates of 10-16%. We've developed three distinct projection scenarios to account for unprecedented macroeconomic uncertainty: Positive Outlook (9.48% CAGR), Baseline Projection (7.87% CAGR), and Negative Outlook (5.59% CAGR). Data Integration, Analytics & Software represents the largest and fastest-growing category (9.53% CAGR), indicating a market increasingly focused on software-defined value rather than hardware.
Table of Contents
Preface
Executive Summary
1. Introduction
- 1.1. Overview of the IoT Market in Smart Commercial Buildings
- 1.2. Mapping the BIoT Supply Chain
- 1.3. IoT Solution Maturity and Market Evolution
2. Economic and Policy Pressures Impacting BIoT Markets
- 2.1. Evaluating the Impact of the Trade War
- 2.1.1. US-China Trade and Technology Tensions
- 2.1.2. Broader Regional Trade and Policy Impacts
- 2.2. Evaluating the State of Broader Technology Markets
3. Market Sizing & Regional Analysis
- 3.1. Market Projection Scenarios
- 3.1.1. Scenario Framework and Assumptions
- 3.1.2. Scenario Forecasts
- 3.2. Global Market Breakdowns
- 3.2.1. Market Breakdown by Hardware, Software & Services
- 3.2.2. Market Breakdown by Building Vertical
- 3.2.3. Market Breakdown by Application
- 3.3. Regional Forecasts & Analysis
- 3.3.1. North America
- 3.3.2. Latin America
- 3.3.3. Asia Pacific
- 3.3.4. Europe
- 3.3.5. Middle East & Africa
4. IoT Platforms
- 4.1. The Role of IoT Platforms in Smart Commercial Buildings
- 4.2. The BIoT Stack
5. The IoT Platform Ecosystem & Competitive Landscape
- 5.1. Mapping the IoT Platform Ecosystem
- 5.2. Evaluating the Competitive Landscape
- 5.2.1. Foundational Cloud IoT Platforms
- 5.2.2. Data Integration Platforms
- 5.2.3. Digital Twin-Centric Platforms
- 5.2.4. Energy & HVAC-Centric Platforms
- 5.2.5. Industrial IoT-Centric Platforms
- 5.2.6. IWMS-Centric Platforms
- 5.2.7. Lighting-Centric Platforms
- 5.2.8. Security-Centric Platforms
- 5.2.9. Smart Workplace / Occupancy / Location Intelligence Platforms
- 5.2.10. Unified BIoT Platforms
- 5.2.11. Vertical Specific Platforms
- 5.3. Notable Platform Trends
- 5.3.1. Convergence and Integration Dynamics
- 5.3.2. A Shift Towards Open, Modular, and Scalable BIoT Platforms
- 5.3.3. Evolving Computational Models
- 5.3.4. AI, Analytics, and Autonomous Control
- 5.3.5. Evolving Business Models
- 5.3.6. Risk Management
- 5.3.7. Regional Market Dynamics & Market Bifurcation
- 5.4. Recommendations for Stakeholders
- 5.4.1. Navigating Common Challenges in BIoT Platforms
- 5.4.2. A Checklist for Evaluating Platform Maturity
- 5.4.3. Strategic Recommendations by Stakeholder Group
6. M&A & Investment Trends
- 6.1. Investments
- 6.1.1. Notable Investment Trends
- 6.2. Mergers & Acquisitions
- 6.2.1. Notable M&A Trends
